WholvolTotal Volume Of Crypto Pairs Based on TV Top Exchanges
See the whole volume with additional feature and options.
Report volume data in USD, BTC, itSelf.
See each exchange Share and Volume.
Static and Dynamic value filtering.
MAs crosses.
Note.1
Due to the pine limitations, we have selected the most important Exchanges which have valuable volume.
Note.2
When you choose to report stats in BTC unit and you have chart of altcoins, the BTC source price will extract from your pair exchange.
Note.3
When you choose to report stats in USD unit, Historical volume data worth will calculated using your entered source price BUT on Realtime data, script will use latest price(close) as source price.
Note.4
You must only select the exchanges which support your pair, otherwise you will see error.
在腳本中搜尋"ma cross"

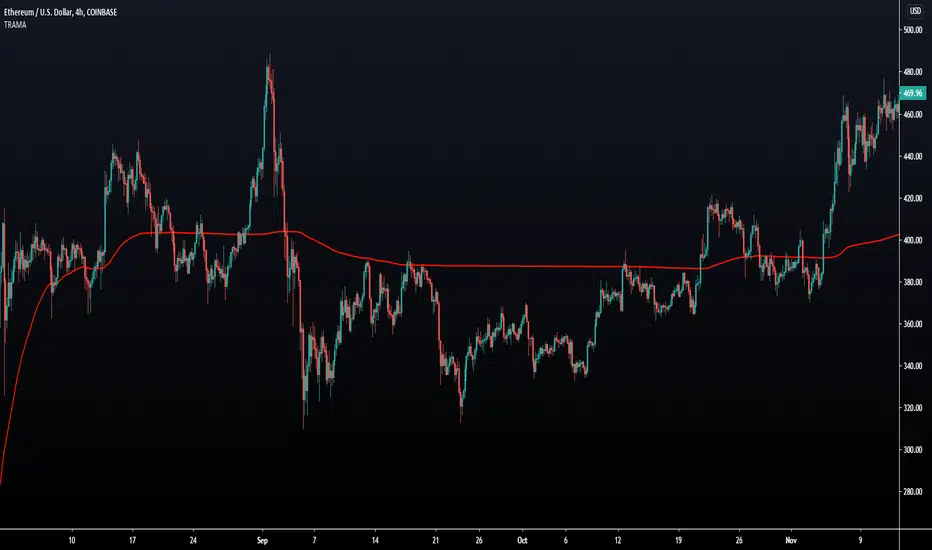
Trend Regularity Adaptive Moving Average [LuxAlgo]The following moving average adapt to the average number of highest high/lowest low made over a specific period, thus adapting to trend strength. Interesting results can be obtained when using the moving average in a MA crossover system or as a trailing support/resistance.
Settings
Length : Period of the indicator, with higher values returning smoother results.
Src : Source input of the indicator.
Usage
The trend regularity adaptive moving average (TRAMA) can be used like most moving averages, with the advantage of being smoother during ranging markets.
Notice how the moving closer to the price the longer a trend last, such effect can be practical to have early entry points when using the moving average in a MA crossover system, such effect is due to the increasing number of average highest high/lowest low made during longer trends. Note that in the case of a significant uptrend followed by a downtrend, the moving average might penalize the start of the downtrend (and vice versa).
The moving average can also act as an interesting trailing support/resistance.
Details
The moving average is calculated using exponential averaging, using as smoothing factor the squared simple moving average of the number of highest high/lowest low previously made, highest high/lowest low are calculated using rolling maximums/minimums.
Using higher values of length will return fewer highest high/lowest low which explains why the moving average is smoother for higher length values. Squaring allows the moving average to penalize lower values, thus appearing more stationary during ranging markets, it also allows to have some consistency regarding the length setting.
🧙 this moving average would not be possible without the existence of corn syrup 🦎
Trend Indicator for Directional Trading (main)TIDT is a two-part trend-based indicator that aims to recognize the general direction and help you identify good opportunities for going long or short. This is the main indicator that is plotted on the chart and is comprised of 3 Moving Averages over which you have full control. You can choose between the following 7 types:
- Simple Moving Average (SMA)
- Exponential Moving Average (EMA)
- Weighted Moving Average (WMA)
- Running Moving Average (RMA)
- Hull Moving Average (HMA)
- Volume Weighted Moving Average (VWMA)
- Arnaud Legoux Moving Average (ALMA)
For clarity of the trend whenever a fast MA crosses up or down a slower MA, the slower one changes its color. The faster MA changes color based on its direction.
Depending on your MA preferences and their period, you generate two main signal types:
1) Moving Average Bounce Signals - You will get a signal whenever the price bounces off, nearly touches or pierces your first MA (depending on your settings as described below)
2) Pullback / Retracement Signals - You will get a signal whenever a trend is established and the price retraces, thus giving you an optimal entry.
I've included 3 additional settings that you can tweak in order to reduce the noise or get more signals, all depending on your risk tolerance and trading style. Configuring these settings will filter the results you get in "Moving Average Bounce Signals". They are as follows:
1) Trend Strength - identifies ranging areas and helps you avoid choppy markets. The higher number, the stronger the trend must be for a signal.
2) Buffer Zone - allows you to receive a signal whenever price approaches your first MA. This way you will not miss a signal if the price doesn't bounce off your MA, or it will notify you in advance of a possible bounce/breakdown.
3) Max Candles Beyond MA - gives you a signal even if the price doesn't bounce off your first MA, but goes through it and then goes back up. You can select how many candles can close beyond the MA before invalidating the signal. Currently, the maximum number of candles that can close beyond the first MA is 5. This is done for your own practicality.
Almost all available options can be configured including the colors of the different signals - Bounces, Pullbacks, MA piercing depending on the number of candles, etc.
The second part of the indicator (called the same way with "add-on" at the end) is meant to complement this one and show additional trending signals, as well as Bull and Bear Divergences. For better results, both indicators must be used at the same time.
Please, note that like any other indicator, this one does exactly this - it indicates a good possibility of an entry, but does not guarantee profitability. Any indicator must be used as part of a system and strict money-management rules.
If you have any questions regarding the indicator or suggestions on how it could be improved, please let me know in the comment section below. Thank you.

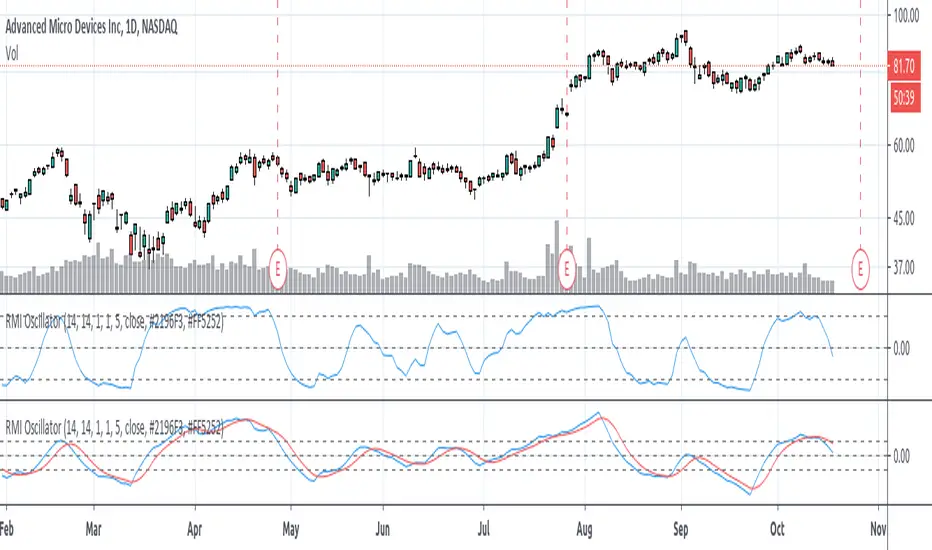
Relative Momentum Index (RMI) OscillatorThe Relative Momentum Index (RMI) is a sibling to the RSI. Where the RSI measures trend based on the average (RMA) of gains and draws over a length of time , the RMI measures based on the SUM of gains and draws . Myself and many others have found that the RMI oscillates better than the RSI does.
I paired the RMI with the oscillation method the Fisher Transformation uses to oscillate the value from -1.0 to 1.0 instead of the Stochastic way of 0 to 100. This way you can enable the Fisher transform, if desired. But I also just prefer the appearance of that.
Some options and features I have coded in-
RMI Length: This is the length of the Relative Momentum Index itself. Like the length of RSI, default 14
Oscillation Length: This is your oscillation length, like a Stochastic. If you put the length at 1 it will turn the indicator into the straight up RMI indicator. (If you select to use the Fisher Transform, the overbought/oversold lines will not show nicely)
Source Pre-Smoothing: The option of smoothing out the source, ie close, before you even run it through the RMI, oscillation, and/or transform
Oscillator Post-Smoothing: The option of smoothing the output of the script
Trailing MA: If desired, you can check the box to Use a Trailing Signal, and enter the length of lookback for a Simple Moving Average (SMA) of the RMI Osc value
Use Fill Colors on MA: If enabled, it will fill the area between the RMI Osc and the trailing MA. I chose to use colors that are similar to some educational ideas I have published, whereby nearing the bottom of the oscillation you get Green to signal Accumulation, and near the top you get Red to signal Distribution. Following red is Black, where you typically get late signal sellers that Capitulate and sell stops trigger. Blue is where traders tend to Chase price up.
The most primitive way of using this indicator would be sell when the value exceeds the overbought/top line and buy when it falls below the oversold/bottom line. You can find ways to use the fill colors, or MA crossovers, rising lows or rising highs, etc. for signals.
Here's a comparison of this indicator to the Stochastic RSI, using similar values-
Here's showing the indicator on intraday values at defaults with some pre- and post-smoothing-
Same thing, but with Fisher Transform enabled-
And an example of the fill bands in action-
Please feel free to use any part of this code as desired.
Combo Strategy 123 Reversal & EMA & MA Crossover This is combo strategies for get a cumulative signal.
First strategy
This System was created from the Book "How I Tripled My Money In The
Futures Market" by Ulf Jensen, Page 183. This is reverse type of strategies.
The strategy buys at market, if close price is higher than the previous close
during 2 days and the meaning of 9-days Stochastic Slow Oscillator is lower than 50.
The strategy sells at market, if close price is lower than the previous close price
during 2 days and the meaning of 9-days Stochastic Fast Oscillator is higher than 50.
Second strategy
The Moving Average Crossover trading strategy is possibly the most popular
trading strategy in the world of trading. First of them were written in the
middle of XX century, when commodities trading strategies became popular.
This strategy is a good example of so-called traditional strategies.
Traditional strategies are always long or short. That means they are never
out of the market. The concept of having a strategy that is always long or
short may be scary, particularly in today’s market where you don’t know what
is going to happen as far as risk on any one market. But a lot of traders
believe that the concept is still valid, especially for those of traders who
do their own research or their own discretionary trading.
This version uses crossover of moving average and its exponential moving average.
WARNING:
- For purpose educate only
- This script to change bars colors.

Point and Figure (PnF) Moving Averages HistogramThis is live and non-repainting Point and Figure Chart Moving Average Histogram tool. The script has it’s own P&F engine and not using integrated function of Trading View.
Point and Figure method is over 150 years old. It consist of columns that represent filtered price movements. Time is not a factor on P&F chart but as you can see with this script P&F chart created on time chart.
P&F chart provide several advantages, some of them are filtering insignificant price movements and noise, focusing on important price movements and making support/resistance levels much easier to identify.
Moving averages on Point & Figure charts are based on the average price of each column while bar chart moving averages are based closing price. Average Price means (ClosePrice + OpenPrice) / 2.
Because of there is double smoothing, you should use shorter lengths for moving averages. Double smoothing means: using average price smooths once, using length greater than 2 smooths price second time.
If you are new to Point & Figure Chart then you better get some information about it before using this tool. There are very good web sites and books. Please PM me if you need help about resources.
Options in the Script
Box size is one of the most important part of Point and Figure Charting. Chart price movement sensitivity is determined by the Point and Figure scale. Large box sizes see little movement across a specific price region, small box sizes see greater price movement on P&F chart. There are four different box scaling with this tool: Traditional, Percentage, Dynamic (ATR), or User-Defined
4 different methods for Box size can be used in this tool.
User Defined: The box size is set by user. A larger box size will result in more filtered price movements and fewer reversals. A smaller box size will result in less filtered price movements and more reversals.
ATR: Box size is dynamically calculated by using ATR, default period is 20.
Percentage: uses box sizes that are a fixed percentage of the stock's price. If percentage is 1 and stock’s price is $100 then box size will be $1
Traditional: uses a predefined table of price ranges to determine what the box size should be.
Price Range Box Size
Under 0.25 0.0625
0.25 to 1.00 0.125
1.00 to 5.00 0.25
5.00 to 20.00 0.50
20.00 to 100 1.0
100 to 200 2.0
200 to 500 4.0
500 to 1000 5.0
1000 to 25000 50.0
25000 and up 500.0
Default value is “ATR”, you may use one of these scaling method that suits your trading strategy.
If ATR or Percentage is chosen then there is rounding algorithm according to mintick value of the security. For example if mintick value is 0.001 and box size (ATR/Percentage) is 0.00124 then box size becomes 0.001.
And also while using dynamic box size (ATR or Percentage), box size changes only when closing price changed.
Reversal : It is the number of boxes required to change from a column of Xs to a column of Os or from a column of Os to a column of Xs. Default value is 3 (most used). For example if you choose reversal = 2 then you get the chart similar to Renko chart.
Source: Closing price or High-Low prices can be chosen as data source for P&F charting.
Options for P&F Bollinger Bands:
MA Type: MA type can be EMA or SMA
MA Source: Moving averages on P&F charts are based on the average price of each column. Bar chart moving averages are based on each close price. Average price means “(ClosePrice + OpenPrice) / 2”. You can choose Close Price or Average Price as source. Default is Average Price.
Fast MA Length : Length of Fast Moving average, shorter length than Slow MA
Slow MA Length : Length of Slow Moving average, greater length than Slow MA
There are alerts when Fast MA Crossed over/under Slow MA conditions. While adding alert “Once Per Bar Close” option should be chosen.

RocketScalper+ Long/Short IndicatorNOTE: To use together with RocketScalper Long/Short Indicator
About the Rocketscalper+ Indicator
Derives from the RocketScalper Long/Short indicator, was worked on by PM
Used by 180+ users as of today
Was first published on Sept 10, 2019
It had 1 iteration so far.
Will be updated as needed so it keeps giving good outputs (so far no update needed).
While the RocketScalper works by merging 3 oscillators and then checking the market balance between sells and buys to give you the final output, the RocketScalper+ uses MA Crossings and adds another layer to filter than final output. It IS NOT an upgrade, use both.
Main notes about the RocketScalper+:
Wavetrend ignored
Took weight off of Godmode for the final output
Added weight to Price Oscillator for the final output
Added TakeProfit and StopLoss conditions editable for users
Turned the scalper more neutral with a slight long bias for the upcoming trend
Has several outputs on the chart that you can activate/deactivate
Long / Short Signals
Self Explanatory / It suggests you should long or short the asset.
Show Price Oscillator signals
It'll output long/short signals based on the Price Oscillator.
Show Stop/Support/Resistance warning
Not working as of now, will need to update it soon.
No Text inputs on this indicator.
Should I use it on all timeframes and all pairs?
Yes, works very well with HTF and for all pairs. As you can see above on BTCUSDT (as an example), on the 6h use it as a confirmation to get in a trade, specially if you also use the TMA.
For access, please DM us or visit the link below in our Signature.

Market Pulse - JDThis indicator gives you a sense of the "heartbeat" of the market.
It measures the price move between two ma-crosses.
And what goes up must come down, so you get an indication of the expected move to "reverse to the mean".
It can be very usefull to identify the famous "Bart patterns" in crypto as shown on the chart example.
Gr. and happy trading,
JD.
#NotTradingAdvice
#DYOR

Strategy Builder Crypto (Single Trend/Plots)Hi everyone
Big program for the daily indicator
This one will be free on trial only for a week because it has an immense value and required quite a lot of work. For more info to use it long-term, please DM me
That out of the way, let's dive right in...
This is a huge upgrade from that script Ultimate-Algorithm-Builder-Single-Trend
The Tradingview non-pro users will appreciate it because it allows to add the selected subsequent indicators as well. The Pro users too will likely like this feature equally, what the H*** I'm saying :)
This indicator will transform you into what I was in the past... into a quant trader. You'll build your own trading algorithm in a few clicks only
Which timeframe and which assets ?
Short answer : ALL and ALL
You'll have to define the configuration of the tool based on your capital, psychology. For custom configuration of the tool, please DM me directly so that we can discuss further
But a few words of advices anyway :
the bigger the timeframe, the lower the inputs (and vice-versa)
Think about how much $$ you want to make per trade and define your entries from there
Think about how much $$ you can afford to lose per trade and define the supertrend from there
...
Your golden configuration might not work for all assets.
You might have to create some tweaks - for instance you found a great config for BTCUSD but it's not working for ETHUSD, then you can create a copy of your BTCUSD chart and set a new config for ETHUSD
What are the indicators inside :
This fantastic tool that I personally use for my trading detects convergence between the following indicators :
Overlay - meaning if the price close above/below a moving average
Trend Signal - to detect if the the DOW law is broken and predict a possible reversal - en.wikipedia.org/wiki/Dow_theory
In other words, it detects if the higher highs or lower lows sequence is broken
MACD or MACD Zero Lag
MA Cross - Cross of moving averages
Ichimoku - if the price closes below/above the cloud
Supertrend - used to detect polarity zones
TSI Shadow -
Pullback
You'll also have the possibility to define a pullback on a given MA. That means basically that you'll get a convergence and it will only display a signal when it will pullback first
This will reduce your losses in case of invalidation and maximize your gains as it will enter the trade in a better position.
You can define your pullback either based an absolute value or based on a percent distance from the MA
+Example:
Pullback value = 100 means I want a 100 pip/USD distance between the MA pullback and the candle
Pullback percent = 2 means I want a 2% distance between the MA pullback and the candle
The percent option is more generic in my opinion but I let the other available for those who might like it
That's it ?
Almost....You can also setup alerts on the indicator signals so that you won't have to stay days in front of the chart to wait for a signal.
You receive the alert, you check real quick if we're not in front of a support/resistance, if no then take the trade. if yes, I advice waiting for a big pullback - better to be safe than sorry in trading
What If you want a custom version ?
Here are a few custom ideas I could add just for you :
re-enter everytime there is a convergence. So far the indicator is only taking the first convergence. This would give more entries
add the resistances/supports (fibo, pivot)
add the take profit targets and trailing stop loss
..
Please hit me up directly so we can discuss further. Any custom dev will require quite some time so it won't be free
Enjoy that one as I really think it will improve your analyst skills and trading and hopefully make you a few gains (which will make me very happy as I want to help most of you to at least not losing your capital)
Dave

Sexy RSI for sexy tradersHello fellow sexy traders.
I was tired of constantly having to add my own horizontals/MAs to the default RSI so I decided to make this modification.
The default settings include channels from 40-80 (green horizontals) for a bullish range, and 20-60 (red horizontals) for the bearish range.
Also includes white line at 50 level, and blue horizontals at extremes (90 and 10).
If RSI stays in one of the red or green range that can signify the trend direction, as directed by Andrew Cardwell (inventor of the RSI).
If you wish for other levels to be included, just let me know! Comment on here or dm me on twitter @boss_charts and I can add the settings for you, so all you have to do is click a button and it will set it to your desired config. I want this to be a tool that is useful for heavy traders to save them time.
Additionally, in order to tell the level of the RSI and how overextended it might be, I added the setting for the RSI to change color depending on its level. Current settings are as follows:
Normal RSI (30-70) = PURPLE
Conventional Overbought/Oversold (30-20 + 70-80) = RED
1st extended (20-15 + 80-85) = PINK
2nd extended (15-10 + 85-90) = ORANGE
VERY EXTENDED (<10 + >90) = YELLOW
That way you can get an idea of how drastic a move is by the color alone. According to Dr. Cardwell, a drastic move to over/under extended can be a sign of strength.
Finally, there are the default MAs added that Mr. Cardwell defines as useful for defining the trend. These being the 9 MA and 45 EMA/WMA.
The strategy with these is to have the MAs on both price and RSI. If the 9MA is above the 45 MA on both price and RSI, then this is bullish and you can look for longs.
Conversely, if the 9 is below the 45 on both RSI and price that is bearish, and you can look for shorts.
I added the background color change for the points where the MAs cross each other, so you do not have to have the MAs fogging up your charts to know where they are relative to one another. This is similar to my MA cross indicator which contains the same functionality.
Never financial advice. Backtest it for yourself and find MA configurations that work for you.
Enjoy! Feel free to send feedback/requests whenever.

Lysergik's Stochastic SynergyThis indicator shows the average Stochastic RSI output of the 15m, 1h, 2h, 4h, and Daily Stochastic RSI. It will change in its behavior depending on the time-frame you're using, but for many markets it works best on the 30m time-frame and the daily time-frame.
It is best used along with Lysergik's Fib Cross, which will allow you to avoid false signals in the stochastic synergy indicator. If your MA cross (50, 200) indicates a direction change opposite of the stochastic RSI synergy indicator then that is a signal to wait for more price action to determine your entry/exit points.
Using the Lysergik's Fib Cross, the same applies, but remember that a golden cross (white cross symbol) followed directly by a golden ratio cross (gold cross symbol) is even further indication that the stochastic RSI needs more breathing room before reversing.
This indicator is fully adjustable for you to back-test against charts and refine the indicator to your market.
The inputs in respective order are as follows:
RSI Length, Stoch Length, Smooth K, Smooth D, Upper Limit, Lower Limit, Basis
Enjoy and remember only make trades on your own terms.
Happy trading/investing! :)

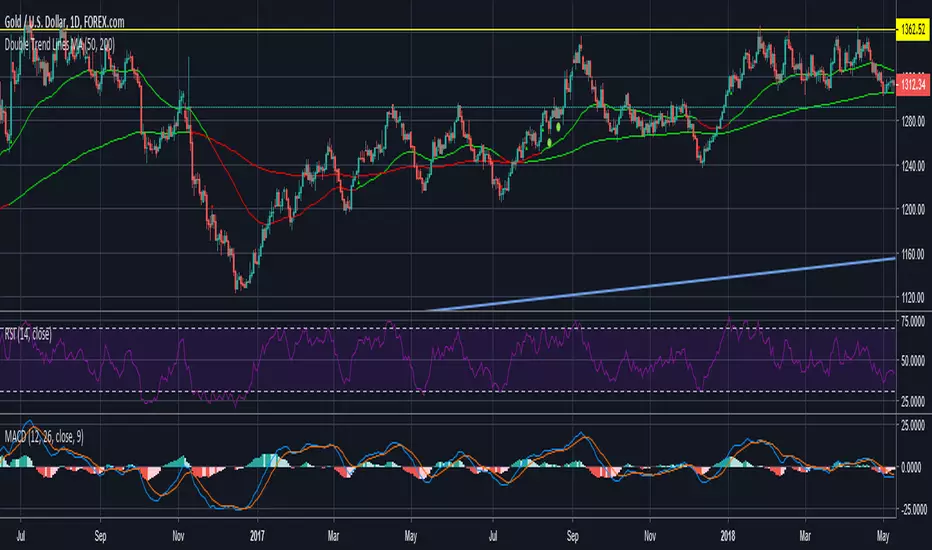
Double Trend Lines MA-ATRTrend indicator using double MA and ATR channel breakout. No repaint and a lot faster than waiting for MA cross.
Fc - 8 x Sma/Ema/Wma/Rma(optional) & cross & close>MaChoose 8 different Ma(optional)
Strategy ;
- MA Cross
- Close > MA
- Increase fast MA

Candlestick normalizer + MA's Crossing SignalingWell, after 25 tries I finally did it ._.
Here is the candlestick normalizer I was trying to achieve. In this way you can do a fast and not biased by price candlestick analysis, for example to catch engulfish and doji's on the go ;)
I also added a MAs crossing-over signal I optimized.
Btw, I will try to add volume signaling on this indicator. I had been thinking in 2 options:
1) Maybe as a colour/unfilled bar when volume exceed average
2) Represent the volume on the width of the candlestick.
What do you prefer? Let me know.
I hope you enjoy it!
Phi it.
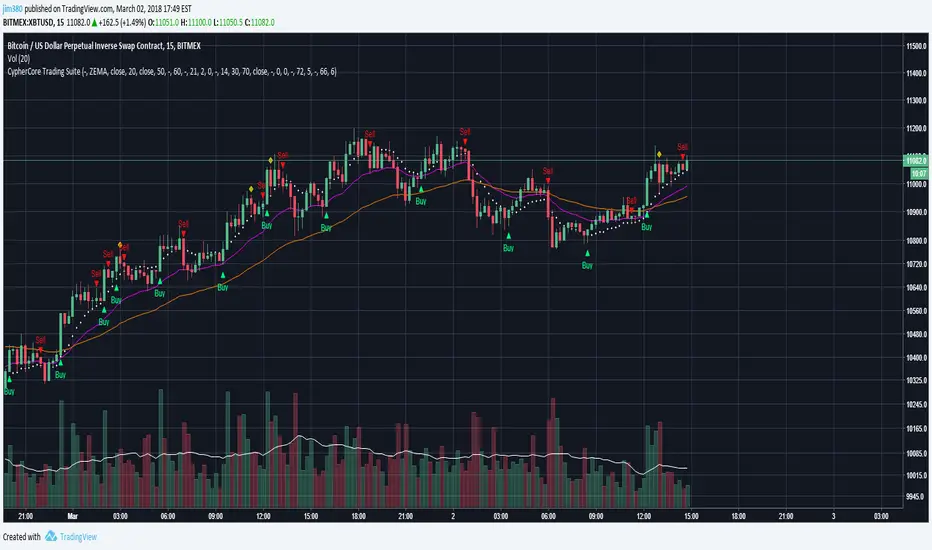
[STUDY] CypherCore Trading Suite
Rerband. Now a STUDY script.
- RSI overlay indicators (diamond shapes)
- Most commonly used MA types( i.e. SMA , EMA , WMA , VWMA , ZEMA )
- Bands
- Price Action Indicator (color coordinated)
color code:
yellow --- inside bars (breakout)
blue --- outside bars (breakout)
green --- up pin bars (reversal)
red --- down pin bars (reversal)
fuchsia --- down shaved bars (selling pressure, selling likely to continue)
aqua --- up shaved bars (buying pressure, buying likely to continue)
- Reversal candlestick patterns (only a few for now)
- Two strategies for determining buy/sell signals
1. buy/sell signals determined by EMAs crossover (better for position or swing trades)
2. buy/sell signals determined by MAs crossover (better for scalping)
03/02/2017
- Switched to STUDY
- Fractals added
- Alerts now fully working
- New "Input" menu
Buy/Sell signals are NOT financial advice.

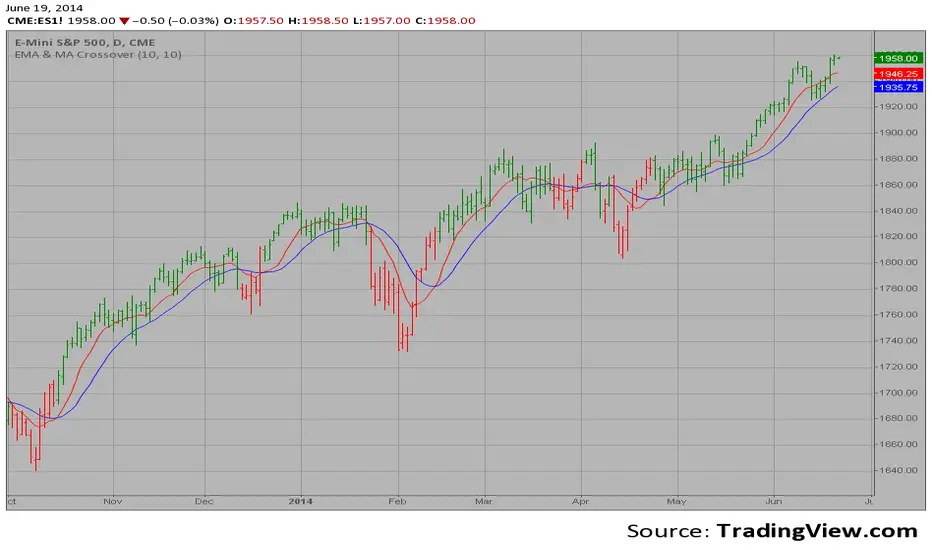
EMA & MA Crossover The Moving Average Crossover trading strategy is possibly the most popular
trading strategy in the world of trading. First of them were written in the
middle of XX century, when commodities trading strategies became popular.
This strategy is a good example of so-called traditional strategies.
Traditional strategies are always long or short. That means they are never
out of the market. The concept of having a strategy that is always long or
short may be scary, particularly in today’s market where you don’t know what
is going to happen as far as risk on any one market. But a lot of traders
believe that the concept is still valid, especially for those of traders who
do their own research or their own discretionary trading.
This version uses crossover of moving average and its exponential moving average.
Session Sweep System – WarRoomXYZ V1WarRoom Session Sweep System v1 is a open-source institutional trading framework built to identify liquidity behavior across Asia, London, and New York sessions.
It combines session-based liquidity mapping, sweep detection, daily expansion modeling, and trend confirmation into a unified, timing-driven system optimized for XAUUSD, FX pairs, indices, and any instrument with session-dependent volatility.
This tool does not attempt to predict direction with arbitrary oscillators.
Instead, it focuses on the underlying market mechanisms that drive price:
liquidity, timing, expansion, and trend alignment.
Below is a detailed explanation of what the script does, how its components work, and how traders can use it effectively.
🔹 1. Session Liquidity Mapping
The script automatically identifies the Asia (00:00–06:00 GMT), London (07:00–12:00 GMT), and New York (13:00–17:00 GMT) sessions and builds real-time session ranges.
Each session creates a liquidity pool.
Trading institutions frequently sweep the high or low of one session before delivering the real move in the next session.
This script captures that behavior by:
►Drawing session range boxes
►Tracking previous session highs/lows
►Highlighting high-probability sweep locations
These ranges are essential reference points for timing entries and exits.
🔹 2. Liquidity Sweep Detection (Buy & Sell Sweeps)
The indicator identifies when price runs a previous session high/low and rejects back inside the range, which is commonly interpreted as a liquidity sweep.
The following sweep types are monitored:
►London sweeping Asia
►New York sweeping London
►Asia sweeping New York
►Daily sweep of PDH/PDL
Sweeps signal that liquidity has been collected and that a potential reversal or continuation is likely.
These are marked clearly on the chart for real-time decision-making.
🔹 3. Killzone Timing Model (GMT Time)
Market manipulation and expansion often occur during specific time windows.
The script highlights these institutional killzones:
►London Killzone: 07:00–10:00 GMT
►New York Killzone: 13:30–15:30 GMT
►NY PM Session: 19:00–21:00 GMT
Sweeps occurring inside these windows carry a significantly higher probability.
The timing layer helps filter out low-quality setups.
🔹 4. Daily Range & ADR Expansion Engine
A dedicated panel displays:
►Current day range
►ADR (Average Daily Range)
►Expansion stage (Early / Developed / Extended)
►PDH/PDL swept or intact
►Overall session bias
This allows traders to understand whether the daily move is likely to continue or reverse.
For example:
►Early expansion → trend continuation likely
►Extended expansion → reversal setups become more probable
This is useful for intraday targets and risk management.
🔹 5. MA Cloud Trend Model (Fast/Slow Structure)
To align liquidity behavior with directional conviction, the script includes a configurable MA engine:
►Fast & slow MA
►MA cloud
►Slope-based trend coloring
►Trend background
►MA cross alerts
The cloud provides trend confirmation without relying on oscillators.
Trades are higher quality when the sweep direction aligns with the MA trend.
🔹 6. How the Components Work Together
The script integrates several institutional concepts into one coherent model:
►Sessions define liquidity pools
►Sweeps identify stop-hunts and reversals
►Killzones define optimal timing
►MA Cloud confirms directional bias
►ADR engine indicates expansion potential
This creates a structured framework:
Sweep → Timing → Trend → Expansion → Execution
Each component strengthens the others, forming a robust decision-making model.
🔹 7. How to Use the Indicator (Practical Guide)
✔ Look for a sweep of a previous session level
When price runs a session high/low and closes back inside, liquidity has likely been collected.
✔ Confirm timing
Sweeps inside London or NY killzones tend to produce the strongest moves.
✔ Confirm trend
Use MA cloud direction and slope:
►Cloud green → long setups preferred
►Cloud red → short setups preferred
✔ Check ADR panel
If the day has already expanded significantly, reversal setups are more likely.
If expansion is still early, continuation setups are favored.
✔ Plan your trade
Common targets include:
►Opposite side of session range
►ADR High/Low
►PDH/PDL
Stops are typically placed beyond the sweep wick.
This creates a repeatable, rule-based approach to intraday liquidity trading.
🔹 8. Why This Script Is Original
This is not a mashup of existing open-source indicators.
It introduces:
►A custom session-linked liquidity sweep engine
►A structured daily expansion model
►Integrated killzone timing aligned with GMT
►A unified bias panel merging sweeps, ADR, and session manipulation
►A trend confirmation layer designed around session behavior
While it uses known institutional concepts, their integration, execution, and timing framework are unique, purpose-built, and not directly found in open-source scripts.
🔹 9. Suitable Markets
This indicator works best on:
►XAUUSD
►Major FX pairs
►US indices
►Synthetic markets with session cycles
Ideal timeframes: 1m, 5m, 15m, 30m
🔹 10. Limitations / Notes
This is an analytical tool, not a buy/sell signal generator
All sweeps are confirmed at candle close (non-repaint)
The tool assumes GMT session windows unless chart time differs
Users must practice risk management and entry triggers manually
Disclaimer
This script is provided for informational and educational purposes only. It does not provide financial, investment, or trading advice, and it does not guarantee profits or future performance. All decisions made based on this script are solely the responsibility of the user.
This script does not execute trades, manage risk, or replace the need for trader discretion. Market behavior can change quickly, and past behavior detected by the script does not ensure similar future outcomes.
Users should test the script on demo or simulation environments before applying it to live markets and must maintain full responsibility for their own risk management, position sizing, and trade execution.
Trading involves risk, and losses can exceed deposits. By using this script, you acknowledge that you understand and accept all associated risks.

Dual MA Crossover with Profit Targets + Stop-LossChatGPT script and is a dual moving average crossover script with profit targets and stop loss

ULTIMATE ORDER FLOW SYSTEM🔥 ULTIMATE ORDER FLOW SYSTEM
Overview
This comprehensive order flow analysis tool combines **Volume Profile**, **Cumulative Delta**, and **Large Order Detection** to identify high-probability trading setups. The script analyzes institutional order flow patterns and volume distribution to pinpoint key levels where price is likely to react.
📊 Core Components & Methodology
🔥 ULTIMATE ORDER FLOW SYSTEM
Overview
This comprehensive order flow analysis tool combines Volume Profile, Cumulative Delta, and Large Order Detection to identify high-probability trading setups. The script analyzes institutional order flow patterns and volume distribution to pinpoint key levels where price is likely to react.
________________________________________
📊 Core Components & Methodology
1. Volume Profile Analysis
The script constructs a horizontal volume profile by:
• Dividing the price range into configurable rows (default: 20)
• Accumulating volume at each price level over a lookback period (default: 50 bars)
• Separating buy volume (green bars close > open) from sell volume (red bars)
• Identifying three critical levels:
o POC (Point of Control): Price level with highest traded volume - acts as a strong magnet
o VAH/VAL (Value Area High/Low): Contains 70% of total volume - defines fair value zone
o HVN (High Volume Nodes): Resistance zones where institutions accumulated positions
o LVN (Low Volume Nodes): Thin zones that price moves through quickly - ideal targets
Why This Matters: Institutional traders leave footprints through volume. HVN zones show where large players defended levels, making them reliable support/resistance.
________________________________________
2. Cumulative Delta (Order Flow)
Tracks the running total of buying vs selling pressure:
• Bar Delta: Difference between buy and sell volume per candle
• Cumulative Delta: Sum of all bar deltas - shows net directional pressure
• Delta Moving Average: Smoothed delta (20-period) to identify trend
• Delta Divergences:
o Bullish: Price makes lower low, but delta makes higher low (absorption at bottom)
o Bearish: Price makes higher high, but delta makes lower high (exhaustion at top)
How It Works: When cumulative delta trends up while price consolidates, it signals accumulation. Delta divergences reveal when smart money is positioned opposite to retail expectations.
________________________________________
3. Large Order Detection
Identifies institutional-sized orders in real-time:
• Compares current bar volume to 20-period moving average
• Flags orders exceeding 2.5x average volume (configurable multiplier)
• Distinguishes bullish (green circles below) vs bearish (red circles above) large orders
Rationale: Sudden volume spikes at key levels indicate institutional participation - the "fuel" needed for breakouts or reversals.
________________________________________
🎯 Trading Signal Logic
Combined Setup Criteria
The script generates SHORT and LONG signals when multiple conditions align:
SHORT Signal Requirements:
1. Price reaches an HVN resistance zone (within 0.2%)
2. Large sell order detected (volume spike + red candle)
3. Cumulative delta is bearish OR bearish divergence present
4. 10-bar cooldown between signals (prevents overtrading)
LONG Signal Requirements:
1. Price reaches an HVN support zone
2. Large buy order detected (volume spike + green candle)
3. Cumulative delta is bullish OR bullish divergence present
4. 10-bar cooldown enforced
________________________________________
🔧 Customization Options
Setting - Purpose - Recommendation
Volume Profile Rows - Granularity of level detection - 20 (balanced)
Lookback Period - Historical data analyzed - 50 bars (intraday), 200 (swing)
Large Order Multiplier - Sensitivity to volume spikes - 2.5x (standard), 3.5x (conservative)
HVN Threshold - Resistance zone detection - 1.3 (default)
LVN Threshold - Target zone identification - 0.6 (default)
Divergence Lookback - Pivot detection period - 5 bars (responsive)
________________________________________
📈 Dashboard Indicators
The real-time panel displays:
• POC: Current Point of Control price
• Location: Whether price is at HVN resistance
• Orders: Current large buy/sell activity
• Cumulative Δ: Net order flow value + trend direction
• Divergence: Active bullish/bearish divergences
• Bar Strength: % of candle volume that's directional (>65% = strong)
• SETUP: Current trade signal (LONG/SHORT/WAIT)
________________________________________
🎨 Visual System
• Yellow POC Line: Highest volume level - primary pivot
• Blue Value Area Box: Fair value zone (VAH to VAL)
• Red HVN Zones: Resistance/support from institutional accumulation
• Green LVN Zones: Low-liquidity targets for quick moves
• Volume Bars: Green (buy pressure) vs Red (sell pressure) distribution
• Triangles: LONG (green up) and SHORT (red down) entry signals
• Diamonds: Divergence warnings (cyan=bullish, fuchsia=bearish)
________________________________________
💡 How This Script Is Unique
Unlike standalone volume profile or delta indicators, this script:
1. Synthesizes three complementary methods - volume structure, order flow momentum, and liquidity detection
2. Requires multi-factor confirmation - signals only trigger when price, volume, and delta align at key zones
3. Adapts to market regime - delta filters ensure you're trading with the dominant order flow direction
4. Provides context, not just signals - the dashboard helps you understand why a setup is forming
________________________________________
⚙️ Best Practices
Timeframes:
• 5-15 min: Scalping (use 30-50 bar lookback)
• 1-4 hour: Swing trading (use 100-200 bar lookback)
Risk Management:
• Enter on signal candle close
• Stop loss: Beyond nearest HVN/LVN zone
• Target 1: Next LVN level
• Target 2: Opposite value area boundary
Filters:
• Avoid signals during major news events
• Require bar delta strength >65% for aggressive entries
• Wait for delta MA cross confirmation in ranging markets
________________________________________
🚨 Alerts Available
• Long Setup Trigger
• Short Setup Trigger
• Bullish/Bearish Divergence Detection
• Large Buy/Sell Order Execution
________________________________________
📚 Educational Context
This methodology is based on principles used by professional order flow traders:
• Market Profile Theory: Volume distribution reveals fair value
• Tape Reading: Large orders show institutional intent
• Auction Theory: Price seeks areas of liquidity imbalance (LVN zones)
The script automates pattern recognition that discretionary traders spend years learning to identify manually.
________________________________________
⚠️ Disclaimer
This indicator is a trading tool, not a trading system. It identifies high-probability setups based on order flow analysis but requires proper risk management, market context, and trader discretion. Past performance does not guarantee future results.
________________________________________
Version: 6 (Pine Script)
Type: Overlay + Separate Pane (Delta Panel)
Resource Usage: Moderate (500 bars history, 500 lines/boxes)
________________________________________
For questions or support, please comment below. If you find this script valuable, please boost and favorite! 🚀
1. Volume Profile Analysis
The script constructs a horizontal volume profile by:
- Dividing the price range into configurable rows (default: 20)
- Accumulating volume at each price level over a lookback period (default: 50 bars)
- Separating buy volume (green bars close > open) from sell volume (red bars)
- Identifying three critical levels:
- POC (Point of Control): Price level with highest traded volume - acts as a strong magnet
- VAH/VAL (Value Area High/Low): Contains 70% of total volume - defines fair value zone
- HVN (High Volume Nodes): Resistance zones where institutions accumulated positions
- LVN (Low Volume Nodes): Thin zones that price moves through quickly - ideal targets
Why This Matters: Institutional traders leave footprints through volume. HVN zones show where large players defended levels, making them reliable support/resistance.
---
2. Cumulative Delta (Order Flow)
Tracks the running total of buying vs selling pressure:
- **Bar Delta**: Difference between buy and sell volume per candle
- **Cumulative Delta**: Sum of all bar deltas - shows net directional pressure
- **Delta Moving Average**: Smoothed delta (20-period) to identify trend
- **Delta Divergences**:
- **Bullish**: Price makes lower low, but delta makes higher low (absorption at bottom)
- **Bearish**: Price makes higher high, but delta makes lower high (exhaustion at top)
**How It Works**: When cumulative delta trends up while price consolidates, it signals accumulation. Delta divergences reveal when smart money is positioned opposite to retail expectations.
---
### 3. **Large Order Detection**
Identifies **institutional-sized orders** in real-time:
- Compares current bar volume to 20-period moving average
- Flags orders exceeding 2.5x average volume (configurable multiplier)
- Distinguishes bullish (green circles below) vs bearish (red circles above) large orders
**Rationale**: Sudden volume spikes at key levels indicate institutional participation - the "fuel" needed for breakouts or reversals.
---
## 🎯 Trading Signal Logic
### Combined Setup Criteria
The script generates **SHORT** and **LONG** signals when multiple conditions align:
**SHORT Signal Requirements:**
1. Price reaches an HVN resistance zone (within 0.2%)
2. Large sell order detected (volume spike + red candle)
3. Cumulative delta is bearish OR bearish divergence present
4. 10-bar cooldown between signals (prevents overtrading)
**LONG Signal Requirements:**
1. Price reaches an HVN support zone
2. Large buy order detected (volume spike + green candle)
3. Cumulative delta is bullish OR bullish divergence present
4. 10-bar cooldown enforced
---
## 🔧 Customization Options
| Setting | Purpose | Recommendation |
|---------|---------|----------------|
| **Volume Profile Rows** | Granularity of level detection | 20 (balanced) |
| **Lookback Period** | Historical data analyzed | 50 bars (intraday), 200 (swing) |
| **Large Order Multiplier** | Sensitivity to volume spikes | 2.5x (standard), 3.5x (conservative) |
| **HVN Threshold** | Resistance zone detection | 1.3 (default) |
| **LVN Threshold** | Target zone identification | 0.6 (default) |
| **Divergence Lookback** | Pivot detection period | 5 bars (responsive) |
---
## 📈 Dashboard Indicators
The real-time panel displays:
- **POC**: Current Point of Control price
- **Location**: Whether price is at HVN resistance
- **Orders**: Current large buy/sell activity
- **Cumulative Δ**: Net order flow value + trend direction
- **Divergence**: Active bullish/bearish divergences
- **Bar Strength**: % of candle volume that's directional (>65% = strong)
- **SETUP**: Current trade signal (LONG/SHORT/WAIT)
---
## 🎨 Visual System
- **Yellow POC Line**: Highest volume level - primary pivot
- **Blue Value Area Box**: Fair value zone (VAH to VAL)
- **Red HVN Zones**: Resistance/support from institutional accumulation
- **Green LVN Zones**: Low-liquidity targets for quick moves
- **Volume Bars**: Green (buy pressure) vs Red (sell pressure) distribution
- **Triangles**: LONG (green up) and SHORT (red down) entry signals
- **Diamonds**: Divergence warnings (cyan=bullish, fuchsia=bearish)
---
## 💡 How This Script Is Unique
Unlike standalone volume profile or delta indicators, this script:
1. **Synthesizes three complementary methods** - volume structure, order flow momentum, and liquidity detection
2. **Requires multi-factor confirmation** - signals only trigger when price, volume, and delta align at key zones
3. **Adapts to market regime** - delta filters ensure you're trading with the dominant order flow direction
4. **Provides context, not just signals** - the dashboard helps you understand *why* a setup is forming
---
## ⚙️ Best Practices
**Timeframes:**
- 5-15 min: Scalping (use 30-50 bar lookback)
- 1-4 hour: Swing trading (use 100-200 bar lookback)
**Risk Management:**
- Enter on signal candle close
- Stop loss: Beyond nearest HVN/LVN zone
- Target 1: Next LVN level
- Target 2: Opposite value area boundary
**Filters:**
- Avoid signals during major news events
- Require bar delta strength >65% for aggressive entries
- Wait for delta MA cross confirmation in ranging markets
---
## 🚨 Alerts Available
- Long Setup Trigger
- Short Setup Trigger
- Bullish/Bearish Divergence Detection
- Large Buy/Sell Order Execution
---
## 📚 Educational Context
This methodology is based on principles used by professional order flow traders:
- **Market Profile Theory**: Volume distribution reveals fair value
- **Tape Reading**: Large orders show institutional intent
- **Auction Theory**: Price seeks areas of liquidity imbalance (LVN zones)
The script automates pattern recognition that discretionary traders spend years learning to identify manually.
---
## ⚠️ Disclaimer
This indicator is a **trading tool, not a trading system**. It identifies high-probability setups based on order flow analysis but requires proper risk management, market context, and trader discretion. Past performance does not guarantee future results.
---
**Version**: 6 (Pine Script)
**Type**: Overlay + Separate Pane (Delta Panel)
**Resource Usage**: Moderate (500 bars history, 500 lines/boxes)
---
*For questions or support, please comment below. If you find this script valuable, please boost and favorite!* 🚀

MAHI Indicator v9.5 - Smart Momentum HUD + IntradayMAHI Indicator v9.5 — Smart Momentum HUD (Multi-Framework + Intraday Engine)
A Complete Momentum, Trend, and Setup Framework for Swing, Position & Intraday Traders
MAHI v9.5 is the most advanced version yet — a highly optimized, visual, multi-framework trading system that blends momentum, trend alignment, adaptive setup detection, and now Auto-Intraday Mode for short-term traders.
This indicator acts like a Heads-Up Display (HUD) on your chart: it shows trend strength, squeeze zones, dynamic support/resistance, EMAs, setup validation, and early reversal signals in one clean interface — without clutter.
✔ Core Features
📌 1. Smart Momentum Ribbon
A dynamic EMA-based momentum band that visually shifts as trend strength changes.
Helps identify strong vs. weak momentum zones
Adapts to volatility & trend slope
Works on all timeframes (1m to 1M)
📌 2. EMA 9 → 21 Flip System
A precision trend-switching signal:
EMA 9 → 21 BULL = early bullish momentum
EMA 9 → 21 BEAR = early bearish momentum
More reliable than stand-alone MA crossovers
📌 3. Bullish Setup Engine (Standard + Weak)
Automatically identifies when price is entering a reversal-ready state based on:
Position relative to the ribbon
Candle structure
Momentum compression
Slope + exhaustion conditions
Includes:
Bull Setup (Standard) — Higher probability setup
Bull Setup (Weak) — Early or less developed setup
Setup Invalidated — Confirms that the pattern failed
This prevents false confidence & keeps traders disciplined.
📌 4. Strong Buy / Strong Sell Signals
Only appear when multiple confirmations align:
Ribbon bias
EMA slope
Momentum compression
Trend alignment
Filtered to remove noise — especially in lower timeframes.
📌 5. Multi-Timeframe Trend HUD
Top-right panel summarizing:
Overall Trend (Bullish, Bearish, Neutral)
RSI Condition
Daily vs Weekly Alignment
Trading Mode Suggestions (Buy / Sell / LEAPS / Neutral)
This gives instant context.
📌 6. Auto Intraday Engine (NEW in v9.5)
Automatically switches internal logic when you move into intraday timeframes (1m–30m):
Intraday Enhancements:
Adaptive setup detection
Faster momentum sensitivity
EMAs tuned for scalp/swing precision
Tighter invalidation logic
Reduced false positives
Optional strict filtering
Perfect for scalping, day trading & micro-trends
Works instantly — no settings needed.
Just change the chart timeframe and MAHI adjusts.
📌 7. Dynamic High-Timeframe Support (W & M)
Auto-layers weekly & monthly levels:
Helps identify strong bounce zones
Extremely useful for swing & LEAPS traders
📌 8. Weekly Volume Shelf Projection
Lightweight VWAP-style level based on weekly volume aggregation.
Shows probable bottoming areas during pullbacks.
✔ Who This Indicator Is For
Perfect for:
Day traders
Swing traders
Momentum riders
LEAPS & long-term investors
Beginner traders needing a structured system
MAHI adapts to your timeframe and trading style.
✔ Why MAHI Works
MAHI isn’t a single-signal indicator — it’s a framework.
It combines:
Trend
Momentum
Volatility
Setup pattern detection
Validation & invalidation
Multi-timeframe alignment
Dynamic zones
Intraday optimization
This eliminates guesswork and helps traders avoid the emotional traps that cause most losses.
You don’t just get a signal — you get context.
✔ How to Use It
Follow the ribbon bias
Use EMA 9→21 flips as trend confirmation
Look for Bull Setup tags during pullbacks
Avoid trades when you see Setup Invalidated
Respect weekly/monthly HTF support levels
On intraday charts — rely on auto-optimized mode
For swing entries, combine setups with HTF trend HUD
MAHI gives the map. You choose the path.
✔ Final Notes
This version is heavily optimized for performance, clarity, and high-probability signals.
MAHI does not repaint, and works on all assets including:
Stocks
Crypto
ETFs
Forex
Futures

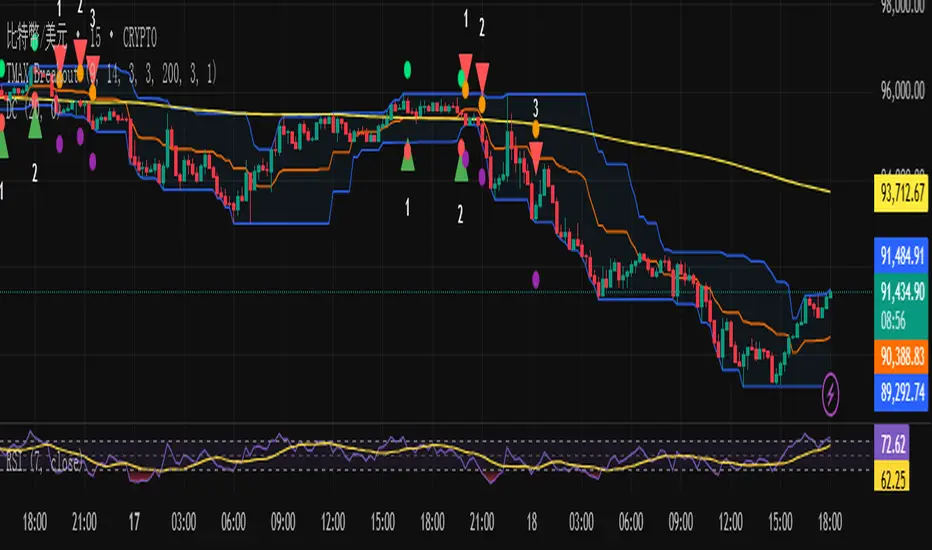
TMAX Breakout – by EricFreemanTMAX Breakout is a trend-following breakout indicator inspired by the classic Turtle Trading System, designed by EricFreeman.
It identifies Donchian Channel breakouts with an MA trend filter to help traders capture strong directional moves while reducing false breakout signals.
Ideal for:
Trend-following traders
Visual breakout confirmation
Manual trading or automated strategy development
More indicators in the TMAX series—RSI Divergence, Bollinger strategies, MA Cross, and more—will be released soon to form a complete professional trading toolkit.
TMAX Breakout 是一款基於海龜交易法(Turtle System)延伸打造的趨勢突破指標,由 EricFreeman 設計。
透過 Donchian Channel 突破判斷結合 MA 趨勢過濾,幫助交易者在關鍵價格突破時進場,並避免弱勢走勢造成假突破。
此指標適合:
喜歡順勢交易的人
想要視覺化突破訊號的交易者
搭配 EA、自動化策略、或手動交易判斷
TMAX 系列將陸續推出更多指標:RSI 背離、布林通道策略、均線交叉等,打造完整專業交易套件。