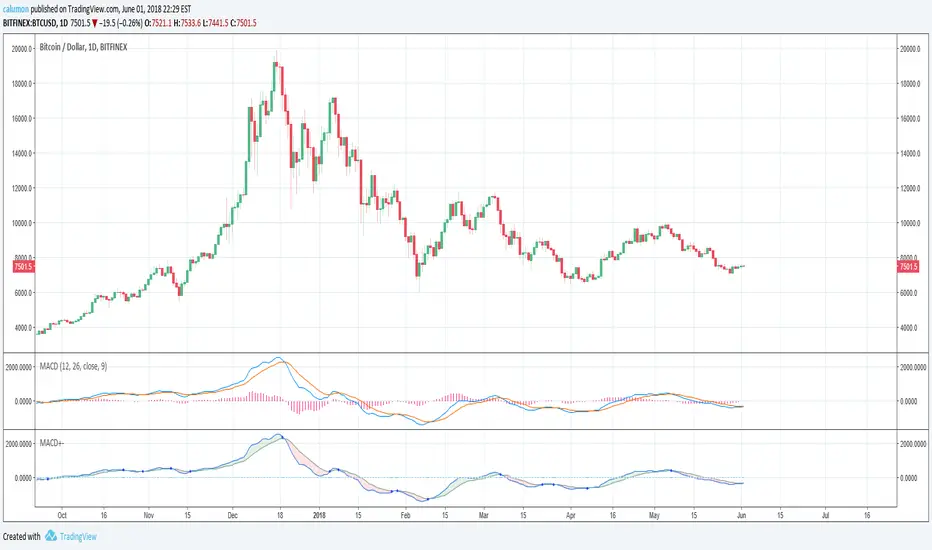
macd strategyOkay
User Avatar
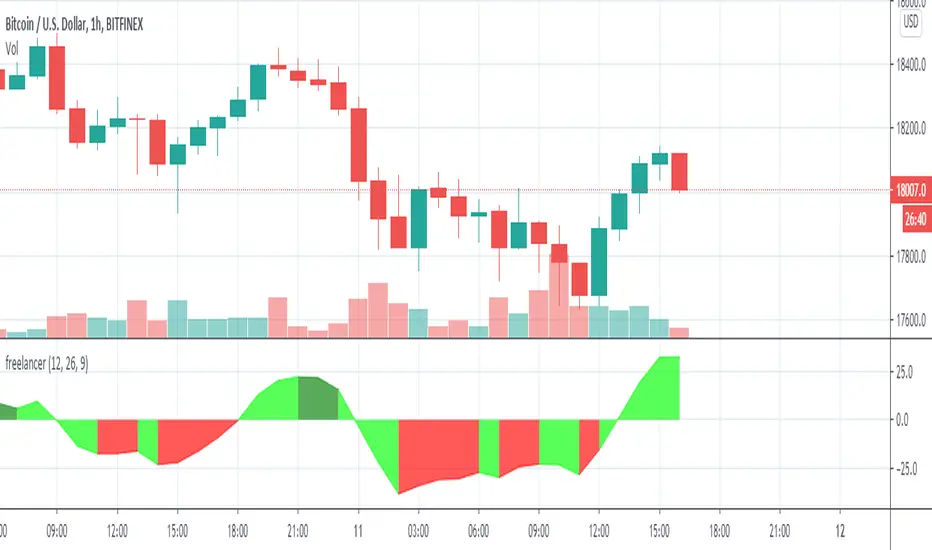
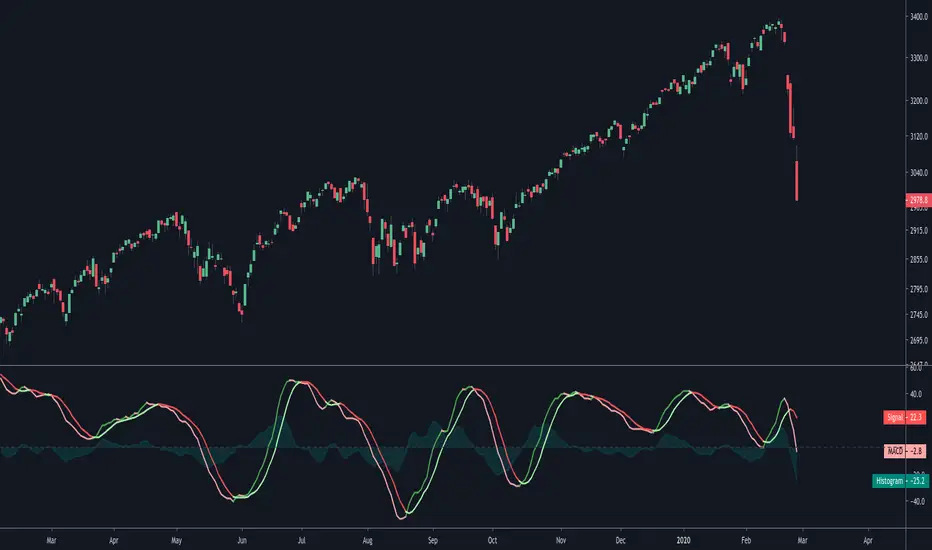
Rules using ( MACD 12 26 Close 9 ):
Place a SELL signal when :
1. Histogram bar turned RED from GREEN
2. Within the previous group of green histogram bars the maximum value reached/passed +5.5
3. MACD fast & slow have values > 0
Place a BUY signal when :
1. Histogram bar turned GREEN from RED
2. Within the previous group of RED histogram bars has maximum value reached/passed -5.0
3. MACD fast & slow have values < 0
在腳本中搜尋"macd"
MACD Indicator [SystemAlpha]This is a MACD indicator enhanced with:
- Show MACD and Signal Only or Histogram Only or Both
- Show Buy and Sell Alert - MACD Cross
- Show Bar Color
- Show Regular and Hidden divergence
- Show Divergence Labels
- Generate Alerts: Buy/Sell and Divergence

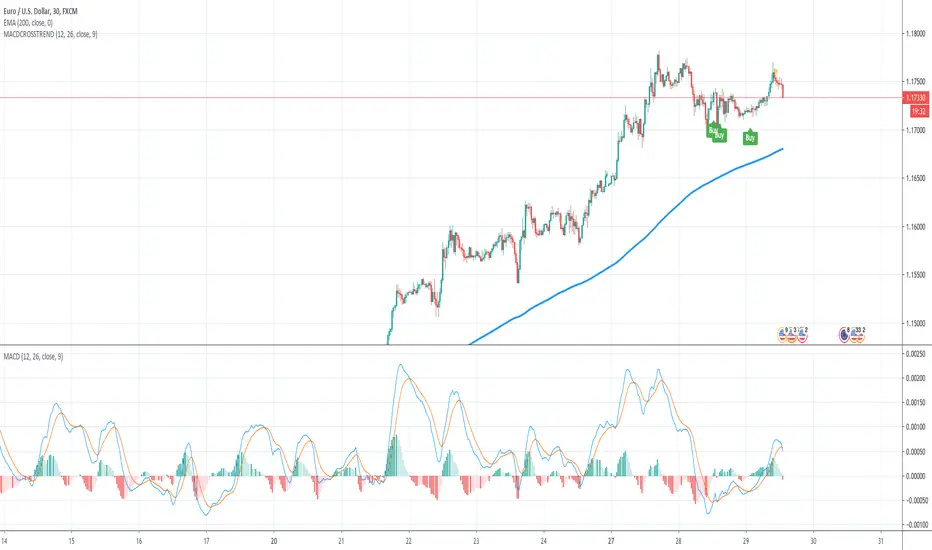
MACD Crossover Trend IndicatorHow this indicator works:
This indicator detects MACD Crossovers based on the current trend. It checks wether the current close price is above or below the 200 EMA and therefore decides whether we are in an up- or down trend.
UP-TREND: If the MACD is below 0 and crosses up the signal line, then this is a BUY signal!
DOWN-TREND: If the MACD is above 0 and crosses down the signal line, then this is a SELL signal!
How to trade this:
First rule: Be consistent!
Second rule: You will have lost trades and losing streaks - deal with it!
First set the SL slightly below the last significant low (eventually add/subtract the ATR value to/from it)
Then adjust the TP and ALWAYS use a RR ratio of 1.5.
NEVER get out of the trade earlier
Take every possible trade!
Important: Money management is key... so be consistent!
Have fun! :)
MACD with divergence signalsIts an MACD indicator which highlights places where macd and signal line cross and hidden divergence ocures.
Logic behind it is to check if we have hidden divergence when crossing of that two lines and if above EMA200 (signal for BUY - green) or if below EMA200 (signal for SELL - red).
You can change lenght of EMA but i think 200 is a simpliest trend indicator.
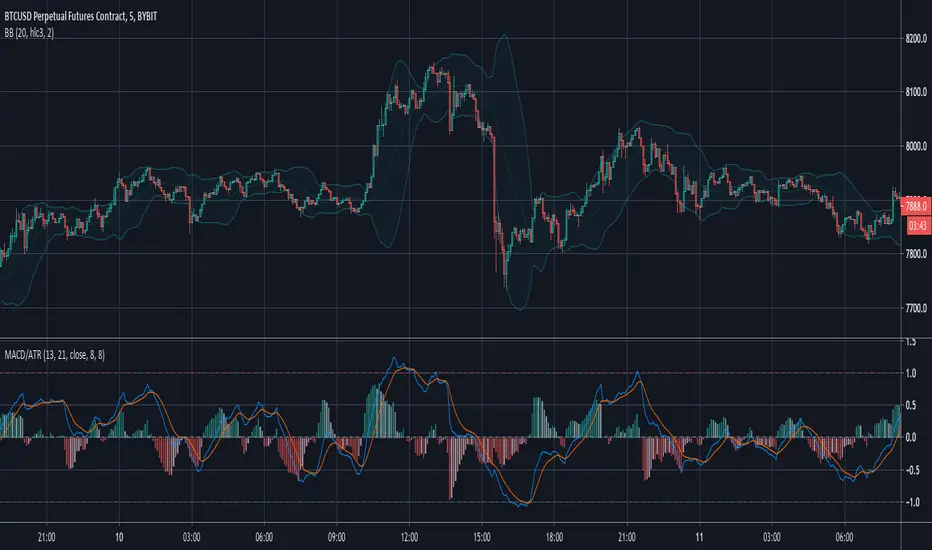
MACD/ATRThis indicator is a restricted MACD .
I reached this with a little trick: I devided it by ATR . This way it is most of the time inside the -1..1 range. It depends on the length of the ATR's period. If it is greater, the probability of outliers is greater.
With this indicator you can use cerain levels of MACD and its histogram as a trigger.
Share with me if you found it useful.
Quadratic Weighted (QWMA) MACDMACD but on the Quadratic Weighted Moving Average instead of regular Moving Average
"The quadratic moving average ( QMA ) or quadratic weighted moving average (QWMA) is a type of moving average who is closer to the price when price is up trending. This moving average is defined as the square root of the moving average of the squared price." @alexgrover ()
Base MACD code from @RicardoSantos ()
MACD [Gu5]Extremely popular indicator MACD (Moving Average Convergence/Divergence)
Same design of my previous indicators
Show Cross Line for a better visualization
```
Setting recommended for BTC
"Fast Length" = 21
"Slow Length" = 55
"Signal Smoothing" = 14
Other markets try
"Fast Length" = 12
"Slow Length" = 26
"Signal Smoothing" = 9
```
--
El MACD (Convergencia/Divergencia de Medias Móviles) es uno de los mas populares indicadores
Continuando con el mismo estilo de diseño de mis anteriores indicadores
Destaca el cruce de medias para una mejor visualización
MACD Enhanced System MTF with optional TSL and Alerts [LTB]This script is developed to analyse MACD, MACD Signal, MACD Histogram movements by using current and higher time frame. Script calculates higher time frame automatically, no manuel entry. there is trailing stop loss line that is optional.
You can change the parameters as you wish.
btw. you should know that MACD is more successful when there is a trend.
I already shared this as a strategy script. Some ppl wanted to see the code.
You might want to see strategy test =>
by LonesomeTheBlue

MACD+CCI Strategya simple strategy based on Joseph Nemeth MACD+CCI strategy
Reference reading: sites.google.com
MACD + Colors + Signals
Standard MACD with signal and histogram
MACD and signal crossovers are marked with up/down triangles
Signal is colored based on its direction, can be turned to a single color
Histograms can be green, red and yellow based on their side and direction
Histograms can be switch to be green when positive and red when negative
MACD with highlighted positive and negative trendThe values used by this indicator are equal to MACD 12 26 9 (and Signal). Only changes are made to looks:
If MACD closes higher than Signal, then we are seeing green. Else, we are seeing red.
Another point is that we get a blue circle when there is a trend change from bullish to bearish or vice versa. Please note that there needs to be an offset for this. We will only see the circle, when there already WAS (instead of is) a trend change.
Volume Weighted MACD (VWMA, 4 Color, Color-blind Friendly)MACD built out of two Volume Weighted Moving Average (VWMA) lines of different periods. The signal line is still an EMA of the MACD line, just like with the normal MACD .
Colors are picked to be friendly with partial colorblindness, and can be modified in the indicator settings.

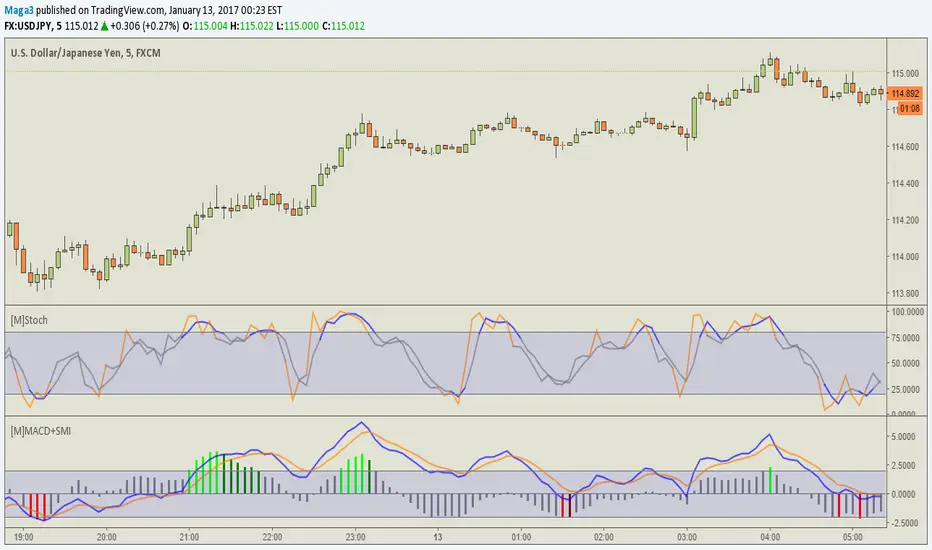
[M] MACD + SMI
MACD + SMI -2.23% Ergodic
When leaving the zone, MACD is painted in different colors, while in the area - is gray.
In the settings you can disable shading in gray or SMI -2.23% .
Works on the major currency pairs, the rest has not been tested. Because it did for me)
//Google translate
----------------------
МАКД+SMI Ergodic
При выходе из зоны, MACD окрашивается в разные цвета, при нахождении в зоне - остается серым.
В настройках есть возможность отключить закрашивание в серый или SMI -2.23% .
Работает на основных валютных парах, на остальных не тестировался, потому что делал для себя)
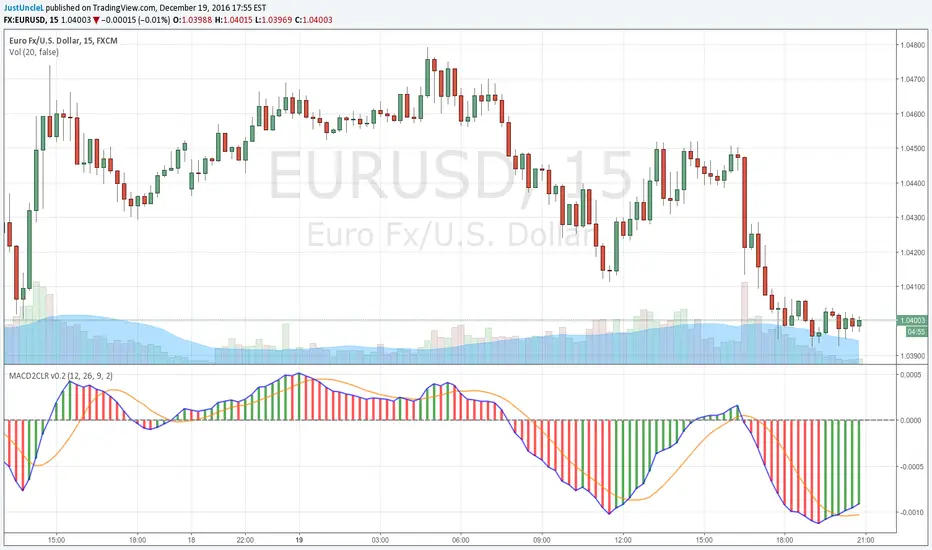
MACD DEUTER 2 colour v0.2 by JustUncleLThis is an updated version of the MACD DEUTER 2 colour indicator. This version includes the Signal line and option to change the length calculating the MACD direction change.
MACD + Stochastic, Double Strategy (by ChartArt)This strategy combines the classic stochastic strategy to buy when the stochastic is oversold with a classic MACD strategy to buy when the MACD histogram value goes above the zero line. Only difference to the classic stochastic is a default setting of 71 for overbought (classic setting 80) and 29 for oversold (classic setting 20).
Therefore this strategy goes long if the MACD histogram goes above zero and the stochastic indicator detects a oversold condition (value below 29). If the inverse logic is true, the strategy goes short (stochastic overbought condition with a value above 71 and the MACD histogram falling below the zero line value).
Please be aware that this pure double strategy using simply two classic indicators does not have any stop loss or take profit money management logic.
All trading involves high risk; past performance is not necessarily indicative of future results. Hypothetical or simulated performance results have certain inherent limitations. Unlike an actual performance record, simulated results do not represent actual trading. Also, since the trades have not actually been executed, the results may have under- or over-compensated for the impact, if any, of certain market factors, such as lack of liquidity. Simulated trading programs in general are also subject to the fact that they are designed with the benefit of hindsight. No representation is being made that any account will or is likely to achieve profits or losses similar to those shown.

MACD trend heatmap (by ChartArt)This is an overlay indicator which uses the classic period settings and signals from the MACD (Moving Average Convergence/Divergence) indicator to overlay a heatmap using all the information the MACD generates with its three periods (12,26,9).
The first two moving averages which the MACD uses (12 and 26) can be plotted on the chart like usual EMAs.
In addition to the background color function (the heatmap) and the EMAs, there is an optional bar color alert when the uptrend or the downtrend as measured by the MACD appears to be very strong.

MACD (classic) + Divergences (wicks & bodies, fast/slow)macd with divergences. Wicks + bodies. Two settings for right bar


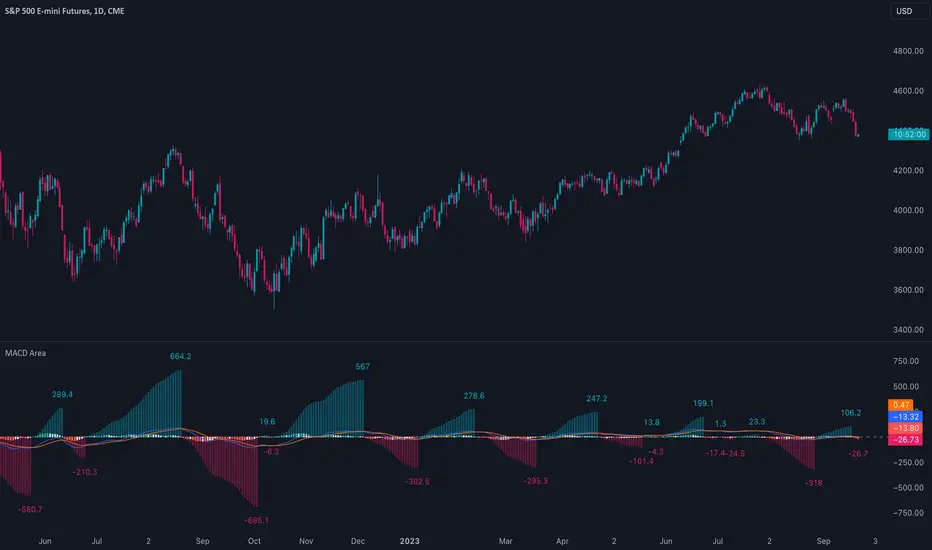
MACD AreaThis indicator calculates and displays the cumulative area for each region above and below the zero line in the MACD histogram. This area measurement serves as a momentum metric, where larger cumulative areas indicate stronger momentum. Divergences between the area and price can also potentially indicate an impending reversal. For example, when the stock price makes a higher high but the area makes a lower high, the current momentum may be unsustainable.
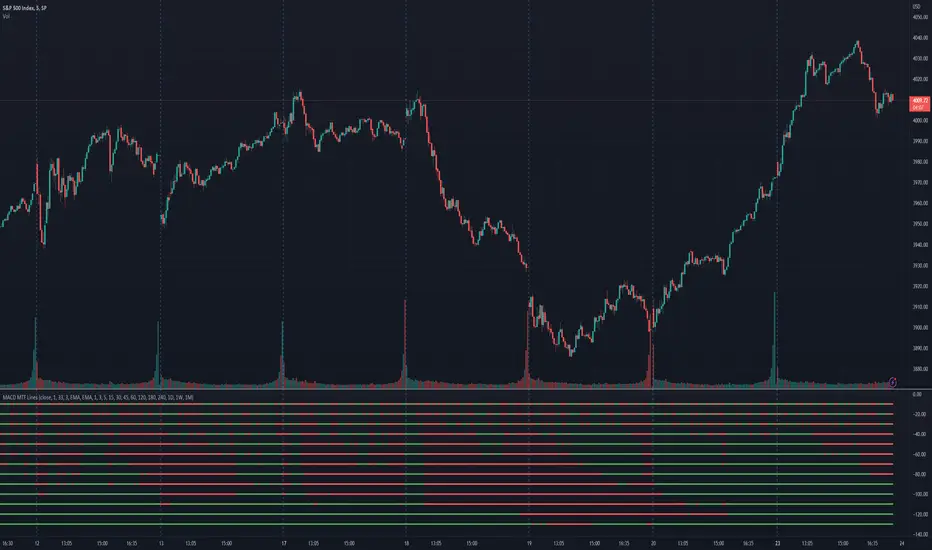
MACD MTF LinesThe indicator shows the MACD histogram sign (positive or negative) for several timeframes at once. You can see at a glance how the price is trending across higher and lower timeframes.
The code uses recursive calculations for the SMA and EMA to avoid lookahead errors and repainting on higher timeframes.
Note that, for lower timeframes, the line becomes yellow to the left because history is limited and there are not enough bars to calculate.
MACD DivergencesUpdate of MACD indicator which shows the most recent, and developing, price action divergences with the histogram.

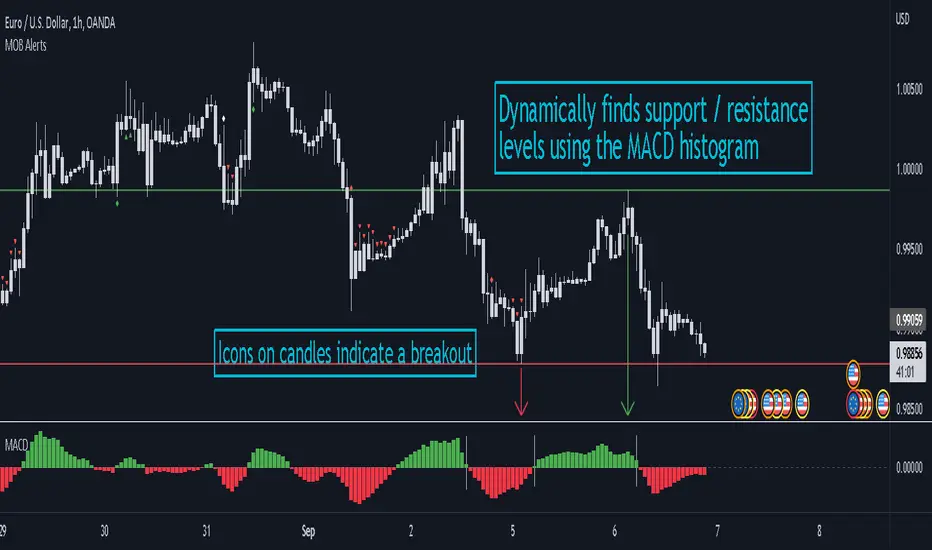
MACD Objective Breakouts + AlertsFinds the most recent support and resistance level as confirmed by the MACD . These level are detected dynamically and the lines will be updated as new levels form.
Alerts can be toggled on or off in the settings but will not work if the alert is not added to your chart. Alerts can be added by selecting the "Alert" button on TradingView then selecting "MOB Alerts" as the condition
Alerts will trigger when price closes above or below the indicated levels.
Please let me know if you find any bugs!
MACD oscillator with EMA strategy 4H This is a simple, yet efficient strategy, which is made from a combination of an oscillator and a moving average.
Its setup for 4h candles with the current settings, however it can be adapted to other different timeframes.
It works nicely ,beating the buy and hold for both BTC and ETH over the last 3 years.
As well with some optimizations and modifications it can be adapted to futures market, indexes(NASDAQ,NIFTY etc), forex(GBPUSD), stocks and so on.
Components:
MACD
EMA
Time condition
Long/short option
For long/exit short we enter when we are above the ema, histogram is positive and current candle is higher than previous.
For short /exit long , when close below ema, histo negative and current candles smaller than previous
If you have any questions please let me know !
