Momentum Trend IndexMomentum Trend Index (MTI), is a Trend Filtering system that utilizes momentum via RSI in a special unique way which not many people have done to date within Tradingviews platform and even outside it.
Reduce the noise of the trend to focus on the direction, it holds true through consolidations and volatility spikes.
Use your favourite RSI or Moving Average settings (4,9,13,21,31,50,100,200,etc)
Included in the indicator is an option to plot the Over Sold and Over Bought levels directly to your chart!
在腳本中搜尋"momentum"

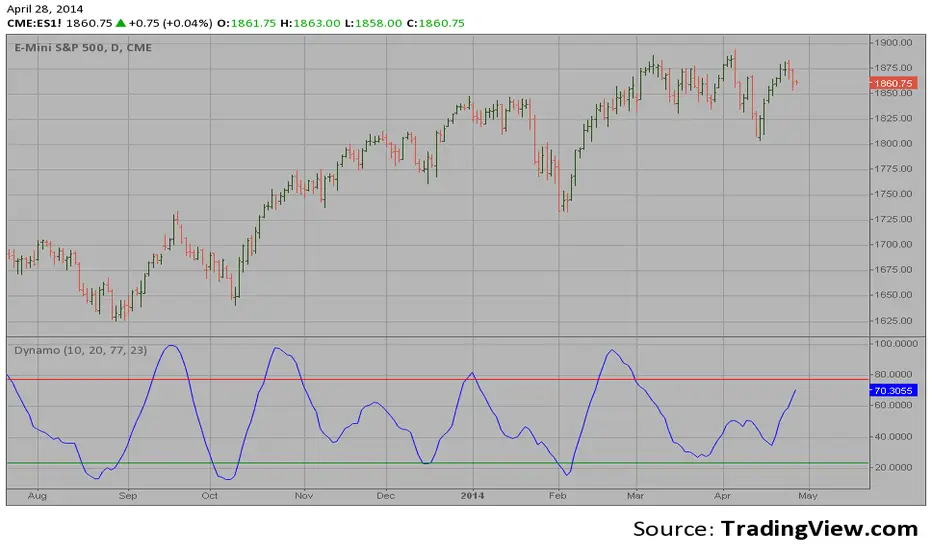
Dynamic Momentum Oscillator (DYNAMO) by M.YALCINIn July 1996 Futures magazine, E. Marshall Wall introduces the Dynamic Momentum Oscillator (Dynamo). Please refer to this article for interpretation.
The Dynamo oscillator is a normalizing function that adjusts the values of a standard oscillator for trendiness by taking the difference between the value of the oscillator and a moving average of the oscillator and then subtracting that value from the oscillator midpoint.
Dynamo Oscillator is calculated according to:
Dynamo = Mc - ( MAo - O )
where:
Mc = the midpoint of the oscillator
MAo = a moving average of the oscillator
O = the oscillator
Usage:
This concept can be applied to most oscillators to improve their results.
This example applies it to an RSI oscillator in MetaStock:
50-(Mov(RSI(14),21,S)-RSI(14))
where:
Mc = RSI's midpoint = 50
MAo = Moving average of the RSI = Mov(RSI(14),21,S
O= RSI Oscillator = RSI(14)
Also with this indicator, you can adjust the moving average type and RSI calculation types dynamically.

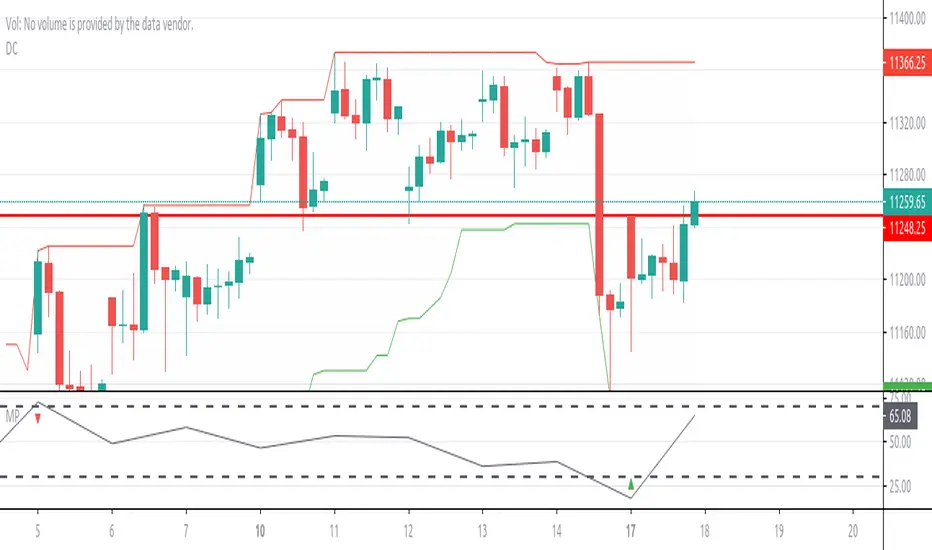
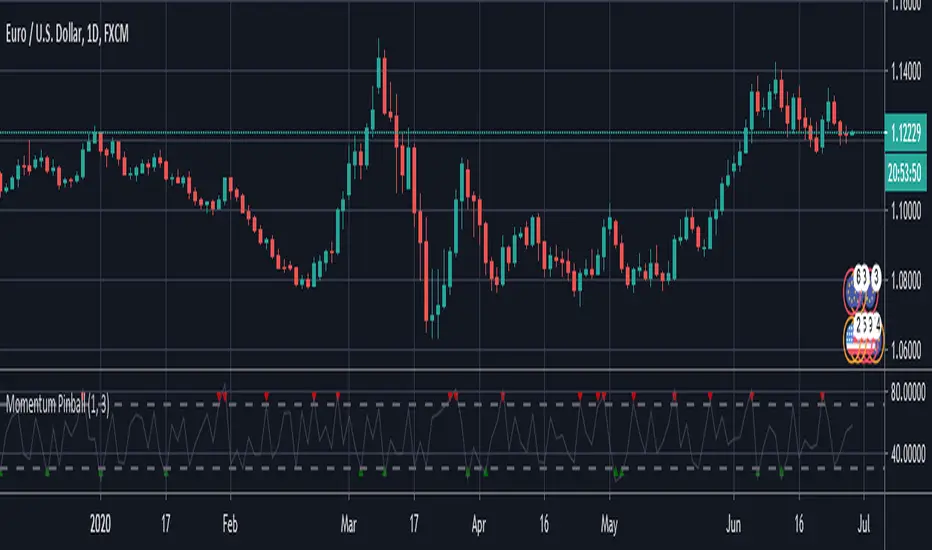
Momentum PinballMomentum Pinball, when you get a buy/sell signal, wait for the next day
enter on the high or low of the first hour and place a stop in the low/high
of the first hour. If the day you get filled closes profitable you can decide to close
the trade buy the end of the day or hold overnight and exit the following morning
Momentum Pinball////////////////////////////////////////////////////////////////////////////////////////////////
//// Momentum Pinball, when you get a buy/sell signal, wait for the next day
//// enter on the high or low of the first hour and place a stop in the low/high
//// of the first hour. If the day you get filled closes profitable you can decide to close
//// the trade buy the end of the day or hold overnight and exit the following morning
////////////////////////////////////////////////////////////////////////////////////////////
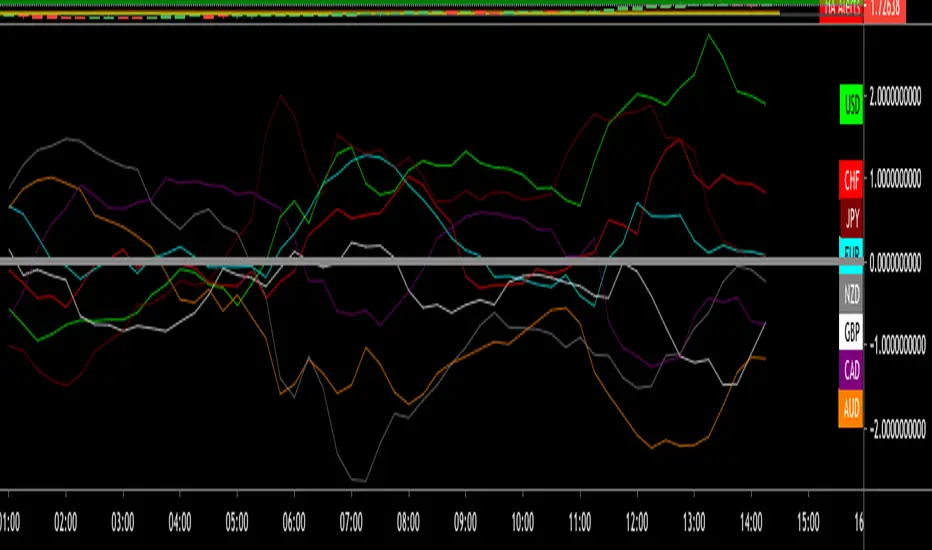
Momentum meter for 8 top currencies. Momentum meter for 8 top currencies.
USD, CAD, CHF, JPY, AUD, NZD, EUR and GBP
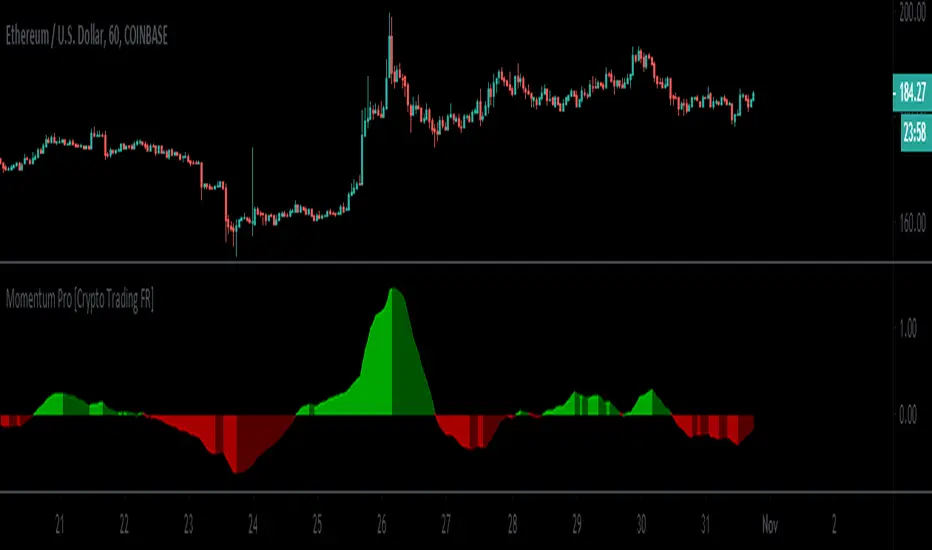
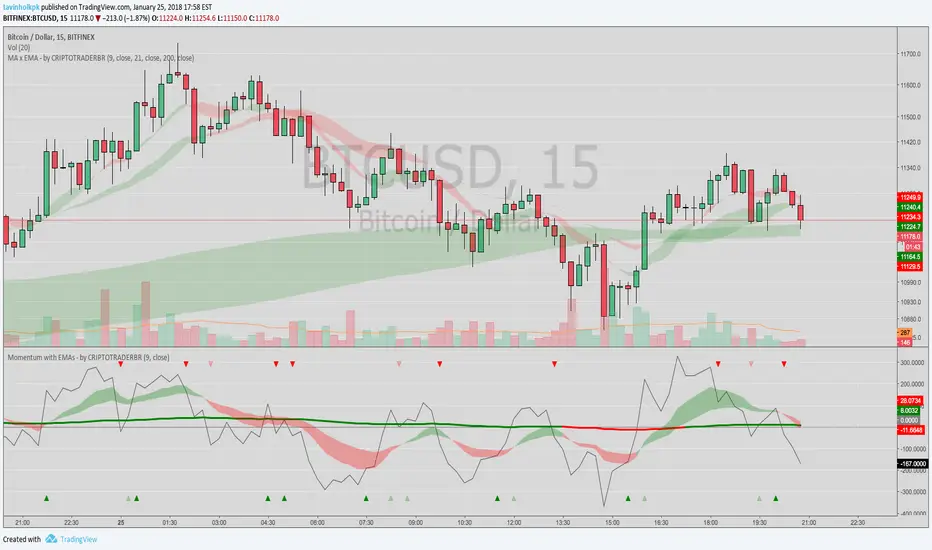
Momentum Pro [Crypto Trading FR]Momentum Pro is a script geared toward identifying price trends.
It is calculated to best fits the set of data being analyzed whatever the timeframe used.
Momentum Pinball IndicatorMomentum Pinball, when you get a buy/sell signal, wait for the next day enter on the high or low of the first hour (depending on the signal) and place a stop in the low/high of the first hour. If the day you get filled closes profitable you can decide to close the trade by the end of the day or hold overnight (if there was a considerable move) and exit the following morning. This strategy is based on the 3 period RSI of the one period ROC

Trader Set - Volume MomentumThis is a Momentum indicator but on "Volume" The formula is heavily tweaked version of TSI with chance of using different averaging types, the period numbers are fixed and user don't need to type anything for them!
Please don't contact me for getting access, these tools are available for my students only. These are part of my "methodology" that I teach. The English version of the website and learning material is under development and I will announce it under each related script when they are ready so that those who are interested can participate in the course.
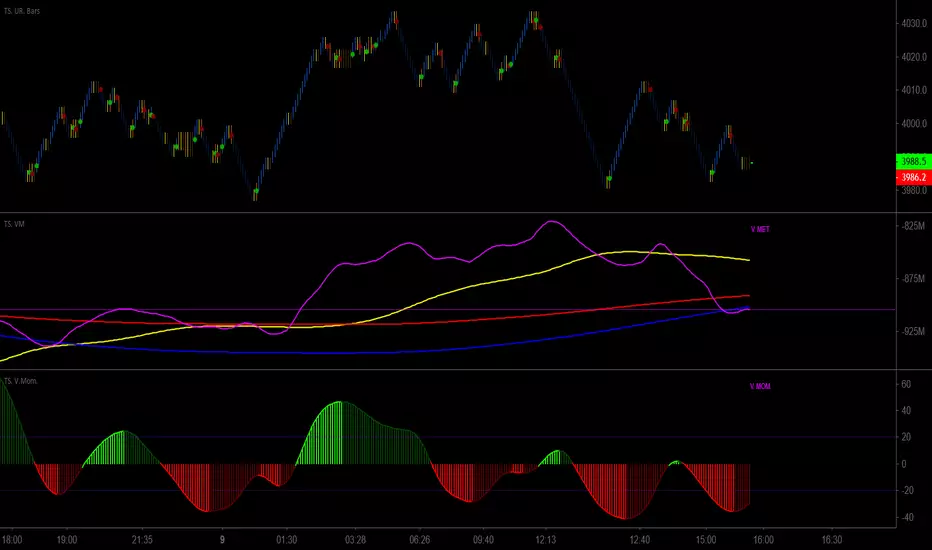
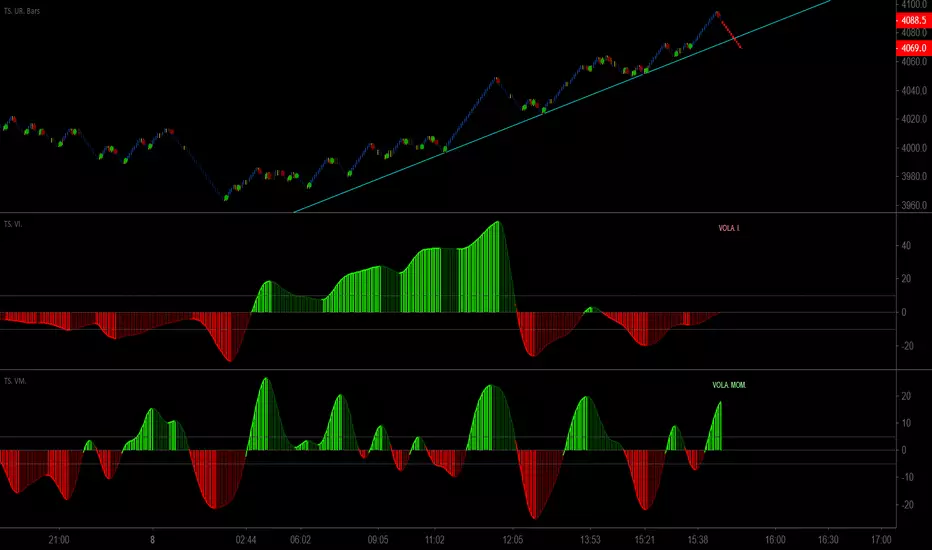
Trader Set - Volatility MomentumThis another one of the tools I missed publishing till today, this is a momentum indicator of volatility index (original formula), it will work hand in hand with volatility index oscillator (will publish right after this one) to easily identify divergences just before the market's direction change !
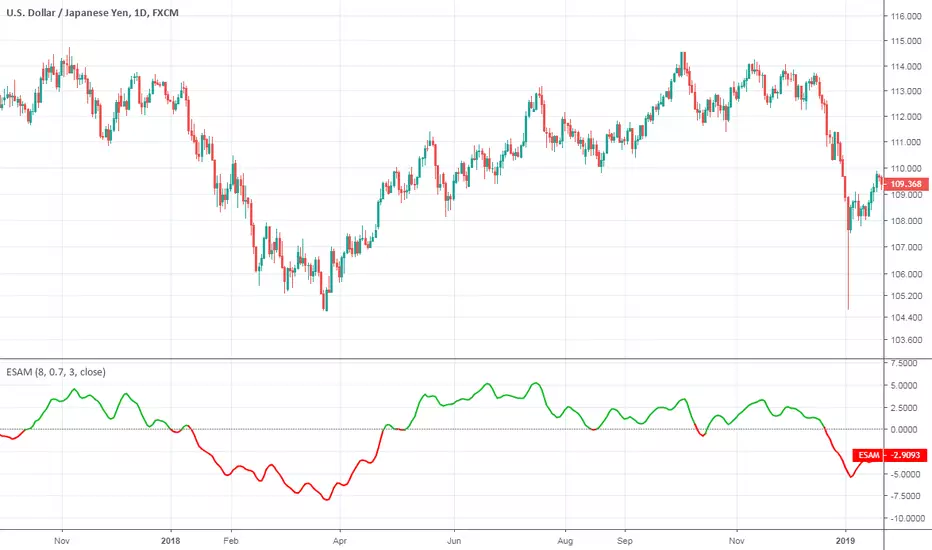
Ehlers Smoothed Adaptive MomentumEhlers Smoothed Adaptive Momentum script.
This indicator was developed and described by John F. Ehlers in his book "Cybernetic Analysis for Stocks and Futures" (2004, Chapter 12: Adapting to the Trend).
Stochastic Momentum IndexStochastic Momentum Index indicator script. This indicator was originally developed by William Blau (Stocks & Commodities V. 11:1 (11-18)).

Intraday Momentum IndexIntraday Momentum Index indicator script. This indicator was originally developed by Tushar Chande.

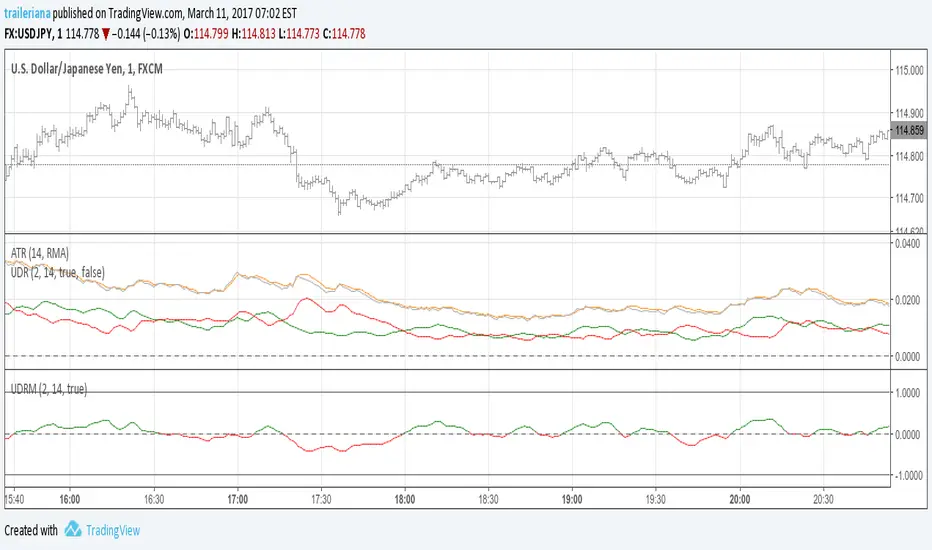
Up/Down Range MomentumThe Up/Down Range breaks the price range into an upward and a downward moving component, so we can easily turn it into a momentum oscillator. This script does just that.
You can find the Up/Down Range (UDR) indicator here:
Momentum Willams %RMomentum of Williams %R, idea from Vaicru a Trading view user, I just plot it. This is a good indicator to find divergence and easy to read; if the price and the momentun going to opposite direction, something is going to happen. Be carefull as it can anticipate inversion too early.

Stochastic Momentum IndexThis is an implementation of the Stochastic Momentum Index from William Blau's his article in Stocks & Commodities .
This also allows the use of various different kinds of moving averages for the signal line. Options for this argument are:
sma (simple moving average)
ema (exponential moving average)
wma (weighted moving average)
trima (triangular moving average)
zlema (zero-lag exponential moving average)
dema (double exponential moving average)
tema (triple exponential moving average)
hma (hull moving average)
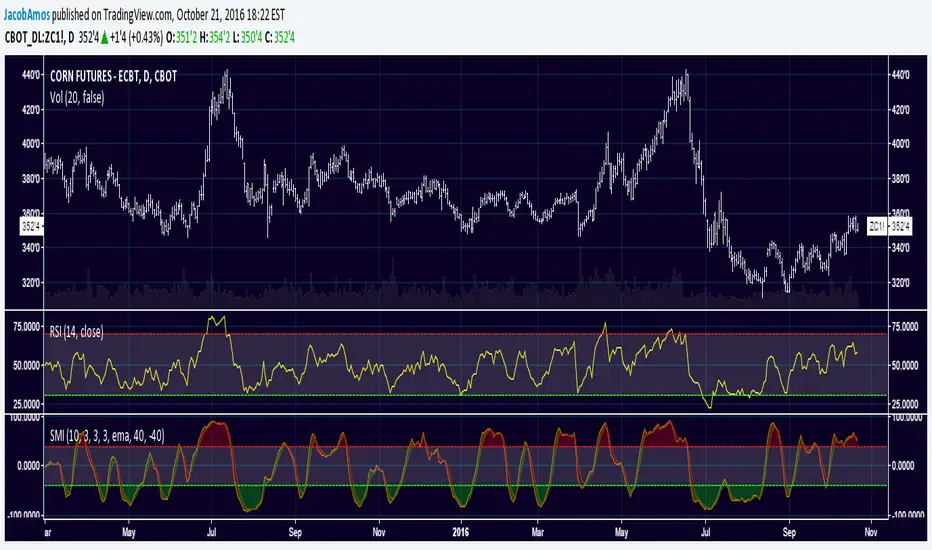
Stochastic Momentum Index (SMI)Stochastic Momentum Index (SMI) or Stoch MTM is used to find oversold and overbought zones. It also helps to figureout whether to enter short trade or long trade.
Red Shade in the Top indicates that the stock is oversold and the Green shade in the bottom indicates overbought.
Strategy:
Enter Long once the Overbought Zone ended and there's a crossover below -35.
Exit Long once the oversold zone is ended and there's a crossover.
Enter Short once the oversold zone is ended and there's a crossover above 35.
Exit Short once the Overbought Zone ended and there's a crossover.
Backup: Always use with another indicator because there will be multiple up and down movement in one Trend.

Dynamic Momentum Oscillator (Dynamo)Hi,
In July 1996 Futures magazine, E. Marshall Wall introduces the
Dynamic Momentum Oscillator (Dynamo). Please refer to this article
for interpretation.
The Dynamo oscillator is a normalizing function which adjusts the
values of a standard oscillator for trendiness by taking the difference
between the value of the oscillator and a moving average of the oscillator
and then subtracting that value from the oscillator midpoint.
Swing Trading System v5 - Dynamic SL/Targets with LabelsThe Swing Trading System v5 is a fully-automated swing-trend framework designed to identify high-confidence breakout entries, generate dynamic stop-loss and target levels, and visually label actionable trade zones on the chart.
It adapts to market conditions using structure breaks, EMA trend filters, candle confirmation, and volume expansion signals.
Core Features
1. Swing Breakout Engine (Structure-Based)
The system detects short-term swing highs/lows and evaluates whether price has broken out above resistance or broken down below support.
A directional bias is established using a structure-based confirmation variable and automatically updated trailing stop logic.
2. Trend Filter (EMA 20/50/200)
To avoid counter-trend trades, the engine uses:
EMA-200 for primary trend direction
EMA-20 and EMA-50 for near-term momentum
Signals align only when structure breaks AND the major trend confirm each other.
3. Candle Confirmation
Entry signals require classical reversal momentum patterns:
Bullish Engulfing for long trades
Bearish Engulfing for short trades
This filters out weak structure breaks and ensures institutional momentum.
4. Volume Confirmation
Volume must exceed a configurable SMA-based threshold.
This prevents false signals during low-liquidity or consolidation phases.
Signal Logic
Long Signal Triggers
A Buy signal is printed when:
Price crosses above the dynamic trailing stop (swing resistance)
Price is above EMA-200 (bull trend)
Candle forms a bullish engulfing confirmation
Volume > SMA(10) × Multiplier
Short Signal Triggers
A Sell signal occurs when:
Price crosses below the dynamic trailing stop (swing support)
Price is below EMA-200 (bear trend)
Candle forms a bearish engulfing confirmation
Volume expansion confirms downside momentum
Dynamic Stop-Loss & Profit Targets
When a signal triggers, the system automatically calculates:
Stop-Loss (SL):
Long trades: last swing low
Short trades: last swing high
Target 1 (TP1): 1.5R relative to swing distance
Target 2 (TP2): 3.0R for trend continuation moves
SL, TP1, and TP2 are displayed on-chart using extended line plots and right-side labels for clean visualization.
Labels for old signals are automatically deleted to keep the chart uncluttered.
Visual Components
The indicator provides:
BUY/SELL signal labels
Dynamic SL, TP1, TP2 lines with color coding
SL/TP labels positioned at the end of each new trade
Clean breakout detection based on structural pivots
All elements update automatically as new swings form.
Intended Use
This system is built for:
Swing Traders
Systematic Discretionary Traders
Trend Followers
Breakout/Momentum Traders
Works well on:
Stocks
Crypto
Forex
Indices
Commodities
Optimal timeframes: 1H, 4H, Daily, Weekly
Summary
The Swing Trading System v5 provides:
High-quality breakout entries
Trend-aligned signals
Volume-filtered confirmation
Automated risk-reward generation
Clean and dynamic chart labels
A complete, self-contained swing-trading solution for systematic execution and disciplined risk management.

UCS_Squeeze_Momentum-Optimized_AlertSqueeze Momentum - Alert Indicator.
Set alerts for as many bars as you like. For reference on how to set alerts, please watch the video from Chris Moody, Link - videos.tradingview.com

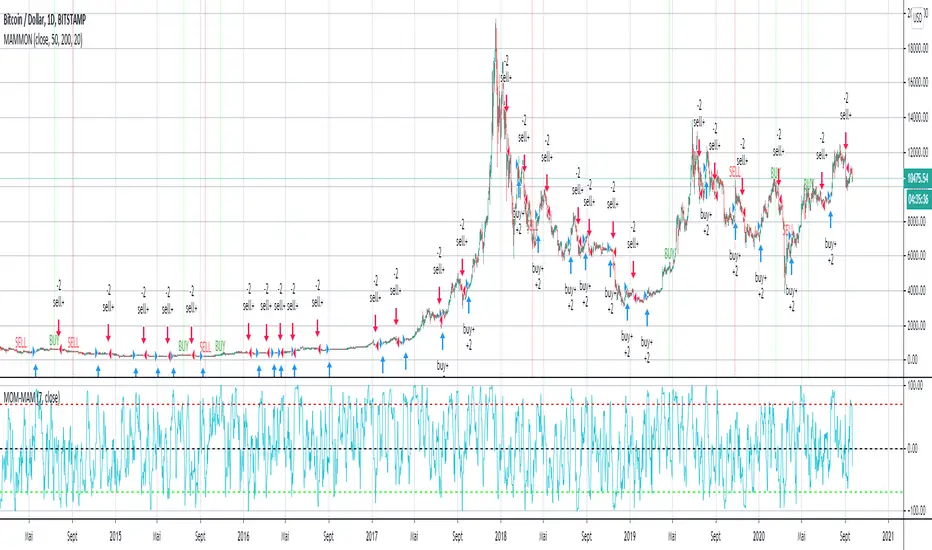
MAM-MOM -v1EN :
welcome everyone to MAM-MOM -v1.
MAM-MOM is a momentum indicator with input values shorter than traditional values for momentum.
MAM-MOM can only be used with MAMMON v1. It makes it possible to give strong indications according to the structures that it forms.
W & M.
if you wish to access these indicators, please contact me by private message on my trading view profile, or find in signature or in "about me" my website (currently under construction while this publication is being written).
FR :
bienvenue a tous sur MAM-MOM -v1.
MAM-MOM est un indicateur de momentum avec des valeurs d'entrée plus courte que les valeurs traditionnelles pour un momentum.
MAM-MOM s'utilise uniquement avec MAMMON v1. Il permet de donner des indications fortes suivant les structures que celui-ci forme.
W & M.
si vous souhaitez accéder a ces indicateurs, veuillez me contacter par message privé sur mon profil trading view, ou retrouver en signature ou dans "à propos de moi" mon site web ( actuellement en construction pendant la rédaction de cette publication).