Megatrend MTF AlertsMTF version of Megatrend, my most reliable indicator for trend analysis.
It called the end of the bear market perfectly and provides early signals. Press play:
在腳本中搜尋"mtf"

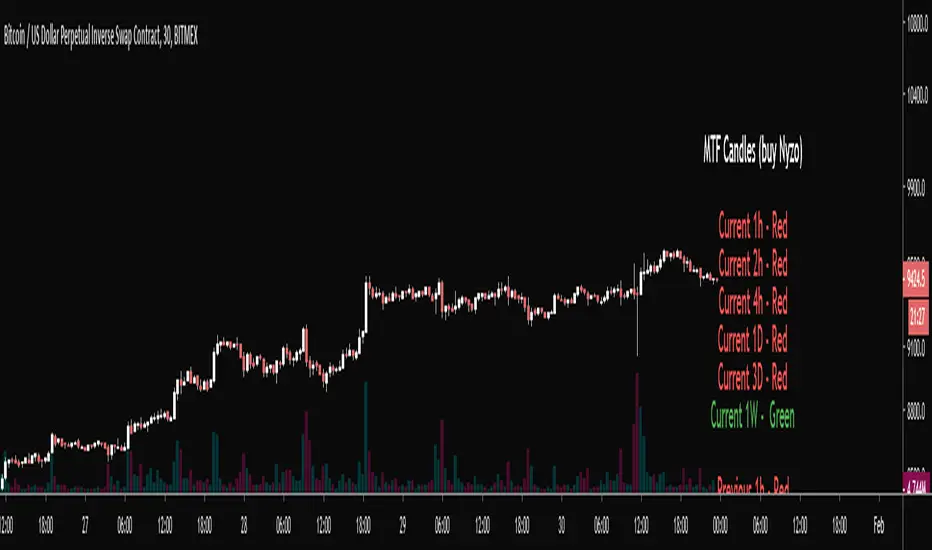
MTF Candles (Nyzo Style)This script is straight forward.
Just practicing using the security function cause I'm terrified of it.
Thanks, Daveatt for the infopanel function with the color switcher
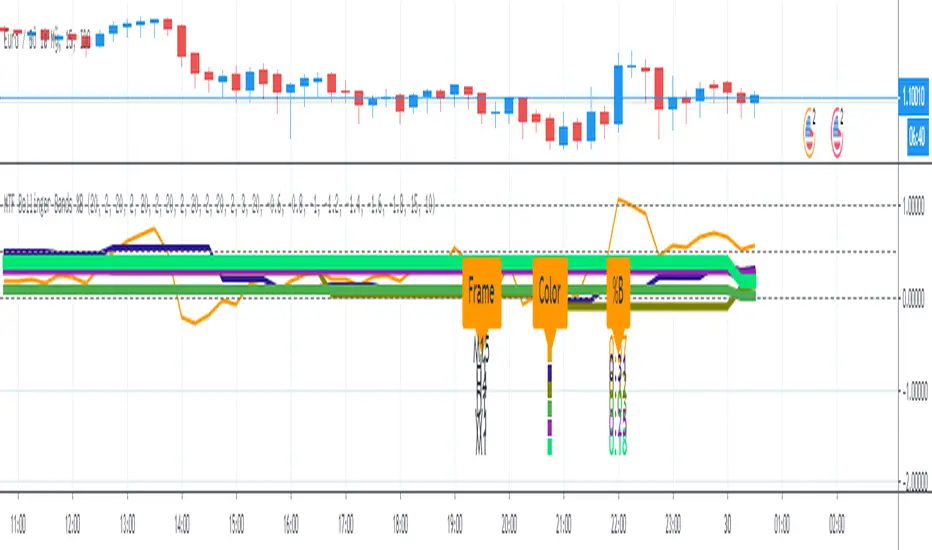
MTF Bollinger Bands %BMulti Time Frame (MTF) Bollinger Bands %B option:
1. On/ Off Bollinger Bands %B - M15 (15-Minute)
2. On/Off Bollinger Bands %B - H1 (1-Hour)
3. On/Off Bollinger Bands %B - H4 (4 Hour)
4. On/Off Bollinger Bands %B - D1 (Daily)
5. On/Off Bollinger Bands %B - W1 (Weekly)
6. On/Off Bollinger Bands %B - M1 (Monthly)
7. On/Off Panel Info: Color note & %B value
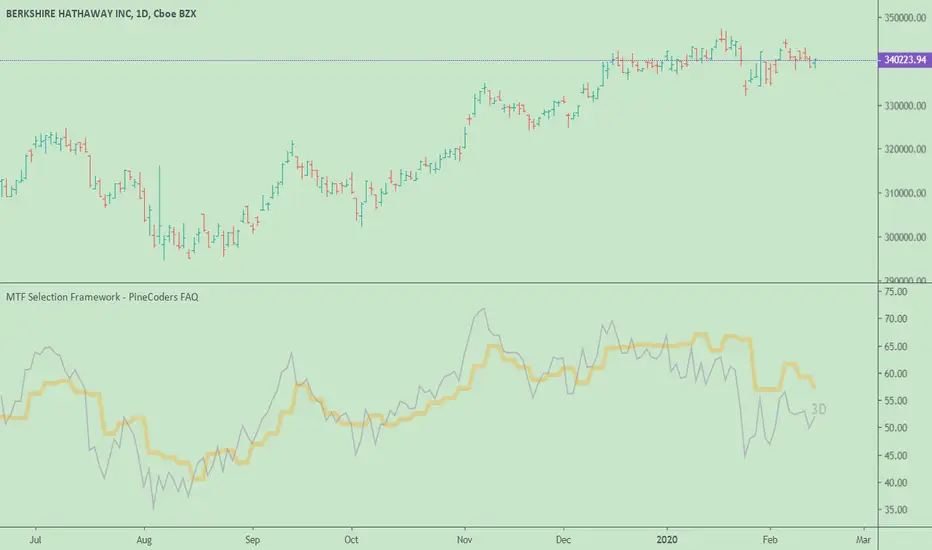
MTF Selection Framework - PineCoders FAQOur MTF Selection Framework allows Pine coders to add multi-timeframe capabilities to their script with the following features:
► Timeframe selection
The higher timeframe can be selected using 3 different ways:
• By steps (60 min., 1D, 3D, 1W, 1M, 1Y).
• As a multiple of the current chart's resolution, which can be fractional, so 3.5 will work.
• Fixed.
► Non-repainting or Repainting mode can be selected.
► Smoothing of the HTF line
Can be turned on/off and a smoothing factor allows the user to select the degree of smoothing he requires.
The framework is used here to create a higher timeframe version of a simple RSI line, but it can be used to access HTF information for almost any signal.
Functions used
f_resInMinutes()
Converts the current timeframe.multiplier plus the TF into minutes of type float.
• In Pine, the timeframe.multiplier is an integer representing the resolution, but a value of 1 can mean one day or one minute. This function converts that information in a standard fractional float minutes format that can then be used by the other functions in the framework.
• If the chart's current resolution is 15 seconds, the function will return 0.25 . If the chart's resolution is one day, it will return 1440 .
f_tfResInMinutes(_resolution)
Returns resolution of _resolution period in minutes.
• This function does the same as f_resInMinutes() , but on the target resolution supplied as a parameter in the timeframe.period string format.
f_resNextStep(_res)
Given a current resolution in fractional float minutes, returns its corresponding stepped HTF in the timeframe.period string format.
• This allows the implementation of the step HTF selection mode.
f_multipleOfRes(_res, _mult)
Given a current resolution in fractional float minutes and a fractional multiplier, returns a multiple of the resolution as a string in "timeframe.period" format usable with "security()".
• A multiple like 3.5 is allowed.
• Note that with seconds resolutions, the result returned is constrained by the discrete seconds resolutions available on TV.
f_htfLabel(_txt, _y, _color)
Used to display a label showing either:
• A warning when the chart's resolution is not lower than the HTF.
• The HTF resolution currently used.
The y position used to position the label will require adaptation to the signal you are using. For use in "overlay = true" mode, a technique that works well is commented out in the code.
Look first. Then leap.
MTF Smoothed Moving Averages x4A set of smoothed moving averages that stay at a fixed timeframe, regardless of the timeframe of the chart but don't have nasty jaggedy lines. Instead, they are smooooooooooooth...

MTF Average Directional Index Range DetectorHigher Timeframe ADX to detect range/trending market while trading lower time frames.
Change the resolution in the parameters. You must use a time frame equal or higher to the current time frame.
Red = Range
Green = Trending
Use the alerts to get notified when the color changes.
Adjust the Threshold parameter to change the value from which the color changes.
Click Add to favorites to get the indicator on your chart (it will appear in the Indicators->Favorites tab).
Leave a like if you find it useful!
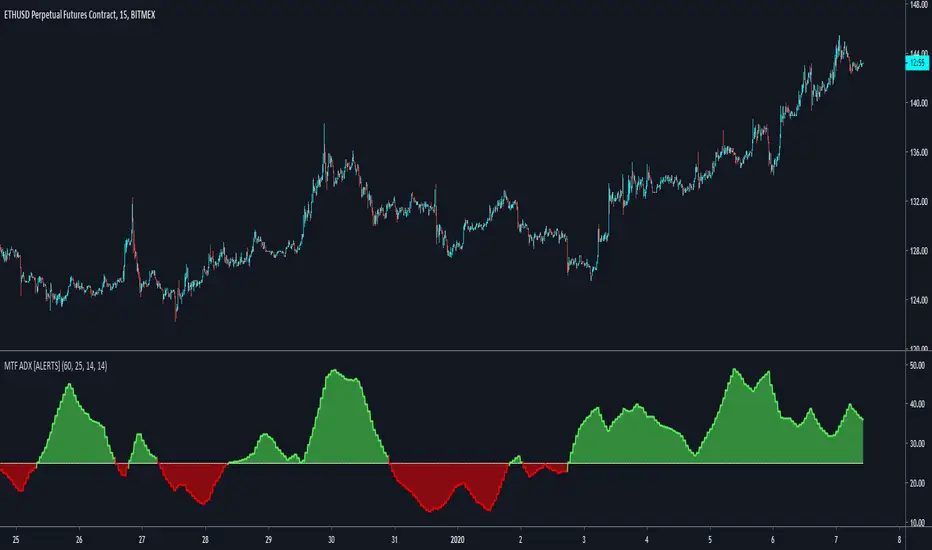
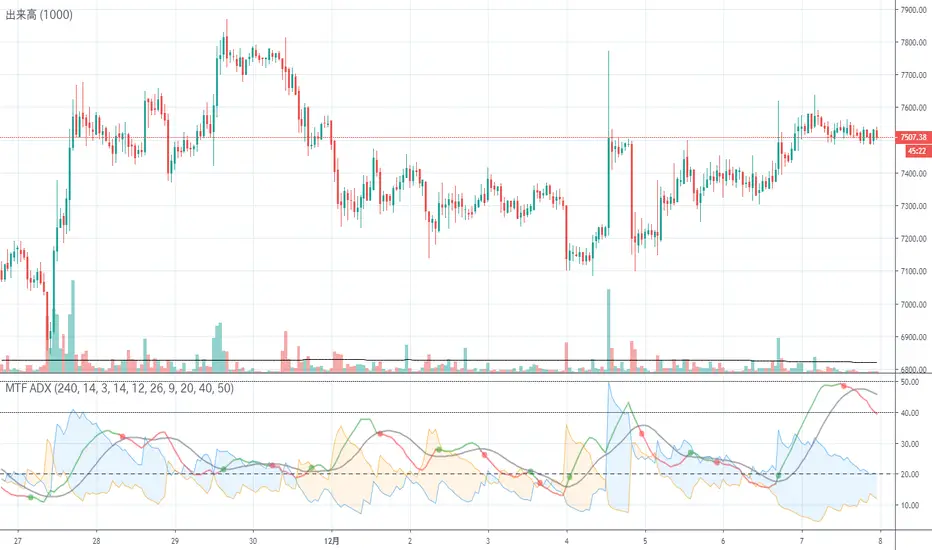
MTF ADXI tried to convert ADX to MTF. The trend strength can be judged with ADX.
It can be judged that a trend below 20 is a weak trend, a trend above 40 is a strong trend, and a trend above 50 is a very strong trend.
As for the color of ADX, the green part is rising and the red part is falling.
It is assumed that you will make a position at the moment when it turns green or when it exceeds 20.
Entry points correspond to alerts.
The direction of the trend is judged by DI +, DI-, the part painted in blue is the uptrend and the part painted in orange is the downtrend.
ADXをMTF化してみました。ADXでトレンドの強さが判定できます。
20以下は弱いトレンド、40以上は強いトレンド、50以上は非常に強いトレンドと判定できます。
ADXの色は緑の部分が上昇中、赤色の部分が下降中です。
緑に変わった瞬間、または20を超えた瞬間ポジションメイクするのを想定しています。
エントリーポイントはアラートに対応しています。
トレンドの向きはDI+,DI-で判定し、青色に塗っている部分は上昇トレンド、オレンジ色に塗っている部分は下落トレンドです。
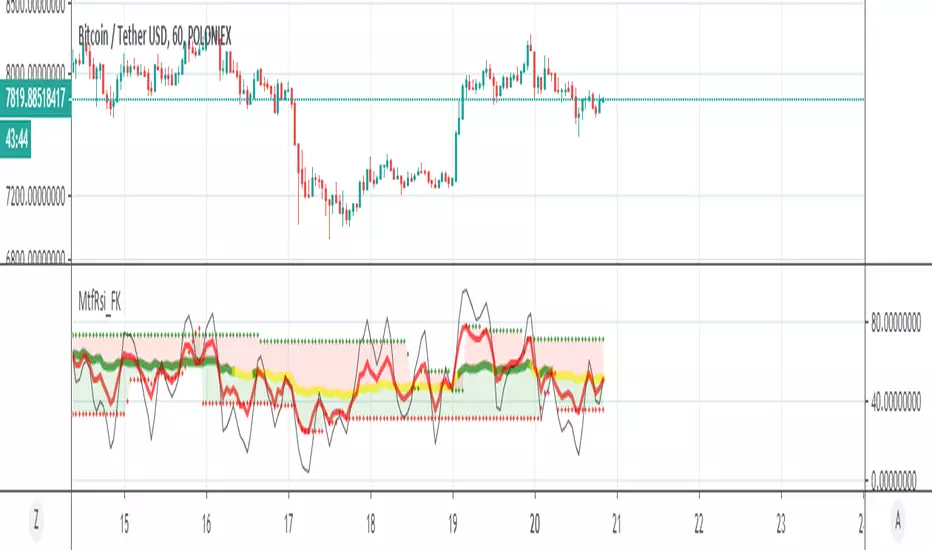
MTF RSI [mushoku]Multi Time Frame RSI
異なる時間軸のRSIを同時に表示できるインジケーターです。
無料で使用できます。
こちらでも簡単ですが紹介しています。
note.mu


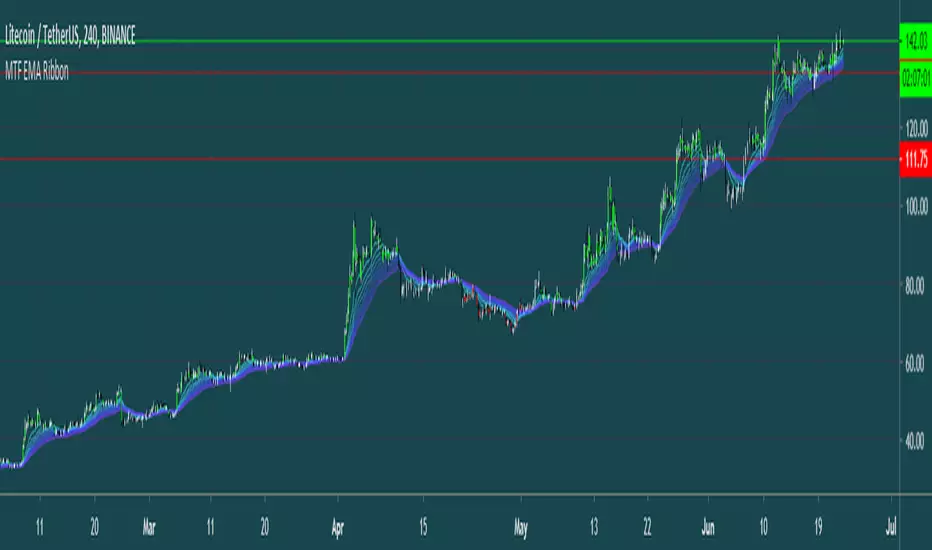
MTF EMA RibbonThis Script analyses trends using an EMA Ribbon (Can be adjusted to any timeframe).
tips are always welcome at: 38uGQJDDZDL6wX48x4gYTccPeQ3ZHVYmY4 (btc)
I hope you enjoy the script :)
MTF Ichimoku CloudI published it because I could not find a good MTF glance.
なかなか良いMTF一目が見つからないので公開しました。

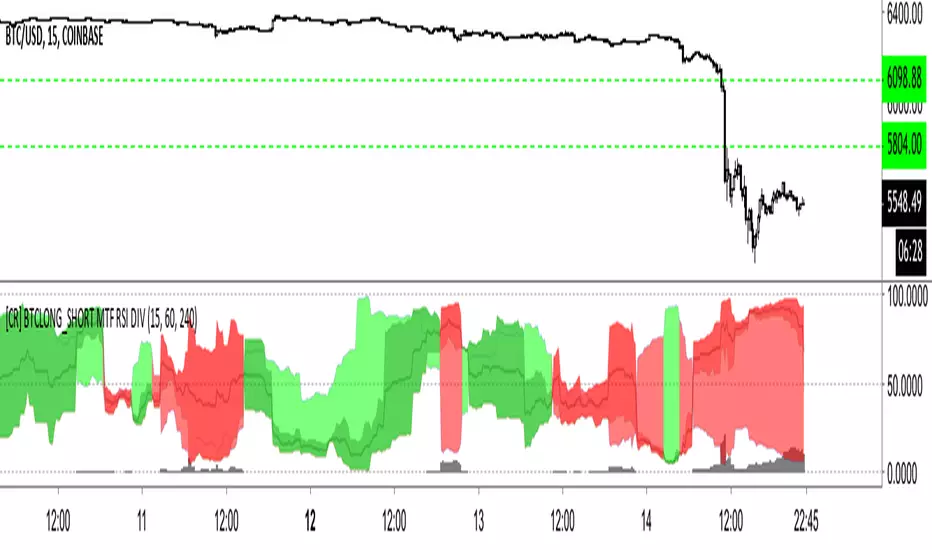
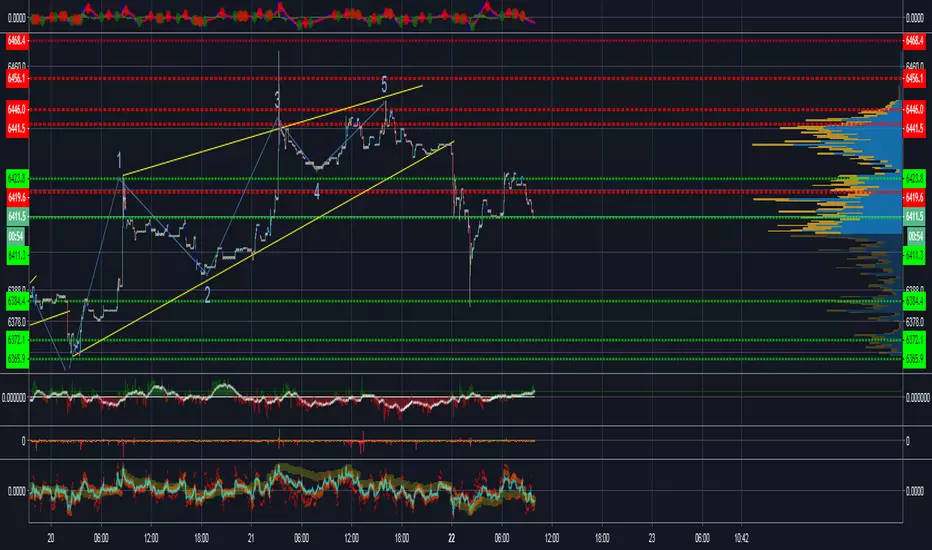
[CR] BTCLONG_SHORT MTF RSI DIV+ MTF x 3 BTCSHORT and BTCLONG on BITFINEX RSI
+ SHORT vs LONG RSI + Difference
This indicator demonstrates the difference between BTCLONG and BTCSHORT values on BITFINEX and compares their relative difference also in RSI.
Red = SHORT > LONG
Lime Over Green = LONG > SHORT difference RSI greater than LONG vs SHORT RSI.
Red Over Darker Red = SHORT > LONG difference RSI greater than SHORT vs LONG RSI.
Black trend line = Total SHORT/LONG RSI
Grey Columns = Total RSI / Difference RSI
MTF TRIX - squattterBest setting is 5, with a couple of signal lines set to 7 and 14 for crossovers or bounces.

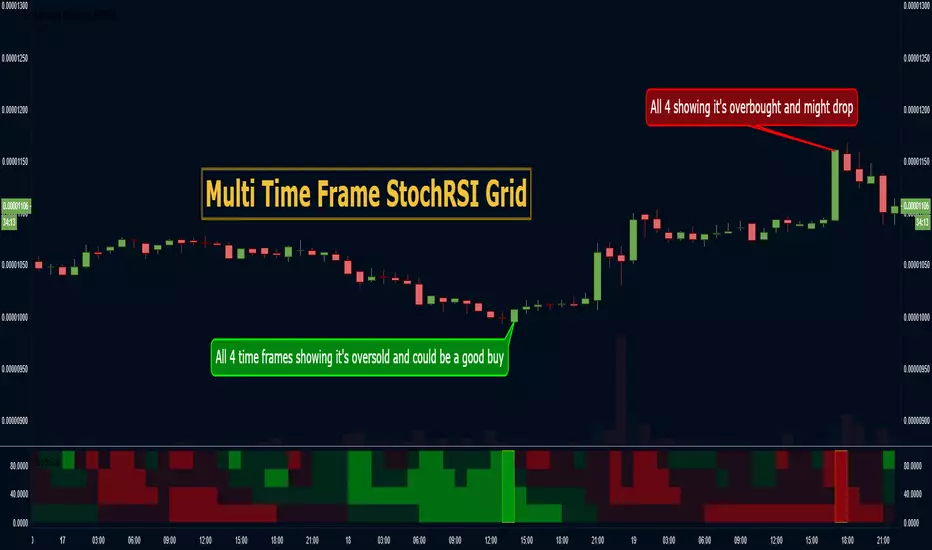
MTF StochRSI Grid - CryptoProToolsUsing this Grid you can monitor StochRSI OB and OS levels across multiple time frames with ease!
----------------------------------------------------------------------
Popular Recent Releases by CryptoProTools
----------------------------------------------------------------------
----------------------------------------------------------------------
May the profit be with you!
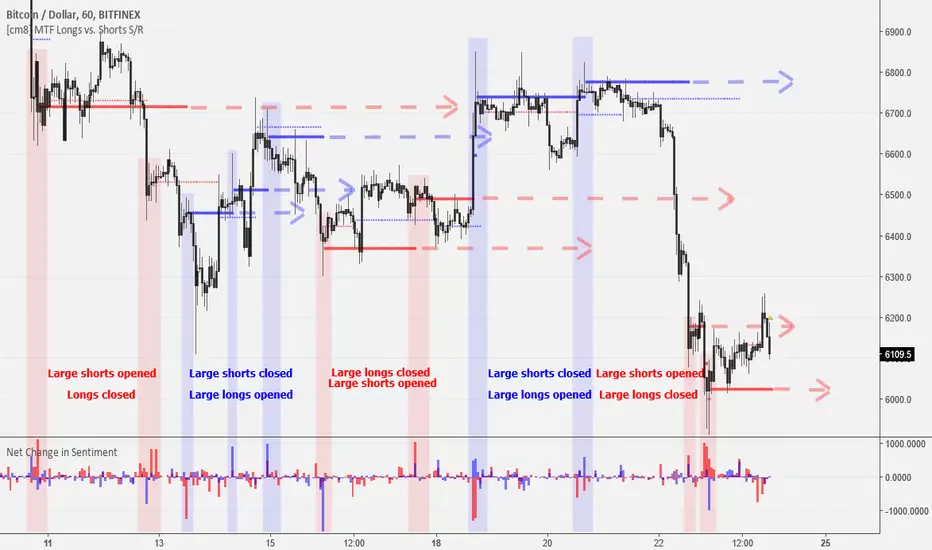
MTF Bitfinex Longs vs. Shorts Support/Resistance [checkm8]Hello and welcome to my multi-timeframe support and resistance indicator based on margin longs and shorts on Bitfinex :D
The premise of the script is simple. It draws support and resistance levels based on large margin movements ( effectively showing the break-even points of those positions ), where:
Longs opening and shorts closing is bullish pressure
Longs closing and shorts opening is bearish pressure
You can select your desired timeframe for the script to show the levels on. The script draws two sets of lines, one based on medium-sized movements and another based on large movements, where you can also manually input the size of the movements for it to track. By default, the script is optimized for 1-hour timeframes on BTCUSD, where the medium sized movements are set to bullish/bearish pressures of over 500 BTC, and large movements based on pressures of over 1000 BTC.
If you choose to use a different currency pair (ex. LTCUSD, ETCUSD, EOSUSD, etc..) you must adjust the volume that the script tracks , as tracking something like a 500 margin long in XRPUSD is useless. This also applies to timeframes , as timeframes lower than 1 hour may require smaller input values, while larger timeframes will require larger movements.
In addition, there is an input for the source. I recommend leaving this setting at hlc3 , because this will capture a more appropriate break-even points for the S/R levels.
A few tips:
If the current price is under a bullish support/resistance level , this implies that the bullish margin positions are underwater (the price is below their long break-evens), ie. shorts closed at the top or longs were entered at the top
If the current price is above a bullish support/resistance level , this implies that the bullish margin positions are in profit and will act as support (they will support their long break-even points)
If the current price is under a bearish support/resistance level , this implies that the bearish margin positions are in profit and will act as resistance (the price is below their short break-evens)
If the current price is above a bearish support/resistance level , this implies that the bearish margin positions are underwater (the price is above their short break-evens), ie. shorts entered at the bottom or longs were closed at the bottom
Happy trading and feel free to reach out with feedback and suggestions! :D
Special thanks goes to oh92 for his input and feedback on the idea. Check out his profile and his vast selection of indicators in the links below!
www.tradingview.com
depthhouse.com

MTF RSIHello traders, I am happy to share with you my latest indicator I have developed. It's called " MTF RSI ".
The core idea of the EA is to get the average of RSI value of multiple timeframes, current , 3x and 6x of current time frame, and calculate a more accurate RSI value which will indicate more clear oversold or overbought levels that rsi has reached.
It is believed that when there is a convergence of the same indicator in multiple time frames, it is more likely traders will obtain a valid signal.
Besides the averaged RSI, an EMA of period of 14 is added to this EA. Traders can make use of crossing signals to kick off their trade decisions.
Please provide feedback on how I can improve this indicator and provide better quality signals. Thank you

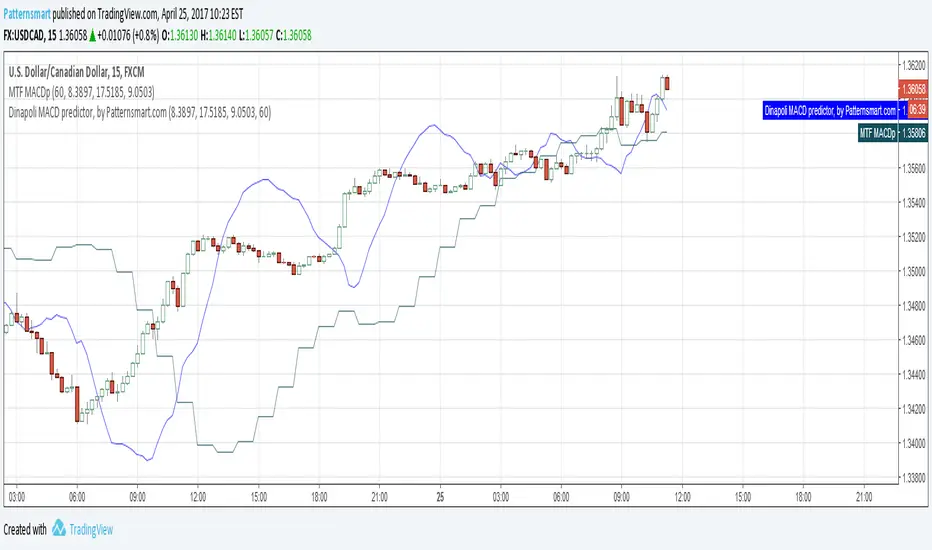
MTF Dinapoli MACD predictor V2This is the Multi Time Frame version of Dinapoli MACD predictor indicator
Fixed a bug of previous version.
Dinapoli macd predictor is a trending indicator that give you not only what direction a forex pair is moving but also how volatile the price is. When the Forex market starts giving new max or minimum level values, the Dinapoli macd predictor follows the price trend direction and pullsup the level of quit from the currency market . Stops should be applied where they are for a purpose, and in that case, should not be changed.
The whole idea behind a practical trading plan is to keep it as simple as possible.
MTF Trend 4 in 1 Multi Time Frame V2Price can be up trend and downtrend simultaneously in different timeframes.
Experienced traders know the importance of looking at Multiple Time Frames.
Analyzing multi time frame chart allows trader to have a greater view on the price action.
This MTF trend indicator shows the trend of current time frame and 3 higher time frames in a single chart. In addition, it will check the consistence of all 4 time frames. It will not repaint.
It will only work on time based charts. Tick and range charts are not supported.
The green dots represent uptrend, and the red dots represent downtrend.
The 'trend period' is used to measure the direction of price within the given number of bars.
The dots of value 1 at the bottom is the trend of 'timeframe 1'
The dots of value 2 is the trend of 'timeframe 2'
The dots of value 3 is the trend of 'timeframe 3'
The dots of value 4 is the trend of current timeframe.
If current and 3 higher time frames are in the same direction, the dots at the top will appear.
Otherwise, there will be no dots at value 6.
'timeframe1' 'timeframe2' and 'timeframe3' must be higher than current timeframe, if your chart is 15min, 'timeframe1' 'timeframe2' and 'timeframe3' must be15min or higher.
It will highlight bars when trends are inconsistent in different timeframes.
You can change the highlight color, or disable this feature.
The highlighted bars represent the situation where price may change its direction from previous trend, or in a short-term adjustment.

