B3 MTF OHLCB3 M ulti T ime F rame - O pen H igh L ow C lose
For showing a 2nd resolution on one chart; Not much more to say about that :)
在腳本中搜尋"mtf"

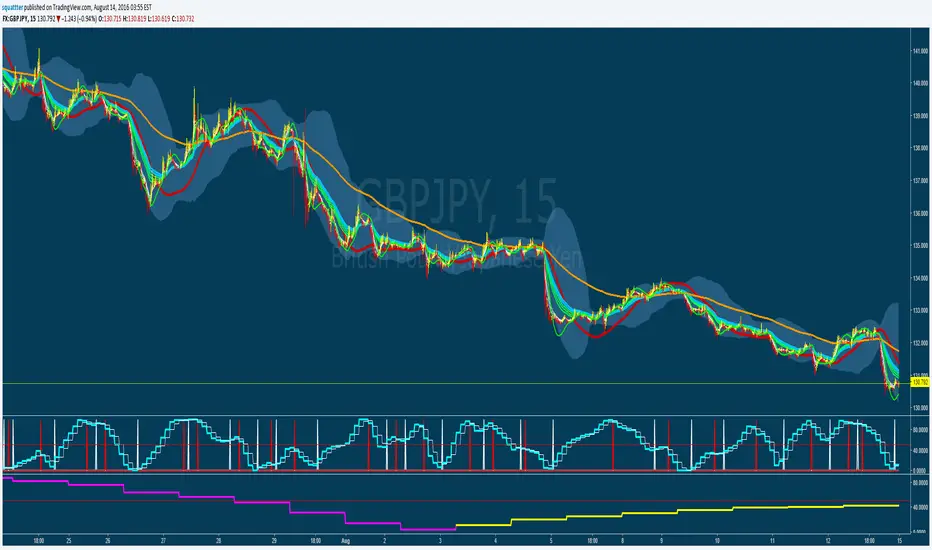
MTF Stochastic CCI ALERTWorks good on 5 or 15min set to the 2hr or 4hr time frame.
Set an alarm (Set an alert on each Long/Short "crossing down", 0.8 (or anything below 0.99), "on condition" )
Or just as a visual.
Best to use other factors to confirm but most of the time it does a pretty decent job.

Moving Average with Multiple Display Mode(MTF/Non MTF MA)Japanese below / 日本語説明は下記
It's an upper version of "MTF SMA on specific timeframe(5M-4H)" which I previously developed.
MTF SMA on specific timeframe(5M-4H)
This is a simple indicator that shows a moving average(MA) but you can choose two display mode depending on your needs;
1. MTF mode
2. Non MTF Mode(Display always)
1. MTF mode
MA becomes MTF MA, meaning that a MA is displayed on the timeframe that users select as MTF MA timeframe or lower timeframe.
i.e. If you select Daily timeframe from MTF MA timeframe, MA will be displayed on daily or lower timeframe; daily, 4 hour, 1 hour, 30mins, 15min, 5mins, 1min.
Note: You need to select "MTF MA timeframe" on input screen.
2. Non MTF Mode(Display always)
MA will always be displayed regardless of timeframe that users open.
Note: If you select Non MTF Mode, MTF MA timeframe on input screen is ignored.
Enjoy your trading!
----------------------------------------------------
以前リリースした "MTF SMA on specific timeframe(5M-4H)" の上位バージョンインジケーターです。
MTF SMA on specific timeframe(5M-4H)
1本の移動平均線(MA)を表示するインジケーターですが、ユーザーのニーズに応じて二つの表示モードを選択することができます。
1. MTFモード
2. Non MTFモード
(常に表示)
1. MTFモード
上位足のMAを下位足に表示するMTF MAとして機能させることができます。MAはユーザーが上位足のタイムフレームとして選択したタイムフレームとそれ未満のタイムフレームで表示されます。
例: 日足を上位足タイムフレームとして選択した場合、日足のMAが日足とそれ以下のタイムフレーム(4時間足、1時間足、30分足、15分足、5分足、1分足)に表示されます。
注: 設定画面で"MTF MA timeframe" を上位足のタイムフレームとして選択してください。
2. Non MTFモード
(常に表示)
ユーザーが現在開いているタイムフレームに関係なく、設定したMAが各タイムフレームで常に表示されます。通常の移動平均線インジケーターと同じ機能です。
注: Non MTFモードを選択した場合、設定画面のMTF MA timeframe は無視されます。

12 multi time frame MA displayed on specific timeframe/複数MTF MAJapanese below. / 日本語説明は下記
——Republishing after issues pointed out by a moderator resolved.—————
This indicator shows 12 sets of multi time frame moving average(MTF MA) from different time frames which is weekly, daily, 4 hour and 1 hour to lower time frames.
Purpose
This indicator has been developed to show higher timeframe’s moving average as they are expected to work as support and resistance .
How is it different from other MTF MA indicators?
Problems with other conventional MTF MA indicators are;
1.If you set higher timeframe MA, it will also be shown on further higher time frames.
e.g. If you set 4hour chart’s MA on 1 hour or lower time frame charts, it will also appear on daily and weekly chart, which is unnecessary and annoys your chart.
2.One indicator displays one MTF MA only which impacts the number of indicators that you can set.
To tackle these problems, this indicator has incorporated functions below.
1. Control time frames where MTF MA is displayed to avoid showing unnecessary information.
2. One indicator contains 12 MTF MA in which 3 MTF MA from weekly chart, 3 MTF MA from daily chart , 3 MTF MA from 4 hour chart and 3 MTF MA from 1 hour chart. Thus, this contributes to save the number of indicators that you can set.
These are the value added on this indicator.
Specification
-This indicator shows weekly MTF MA, daily MTF MA, 4 hour MTF MA and 1 hour MTF MA.
To be clear, daily MTF MA means that moving average created based on daily chart , which can be shown on daily chart and lower timeframes.
-Each MTF MA will be shown as follows based on timeframes that you select.
1. Weekly MTF MA: Shown on weekly, daily, 4hour, 1 hour, 30M, 15M and 5M chart(Monthly chart does not show MTF MA)
2. Daily MTF MA: Shown on daily, 4hour, 1 hour, 30M, 15M and 5M chart(Weekly and Monthly chart does not show MTF MA)
3. 4hour MTF MA: Shown on 4hour, 1 hour, 30M, 15M and 5M chart(Daily, Weekly and Monthly chart does not show MTF MA)
4. 1hour MTF MA: Shown on 1 hour, 30M, 15M and 5M chart(4hour, Daily, Weekly and Monthly chart does not show MTF MA)
-Each MTF MA can be enabled and disabled by ticking checkbox.
Sample chart with the indicator
●Sample parameters setting
2 MA from weekly timeframe and 3 MA from daily timeframe set.
Here is how MAs are displayed.
It does not show anything.
Only 2 MA from weekly timeframe are shown. MA from daily timeframe are not appeared. This is the difference between this indicator and other conventional MTF MA indicators.
You can see 5 MAs, which are 2 MA from weekly timeframe and 3 MA from daily timeframe .
<4hour chart>
<15M chart>
Journey to use indicator
This indicator is paid indicator and invited-only indicator.
Please contact me via private chat or follow links in my signature so that we can initiate the process to access the indicator
--------------------------------------------------------------------------------------------------
週足、日足、4時間足、1時間足という異なる複数のタイムフレームから最大で12本(各タイムフレームから3本ずつ)のマルチタイムフレーム移動平均線を設定できるインジケーターです。
インジケーターの目的
上位足の移動平均線を下位足に表示することで、上位足での目線を持ったまま下位足の分析を行ったり、上位足によるレジサポの判断に使うことを想定しています。
他のマルチタイムフレーム移動平均線との違い
他のマルチタイムフレーム移動平均線インジケーターでは、よく以下の問題に直面します。
・上位足の移動平均線を表示しようとすると、さらに上位足でもその移動平均線が表示され、チャートが見にくくなる。
例: 4時間足の移動平均線を1時間足で表示可能なように設定すると、日足や週足でも4時間足の移動平均線が表示され、チャートがノイズだらけに・・・
・一つのインジケーターでは原則一つの移動平均線のみ表示。異なる時間軸のマルチタイムフレーム移動平均線を表示しようとするとその数だけインジケーターを追加する必要あり。
これらの問題に対応するため、このインジケーターでは、
・マルチタイムフレーム移動平均線を表示する時間軸を制御することで上位足側に不必要な情報を表示させない。これによりチャートをスッキリと見やすくすることができる。
・週足、日足、4時間足、1時間足という4つの異なる時間軸から3つずつ、最大で12本のマルチタイムフレーム移動平均線を設定可能。これによりインジケーター数を節約。
という機能を加えることでこれらの問題を解決しています。
これがこのインジケーターが提供する付加価値だと考えています。
仕様
機能概要
・このインジケーターでは週足、日足、4時間足、1時間足の4つの時間軸のマルチタイムフレーム移動平均線を表示します。
・設定できる移動平均線は週足から3本、日足から3本、4時間足から3本、1時間足から3本の最大12本まで設定可能です。
・それぞれの移動平均線はSMA(単純移動平均線)とEMA(加重移動平均線)を選択することができます。期間の設定も移動平均線ごとに設定可能です。
・各移動平均線は表示しているチャートの時間軸に応じて以下の様に表示されます。
例えば週足の移動平均線を設定すると、その移動平均線は週足、日足、4時間足、1時間足、30分、15分、5分足に表示されます。
・毎回チャートを開くごとにそれぞれの移動平均線の表示・非表示を切り替えることは可能ですが、この移動平均線はこの時間足では常に非表示といった制御は不可能です。
サンプルチャート
週足の移動平均線を2本、日足の移動平均線を3本設定した場合のチャートの例です。
<月足>
月足では週足の移動平均線も日足の移動平均線も表示されません。
<週足>
週足では2本の移動平均線のみが表示されていることがわかります。
日足の移動平均線が上位足である週足に表示されないのが、他のマルチタイムフレーム移動平均線との違いです。
<日足>
日足では週足と日足両方の移動平均線が表示されます。
<4時間足>
<15分足>
インジケーターの使用について
当インジケーターは招待制インジケーター(有料)となっています。
使用を希望される方はプライベートチャットや下記リンクのDMでご連絡ください。
このページのコメント欄はインジケーターそのものに対するコメントやアップデートの記載のためのものとなっております。Tradingviewのハウスルールを守るためにもコメント欄からの連絡はご遠慮ください。

Multi SMA EMA WMA HMA BB (4x3 MAs Bollinger Bands) Pro MTF - RRBMulti SMA EMA WMA HMA 4x3 Moving Averages with Bollinger Bands Pro MTF by RagingRocketBull 2018
Version 1.0
This indicator shows multiple MAs of any type SMA EMA WMA HMA etc with BB and MTF support, can show MAs as dynamically moving levels.
There are 4 MA groups + 1 BB group. You can assign any type/timeframe combo to a group, for example:
- EMAs 50,100,200 x H1, H4, D1, W1 (4 TFs x 3 MAs x 1 type)
- EMAs 8,13,21,55,100,200 x M15, H1 (2 TFs x 6 MAs x 1 type)
- D1 EMAs and SMAs 12,26,50,100,200,400 (1 TF x 6 MAs x 2 types)
- H1 WMAs 7,77,231; H4 HMAs 50,100,200; D1 EMAs 144,169,233; W1 SMAs 50,100,200 (4 TFs x 3 MAs x 4 types)
- +1 extra MA type/timeframe for BB
compile time: 25-30 sec
full redraw time after parameter change in UI: 3 sec
There are several versions: Simple, MTF, Pro MTF, Advanced MTF and Ultimate MTF. This is the Pro MTF version. The Differences are listed below. All versions have BB
- Simple: you have 2 groups of MAs that can be assigned any type (5+5)
- MTF: +2 custom Timeframes for each group (2x5 MTF)
- Pro MTF: +4 custom Timeframes for each group (4x3 MTF), MA levels and show max bars back options
- Advanced MTF: +2 extra MAs/group (4x5 MTF), custom Ticker/Symbol, backreferences for type, TF and MA lengths in UI
- Ultimate MTF: +individual settings for each MA, custom Ticker/Symbols
Features:
- 4x3 = 12 MAs of any type including Hull Moving Average (HMA)
- 4x MTF groups with step line smoothing
- BB +1 extra TF/type for BB MAs
- 12 MA levels with adjustable group offsets, indents and shift
- show max bars back
- you can show/hide both groups of MAs/levels and individual MAs
Notes:
1. based on 3EmaBB, uses plot*, barssince and security functions
2. you can't set certain constants from input due to Pinescript limitations - change the code as needed, recompile and use as a private version
3. Levels = trackprice implementation
4. Show Max Bars Back = show_last implementation
5. uses timeframe textbox instead of input resolution to allow for 120 240 and other custom TFs. Also supports TFs in hours: 2H or H2
6. swma has a fixed length = 4, alma and linreg have additional offset and smoothing params
7. Smoothing is applied by default for visual aesthetics on MTF. To use exact ma mtf values (lines with stair stepping) - disable it
MTF Notes:
- uses simple timeframe textbox instead of input resolution dropdown to allow for 120, 240 and other custom TFs, also supports timeframes in H: 2H, H2
- Groups that are not assigned a Custom TF will use Current Timeframe (0).
- MTF will work for any MA type assigned to the group
- MTF works both ways: you can display a higher TF MA/BB on a lower TF or a lower TF MA/BB on a higher TF.
- MTF MA values are normally aligned at the boundary of their native timeframe. This produces stair stepping when a higher TF MA is viewed on a lower TF.
Therefore X Y Point Density/Smoothing is applied by default on MA MTF for visual aesthetics. Set both to 0 to disable and see exact ma mtf values (lines with stair stepping and original mtf alignment).
- Smoothing is disabled for BB MTF bands because fill doesn't work with smoothed MAs after duplicate values are replaced with na.
- MTF MA Value fluctuation is possible on the current bar due to default security lookahead
Smoothing:
- X,Y == 0 - X,Y smoothing disabled (stair stepping on high TFs)
- X == 0, Y > 0 - X,Y smoothing applied to all TFs
- Y == 0, X > 0 - X smoothing applied to all TFs < deltaX_max_tf, Y smoothing disabled
- X > 0, Y > 0 - Y smoothing applied to all TFs, then X smoothing applied to all TFs < deltaX_max_tf
X Smoothing with Y == 0 - shows only every deltaX-th point starting from the first bar.
X Smoothing with Y > 0 - shows only every deltaX-th point starting from the last shown Y point, essentially filling huge gaps remaining after Y Smoothing with points and preserving the curve's general shape
X Smoothing on high TFs with already scarce points produces weird curve shapes, it works best only on high density lower TFs
Y Smoothing reduces points on all TFs, removes adjacent points with prices within deltaY, while preserving the smaller curve details.
A combination of X,Y produces the most accurate smoothing. Higher delta value - larger range, more points removed.
Show Max Bars Back:
- can't set plot show_last from input -> implemented using a timenow based range check
- you can't delete/modify history once plotted, so essentially it just sets a start point for plotting (from num_bars bars back) that works only in realtime mode (not in replay)
Levels:
You can plot current MA value using plot trackprice=true or by checking Show Price Line in Style. Problem is:
- you can only change color (not the dashed line style, width), have both ma + price line (not just the line), and it's full screen wide
- you can't set plot trackprice from input => implemented using plotshape/plotchar with fixed text labels serving as levels
- there's no other way of creating a dynamic level: hline, plot, offset - nothing else works.
- you can't plot a text var - all text strings must be constants, so you can't change the style, width and text labels without recompiling.
- from input you can only adjust offset, indent and shift for each level group, and change color
- the dot below each level line is the exact MA value. If you want just the line swap plotshape with plotchar, recompile and save as your private version, adjust Y shift.
To speed up redraw times: reduce last_bars to ~2000, recompile and use as your own private version
Pinescript is a rudimentary language (should be called Painscript instead) that can basically only plot data. You can't do much else. Please see the code for tips and hints.
Certain things just can't be done or require shady workarounds and weeks of testing trying to resolve weird node.js compiler errors.
Feel free to learn from/reuse/change the code as needed and use as your own private version. See comments in code. Good Luck!

Volume Delta Candles 5TF + MTF Candles [SYNC & TRADE]Volume Delta Candles 5TF + MTF Candles Script Description (English)
Purpose
The Volume Delta Candles 5TF + MTF Candles script is an analytical tool for traders leveraging volume delta and multi-timeframe (MTF) analysis. It visualizes volume delta (the difference between buying and selling volumes) across five timeframes, aiding in the identification of manipulations, strong market impulses, and trend signals.
Additionally, it overlays higher timeframe candles on the current chart, providing context for decision-making.
The indicator is ideal for traders focusing on volume, manipulation analysis, or trend-following strategies. Its uniqueness lies in its detailed five-timeframe delta analysis, automated timeframe selection, and customizable settings.
Volume Delta Analysis
Volume delta is the core metric of the script, representing the difference between buying and selling volumes over a given period. It is divided into five levels, each corresponding to one of the five timeframes, enabling traders to observe how market activity varies across temporal scales. The primary delta is automatically adjusted based on the selected chart timeframe, ensuring relevance.
Timeframe Selection
Primary Timeframes: Automatically determined based on the chart, including monthly, weekly, daily, 4-hour, and hourly periods. These cover long- and medium-term trends, providing a robust context.
Lower Timeframes: Optimized to capture significant short-term movements. These are shorter than primary timeframes and focus on market micro-activity, such as manipulations or impulses.
Five Timeframe Interconnection
The five timeframes provide a comprehensive analysis by balancing granularity and context. Each timeframe evaluates volume delta, creating a layered perspective:
Short Timeframes: Capture immediate changes in activity (e.g., buying or selling spikes).
Long Timeframes: Assess the sustainability of movements, filtering out short-term noise. Delta for each timeframe is displayed as a separate candle, with color and size reflecting its magnitude and direction. This allows traders to compare short-term actions against broader trends.
Delta’s Impact on Candles
Volume delta directly influences candle visualization, reflecting market dynamics. Splitting delta into five parts (one per timeframe) makes the analysis intuitive. Key scenarios include:
Small Delta on Lower Timeframe, Large on Higher:
Description: A low timeframe shows minimal delta (e.g., slight buying/selling difference), while a higher timeframe shows significant delta (e.g., strong buying dominance).
Interpretation: Suggests large players accumulating positions on the higher timeframe, masked by low activity on the lower. Traders may enter in the direction of the higher trend.
Visualization: The lower timeframe candle is narrow and faint, while the higher timeframe candle is wide and vibrant (blue for positive delta, red for negative).
Large Delta on Lower Timeframe, Small on Higher:
Description: A low timeframe exhibits strong delta (e.g., a selling surge), but the higher timeframe shows weak activity.
Interpretation: Indicates a short-term impulse or manipulation unsupported by the broader trend. Traders should be cautious, as the move may be false.
Visualization: The lower timeframe candle is bright and wide, while the higher timeframe candle is faint and narrow.
Reverse Delta:
Description: A lower timeframe shows positive delta (buying dominance), while a higher timeframe shows negative delta (selling dominance), or vice versa.
Interpretation: Suggests potential manipulation or reversal. For example, short-term buying may be absorbed by selling on a higher timeframe, signaling bearish weakness.
Visualization: Candles on different timeframes have opposing colors (e.g., blue on lower, red on higher).
Deltas in Both Directions:
Description: Delta alternates between positive and negative across timeframes without clear dominance.
Interpretation: Reflects market indecision or consolidation. Traders should wait for clearer signals or use additional indicators.
Visualization: Candles across timeframes show mixed colors and sizes, creating a “scattered” pattern.
Empty Candles (Void):
Description: Delta on one or more timeframes is near zero despite price movement.
Interpretation: Indicates false movement or lack of market interest, often tied to manipulations like false breakouts.
Visualization: Marked with a diamond (void manipulation), with the candle appearing minimal and faint.
Utility
Detailed Delta Analysis: Five delta levels reveal market activity from micro- to macro-levels.
Manipulation Detection: Highlights candles with price-delta divergence, aiding in spotting false moves.
Strong Candles: Marks impulsive moves with high delta and volume.
MTF Analysis: Displays higher timeframe candles, simplifying trend and key level analysis.
Versatility: Sensitivity settings make it suitable for stocks, forex, crypto, and all timeframes.
How to Use
Adding to Chart:
Open TradingView and select an asset.
Find “Volume Delta Candles 5TF + MTF Candles ” in the “Indicators” menu.
Confirm access (invite-only script).
Interpreting Signals:
Delta Candles: Colored by delta direction (blue for positive, red for negative). Color intensity and candle size reflect delta strength across five timeframes.
Manipulations:
Triangles: Strong price-delta divergence.
Crosses: Weak divergence.
Diamonds: Void candles with minimal delta.
Strong Candles: Circles below/above candles indicate high-delta impulses.
MTF Candle: A transparent higher timeframe candle shows trend and range.
Trading Application:
Use manipulations to spot reversals or false breakouts.
Confirm impulses with strong candles and higher timeframe delta.
Analyze MTF candles for trend context.
Compare delta across all five timeframes to filter signals.
Combine with support/resistance or other indicators.
Settings
Parameters are grouped for ease of customization.
1. Labels
Show Manipulations: Display strong manipulation labels (triangles).
Show Void Manipulations: Show void manipulations (diamonds).
Show Delta Sandwich: Reserved for future updates.
Show Strong Candles: Display strong candles (circles).
2. Filters (Strong Candle Filter)
Filter Sensitivity: Filter sensitivity:
Normal: For stable markets.
Medium: For moderate volatility.
Sensitive: For high-frequency trading.
3. Delta Colors
Delta 1↑ (Main): Color for positive delta on the main timeframe.
Delta 1↓ (Main): Color for negative delta on the main timeframe.
Other timeframes use derived colors with varying opacity.
4. Timeframes
Timeframe Sensitivity: Sensitivity for lower timeframes:
Normal: Standard division.
Medium: More detailed analysis.
Sensitive: Maximum detail.
5. MTF Candle
Show MTF Candle: Display higher timeframe candle.
Bullish/Bearish Color: Colors for bullish/bearish candles.
Show High/Low: Show highs/lows.
High/Low Color: Color for high/low lines.
MTF Timeframe: Select higher timeframe (default: daily).
Описание скрипта Volume Delta Candles 5TF + MTF Candles (Русский)
Назначение
Скрипт Volume Delta Candles 5TF + MTF Candles — это аналитический инструмент для трейдеров, использующих дельту объема и анализ нескольких таймфреймов (MTF). Он визуализирует дельту объема (разницу между объемами покупок и продаж) на пяти таймфреймах, помогая выявлять манипуляции, сильные рыночные импульсы и трендовые сигналы. Дополнительно скрипт отображает свечи старшего таймфрейма на текущем графике, предоставляя контекст для принятия решений.
Индикатор подходит для трейдеров, работающих с объемами, анализом манипуляций или трендовыми стратегиями. Его уникальность заключается в детализированном анализе дельты объема на пяти таймфреймах, адаптивной автоматизации таймфреймов и гибких настройках.
Анализ дельты объема
Дельта объема — это ключевая метрика скрипта, отражающая разницу между объемами покупок и продаж за определенный период. Она разделена на пять уровней, соответствующих пяти таймфреймам, что позволяет трейдерам видеть, как рыночная активность варьируется на разных временных масштабах. Основная дельта подбирается автоматически в зависимости от выбранного таймфрейма графика, обеспечивая релевантность анализа.
Выбор таймфреймов
Основные таймфреймы: Автоматически определяются на основе текущего графика и включают месяц, неделю, день, 4 часа и час. Эти таймфреймы выбраны для охвата долгосрочных и среднесрочных трендов, обеспечивая контекст для анализа.
Нижние таймфреймы: Подбираются методом оптимизации для выявления наиболее значимых краткосрочных движений. Они короче основных таймфреймов и фокусируются на микроактивности рынка, такой как манипуляции или импульсы.
Взаимосвязь пяти таймфреймов
Пять таймфреймов обеспечивают комплексный анализ, сочетая детализацию и контекст. Каждый таймфрейм анализирует дельту объема, создавая многослойную картину:
Короткие таймфреймы: Улавливают моментальные изменения активности (например, всплеск покупок или продаж).
Длинные таймфреймы: Оценивают устойчивость движений, фильтруя шум краткосрочных колебаний. Дельта на каждом таймфрейме отображается отдельной свечой, с цветом и размером, зависящими от ее величины и направления. Это позволяет трейдерам сравнивать, как краткосрочные действия соотносятся с более широкими трендами.
Влияние дельты на свечи
Дельта объема напрямую влияет на визуализацию свечей, отражая рыночную динамику. Разделение дельты на пять частей (по одному для каждого таймфрейма) делает анализ интуитивно понятным. Рассмотрим ключевые сценарии:
Маленькая дельта на низком таймфрейме, большая на высоком:
Описание: На младшем таймфрейме дельта мала (например, незначительная разница между покупками и продажами), но на старшем таймфрейме дельта велика (например, сильный перевес покупок).
Интерпретация: Это может указывать на накопление позиций крупными игроками на старшем таймфрейме, маскируемое низкой активностью на младшем. Трейдеры могут использовать это как сигнал для входа в направлении старшего тренда.
Визуализация: Свеча младшего таймфрейма будет узкой и бледной, а свеча старшего — широкой и яркой (синяя для положительной дельты, красная для отрицательной).
Большая дельта на низком таймфрейме, маленькая на высоком:
Описание: На младшем таймфрейме наблюдается сильная дельта (например, всплеск продаж), но на старшем — слабая активность.
Интерпретация: Это может быть краткосрочным импульсом или манипуляцией, не поддерживаемой общим трендом. Трейдеры должны быть осторожны, так как движение может быть ложным.
Визуализация: Свеча младшего таймфрейма яркая и широкая, а старшего — бледная и узкая.
Обратная дельта:
Описание: Дельта на младшем таймфрейме положительная (покупки преобладают), а на старшем — отрицательная (продажи доминируют), или наоборот.
Интерпретация: Указывает на потенциальную манипуляцию или разворот. Например, краткосрочные покупки могут быть поглощены продажами на старшем таймфрейме, сигнализируя о слабости быков.
Визуализация: Свечи разных таймфреймов окрашены в противоположные цвета (например, синяя на младшем, красная на старшем).
Дельты в оба направления:
Описание: На разных таймфреймах дельта чередуется между положительной и отрицательной без явного доминирования.
Интерпретация: Отражает неопределенность или консолидацию на рынке. Трейдерам стоит дождаться более четких сигналов или использовать другие индикаторы.
Визуализация: Свечи разных таймфреймов имеют смешанные цвета и размеры, создавая «разбросанную» картину.
Пустые свечи (Void):
Описание: Дельта на одном или нескольких таймфреймах близка к нулю, несмотря на движение цены.
Интерпретация: Указывает на ложное движение или отсутствие интереса участников рынка. Это часто связано с манипуляциями, такими как ложные пробои.
Визуализация: Отмечается ромбовидной меткой (void-манипуляция), а свеча имеет минимальный размер и бледный цвет.
Полезность
Детализированный анализ дельты: Пять уровней дельты показывают, как рыночная активность варьируется от микро- до макроуровня.
Обнаружение манипуляций: Маркирует свечи с расхождением цены и дельты, помогая выявить ложные движения.
Сильные свечи: Выделяет импульсные движения с высокой дельтой и объемом.
MTF-анализ: Отображает свечи старшего таймфрейма, упрощая анализ трендов и ключевых уровней.
Универсальность: Настройки чувствительности делают скрипт подходящим для акций, форекса, криптовалют и любых таймфреймов.
Как использовать
Добавление на график:
Откройте TradingView и выберите актив.
Найдите индикатор «Volume Delta Candles 5TF + MTF Candles » в меню «Индикаторы».
Подтвердите доступ (скрипт invite-only).
Интерпретация сигналов:
Дельта-свечи: Окрашены по направлению дельты (синий — положительная, красный — отрицательная). Интенсивность цвета и размер свечи зависят от силы дельты на каждом из пяти таймфреймов.
Манипуляции:
Треугольники: Сильное расхождение цены и дельты.
Кресты: Слабое расхождение.
Ромбы: Пустые свечи (void), указывающие на минимальную дельту.
Сильные свечи: Круги под/над свечами обозначают импульсы с высокой дельтой.
MTF-свеча: Прозрачная свеча старшего таймфрейма показывает тренд и диапазон.
Применение в торговле:
Используйте манипуляции для поиска разворотов или ложных пробоев.
Подтверждайте импульсы сильными свечами и дельтой на старших таймфреймах.
Анализируйте MTF-свечи для определения трендового контекста.
Сравнивайте дельту на всех пяти таймфреймах для фильтрации сигналов.
Комбинируйте с уровнями поддержки/сопротивления или другими индикаторами.
Настройки
Параметры сгруппированы для удобства настройки.
1. Метки (Labels)
Show Manipulations: Показывать сильные манипуляции (треугольники).
Show Void Manipulations: Показывать void-манипуляции (ромбы).
Show Delta Sandwich: Зарезервировано для будущих обновлений.
Show Strong Candles: Показывать сильные свечи (круги).
2. Фильтры (Strong Candle Filter)
Filter Sensitivity: Чувствительность фильтра:
Normal: Для стабильных рынков.
Medium: Для умеренной волатильности.
Sensitive: Для высокочастотной торговли.
3. Цвета дельты (Delta Colors)
Delta 1↑ (Main): Цвет положительной дельты основного таймфрейма.
Delta 1↓ (Main): Цвет отрицательной дельты основного таймфрейма.
Остальные таймфреймы используют производные цвета с разной прозрачностью.
4. Таймфреймы (Timeframes)
Timeframe Sensitivity: Чувствительность нижних таймфреймов:
Normal: Стандартное деление.
Medium: Более детализированный анализ.
Sensitive: Максимальная детализация.
5. MTF-свеча (MTF Candle)
Show MTF Candle: Показывать свечу старшего таймфрейма.
Bullish/Bearish Color: Цвета бычьей/медвежьей свечи.
Show High/Low: Показывать максимумы/минимумы.
High/Low Color: Цвет линий максимума/минимума.
MTF Timeframe: Выбор старшего таймфрейма (по умолчанию — дневной).

Smart Gap Projection MTF Smart Gap Projection MTF
## Brief Description
Professional indicator for projecting US Dollar Index (DXY) gaps onto the traded instrument with multi-timeframe analysis support and advanced visualization.
---
## Originality and Uniqueness
**Smart Gap Projection MTF** is a unique development that solves the specific task of correlation analysis between the Dollar Index (DXY) and currency pairs, cryptocurrencies, or other dollar-dependent assets.
### What makes this indicator original:
1. **Inter-market gap projection** - the indicator doesn't just display gaps on the current instrument, but projects gaps from the DXY index onto your asset's chart, creating unique trading levels
2. **Dual confirmation system** - uses a mechanism of waiting N candles after a gap appears on DXY to filter false signals
3. **Intelligent lifecycle tracking** - each projected level is tracked until price touch or gap closure on DXY, with automatic visualization changes
4. **Multi-Timeframe extension** - ability to simultaneously display gaps from a lower timeframe of the current instrument to identify intraday opportunities
5. **Adaptive visualization (Heatmap)** - line intensity and width automatically change depending on gap size, helping to visually identify the most significant levels
---
## How the Indicator Works
### Core Operating Principle
The indicator analyzes the US Dollar Index (DXY) price movement in real-time and identifies gaps (price breaks) between candle closes and opens. When a gap forms on DXY, the indicator:
1. **Determines gap type** - bullish (price opened above previous close) or bearish (price opened below)
2. **Checks gap size** - filters insignificant gaps by absolute size (in points) and percentage value
3. **Waits for confirmation** - after detecting a gap, the indicator waits for a specified number of candles (default 3) to confirm that the gap didn't close immediately
4. **Projects the level** - after confirmation, a horizontal line is drawn on the current instrument's chart at the High level (for bullish DXY gap) or Low level (for bearish DXY gap) of the candle where the gap formed
5. **Tracks status** - the indicator continuously monitors:
- Price touching the projected level (line becomes more transparent)
- Gap closure on DXY itself (line changes color to orange)
### Conceptual Foundation
The methodology is based on the observation that:
- Gaps on the Dollar Index often lead to synchronous movements on correlated assets
- Price levels at the moment of DXY gap formation become price magnets
- Gap closure on DXY often coincides with trend reversal on dependent instruments
---
## How to Use the Indicator
### Basic Setup
1. **Add the indicator to the chart** of any asset correlated with the dollar (EUR/USD, GBP/USD, Bitcoin, Gold, etc.)
2. **Configure main parameters:**
- `DXY Symbol` - leave as "TVC:DXY" (standard Dollar Index ticker)
- `Minimum gap size` - minimum gap size in points (0.0001-0.001 for DXY)
- `Confirmation candles` - number of confirmation candles (recommended 3-5)
3. **Set up visualization:**
- Choose colors for bullish and bearish gaps
- Set desired transparency for each gap type
- Enable/disable `Use heatmap` for adaptive visualization
### Timeframe Recommendations
- **Scalping (M1-M5):** use MTF gaps from M1 timeframe, confirmationCandles = 2-3
- **Intraday (M15-H1):** standard settings, can add MTF M5-M15
- **Swing trading (H4-D1):** increase confirmationCandles to 5-10, MTF H1-H4
### Use with Other Instruments
The indicator is universal and works on:
- **Forex:** EUR/USD, GBP/USD, USD/JPY, AUD/USD and other dollar pairs
- **Cryptocurrencies:** BTC/USD, ETH/USD (direct dollar dependency)
- **Commodities:** Gold (XAU/USD), Silver (XAG/USD), Oil
- **Indices:** SPX, NDX, especially during dollar movements
---
## Configuration Parameters
### Main Settings
- **DXY Symbol** - Dollar Index symbol (default TVC:DXY)
- **Minimum gap size** - minimum gap size in points for filtering
- **Minimum gap size (%)** - minimum percentage size (0 = disabled)
- **Confirmation candles** - number of candles for confirmation (1-10)
- **Maximum gaps on chart** - maximum number of displayed projections
### Multi-Timeframe
- **Enable MTF gaps** - enable/disable MTF gaps
- **Timeframe for gaps** - select lower timeframe for search
- **Max MTF gaps** - maximum number of MTF lines (5-2000)
- **Min MTF gap size** - minimum MTF gap size
- **MTF lines color** - MTF lines color
- **MTF lines style** - line style (Solid/Dashed/Dotted)
- **MTF lines width** - MTF lines width (1-3)
### Visualization
- **Extend lines right** - extend lines to the right
- **Use heatmap** - use adaptive visualization (width/brightness from gap size)
- **Stop lines when DXY gap closes** - stop lines when gap closes on DXY
### Colors
- **Bullish gap color** - color of bullish DXY gap lines
- **Bullish Transparency** - transparency of bullish lines (0-90)
- **Bearish gap color** - color of bearish DXY gap lines
- **Bearish Transparency** - transparency of bearish lines (0-90)
- **Line style** - style of all projection lines
### Alerts
- **Alert on new gap** - notification when new gap is confirmed
---
## Features and Advantages
✅ **Inter-market analysis** - uses correlation between DXY and traded asset
✅ **Automatic filtering** - excludes insignificant and quickly closing gaps
✅ **Multi-timeframe analysis** - combines signals from different time periods
✅ **Visual hierarchy** - heatmap automatically highlights most significant levels
✅ **Lifecycle tracking** - each level is monitored until touch or gap closure
✅ **Universality** - works on any dollar-correlated assets
✅ **Non-repainting** - all levels are fixed historically and don't change
✅ **Customizable visualization** - full control over colors, styles and transparency
---
## Limitations and Important Notes
⚠️ **Indicator is not a trading system** - it's a technical analysis tool requiring confirmation by other methods
⚠️ **Works only on assets correlated with DXY** - on instruments without dollar correlation, signals will be ineffective
⚠️ **Requires understanding of inter-market relationships** - recommended to study correlations between DXY and your instrument
⚠️ **DXY data quality** - ensure your data provider supplies correct TVC:DXY history
⚠️ **MTF data** - when using very low MTF timeframes, delays in updates are possible
---
## Who This Indicator Is For
👨💼 **Forex traders** - analyzing macroeconomic dollar movements
📈 **Crypto traders** - considering dollar influence on Bitcoin and altcoins
🥇 **Commodity market traders** - trading gold, silver, oil
📊 **Intraday scalpers** - using MTF for precise entries
📉 **Swing traders** - looking for medium-term entry points at key levels
---
## Disclaimer
This indicator is intended solely for educational and informational purposes. It is not financial advice or a recommendation to act. All trading decisions you make at your own risk. Past results do not guarantee future performance. Always use proper risk management.

Multiple MA with Multi-Display Mode(MTF/Non MTF)Japanese below / 日本語説明は下記
This indicator shows 6MA(SMA or EMA) with 3 different display modes, which are MTF, Non-MTF and Display on Specific Timeframe.
1. MTF mode
2. Non MTF Mode(Display always)
3. Display on specific timeframe
1. MTF mode
MA becomes MTF MA, meaning that a MA is displayed on the timeframe that users select as MTF MA timeframe or lower timeframe.
i.e. If you select Daily timeframe from MTF MA timeframe, MA will be displayed on daily or lower timeframe; daily, 4 hour, 1 hour, 30mins, 15min, 5mins, 1min.
Note: You need to select "MTF MA timeframe" on input screen.
Sample chart
(left: 1 hour, middle: 4 hour, right: Daily, MA setting; 50MA of 4hour chart)
2. Non MTF Mode(Display always)
MA will always be displayed regardless of timeframe that users open.
Note: If you select Non MTF Mode, MTF MA timeframe on input screen is ignored.
3. Display on specific timeframe
When you select this mode, MA will be displayed only on the specific timeframe that you select from “MTF timeframe or Display timeframe” on the input screen.
If you would like an MA to be displayed only on specific timeframe, this would be your choice.(for example, MA on 1 hour chart only)
Sample chart
(left: 1 hour, middle: 4 hour, right: Daily, MA setting; 50MA of 4hour chart)
How to use this indicator?
This indicator is paid indicator and invited-only indicator.
Please contact me via private chat or follow links in my signature so that I can grant the access right to the indicator.
Comment section is only for comments on the indicator or updates. Please refrain from contacting me using comments to follow TradingView house rules.
————————
6本の移動平均線(MA)を異なる3つのモードで表示できるインジケーターです。(SMAかEMAの選択可)
モード1: MTFモード
モード2: Non-MTFモード(常に表示)
モード3: 特定のタイムフレームのみに表示
1. MTFモード
この表示モードを選択すると、上位足のMAを下位足に表示するMAとなります。
選択した上位足のタイムフレーム(時間軸)と、それ以下のタイムフレームにのみMAが表示されます。
例: 上位足のタイムフレームとして日足を選択した場合、MAは日足、4時間足、1時間足、30分足、15分足、5分足、1分足に表示されます。
サンプルチャート
(左: 1時間足, 中央:4時間足, 右:日足, MA設定: 4時間足の50MA)
2. Non-MTFモード(常に表示)
MAはユーザーの開いているチャートのタイムフレームに関係なく常に表示されます。
一般的な移動平均線と同じ挙動です。
3. 特定のタイムフレームのみに表示
このモードでは移動平均線は指定した特定のタイムフレームにのみ表示されます。
例えば期間50の移動平均線を15分足チャートにだけ表示させたいような要件がある場合、このモードが最適です。
サンプルチャート
(左: 1時間足, 中央:4時間足, 右:日足, MA設定: 4時間足の50MA)
インジケーターの使用について
当インジケーターは招待制インジケーター(有料)となっています。
使用を希望される方はプライベートチャットや下記リンクのDMでご連絡ください。
このページのコメント欄はインジケーターそのものに対するコメントやアップデートの記載のためのものとなっております。Tradingviewのハウスルールを守るためにもコメント欄からの連絡はご遠慮ください。

Multi-Function Stochastic(MTF, divergence, signal and alert)Japanese below / 日本語説明は下記
Overview
Multi-function Stochastic indicator with functions below.
1.MTF with display timeframe control
2.Auto divergence drawing incl. hidden divergence
3.Signal when % K crosses over %D incl. MTF %K and %D
4.Alert when % K crosses over %D
Please see the details below.
Functions:
1.MTF with display timeframe control
You can select one upper timeframe from monthly, weekly, daily, 4hour, 1hour, 30mins, 15mins, 5mins to display upper timeframe’s Stochastic as MTF Stochastic.
How is it different from other MTF indicators?
Problems with other MTF Stochastic indicators are;
-If you set higher timeframe Stochastic, it will also be shown on further higher time frames.
i.e. If you set 4hour chart’s Stochastic on 1 hour or lower time frame charts, it will also appear on daily and weekly chart, which is not necessary.
To tackle these problems, this indicator has incorporated functions below.
-To show MTF Stochastic on timeframe lower than the upper timeframe you set as MTF timeframe.
For example, if you select daily timeframe for MTF Stochastic , the Stochastic will be shown only on 4 hour or lower timeframes(1H, 30M, 15M, 5M, 1M).
Left: 4hour chart, Middle: Daily chart, Right: Weekly chart
If you look at 4hour chart, daily chart’s Stochastic is shown(pale blue and orange) but weekly chart does not show daily chart’s Stochastic.
2.Auto divergence drawing incl. hidden divergence
Divergence line and hidden divergence line will be automatically drawn for the current timeframe Stochastic as per the logic below.
Bearish : When two consecutive pivot highs go up but %K values corresponding to each high go down.
Bullish: When two consecutive pivot lows go down but %K values corresponding to each low go up.
Pivot highs(lows) are identified when those are preceded by n lower highs(lows) and proceeded by n lower highs(lows).
* n is parameterized.
See the diagram below.
Bearish : When two consecutive pivot highs go down but %K values corresponding to each highs go up.
Bullish : When two consecutive pivot lows go up but %K values corresponding to each low go down.
3.Signal when % K crossing %D
Signal will be shown when;
-%K crosses over %D below lower band
-%K crosses under %D above upper band
-%K(MTF) crosses over %D(MTF) below lower band
-%K(MTF) crosses under %D(MTF) above upper band
4.Alert when % K crossing %D
Alert can be set when;
-%K crosses over %D below lower band
-%K crosses under %D above upper band
How to use this indicator?
This indicator is paid indicator and invited-only indicator.
Please contact me via private chat or follow links in my signature so that I can grant the access right to the indicator.
Comment section is only for comments on the indicator or updates. Please refrain from contacting me using comments to follow TradingView house rules.
———————————————————————————————————————
多機能ストキャスティクスインジケーターです。以下の機能が搭載されています。
1.マルチタイムフレーム機能(表示時間足制御機能付き)
2.ダイバージェンス自動描画機能(ヒドゥンダイバージェンス対応)
3.%Kが%Dをクロスした時にシグナル表示(MTFの%Kと%Dでも同様)
4.%Kが%Dをクロスした時にアラート設定可能
機能詳細は以下の通りです。
機能詳細
1.マルチタイムフレーム機能(表示時間軸制御機能付き)
月足、週足、日足、4時間足、1時間足、30分足、15分足、5分足の中から一つを選択し、上位足のストキャスティクスとして表示することができます。(不要な場合は非表示可能)
他のマルチタイムフレームストキャスティクスとの違い
他のマルチタイムフレームストキャスティクスのインジケーターでは、以下の問題に直面します。
・上位足のストキャスティクスを表示すると、さらに上位足でもそのストキャスティクスが表示され見にくくなる。
例: 4時間足のストキャスティクスを下位足で表示可能な様に設定すると、日足や週足でも表示され、チャートが見にくくなる。
この問題に対して、このインジケーターでは、
・上位足のストキャスティクスを表示する時間軸を制御することで上位足で不必要な情報を表示させない。
という機能を加えることでこの問題を解決しています。
具体的には、マルチタイムフレーム用に選択した上位足のタイムフレームより小さいタイムフレームでのみ上位足のストキャスティクスが表示されるようになっています。
例えば、上位足として日足を選択した場合、日足のストキャスティクスは4時間足、1時間足、30分足、15分足、5分足、1分足にのみ表示されます。
<サンプルチャート>
左から4時間足、日足、週足です。
4時間足では日足のストキャスティクスが表示されていますが、週足には表示されません。
2.ダイバージェンス自動描画機能(ヒドゥンダイバージェンス対応)
以下のロジックに基づきダイバージェンスを自動描画します。(不要な場合は非表示可能)
<通常のダイバージェンス>
下降示唆: 2つの連続する高値(*)が切り上げられているが、 それぞれの高値に対応するストキャスティクスの値は切り下げている場合
上昇示唆: 2つの連続する安値(*)が切り下がっているが、 それぞれの安値に対応するストキャスティクスの値は切り上がっている場合
*高値(安値)は、左右n本(**)ずつのローソク足の高値(安値)より高い(低い)高値(安値)をピボットハイ・ローとして算出しています。
** nはユーザ設定値です。
<例: ダイバージェンス>
高値SH1はSH1のローソクの高値より左側にn個のより低い高値、右側にn個のより低い高値があった場合に高値として認識されます。
上記の例では高値がSH1>SH2と切り上がっていますが、対応する%Kの値はvalue2>value1と切り下がっているためダイバージェンスと認識されダイバージェンスラインが自動描画されます。
<ヒドゥンダイバージェンス>
下降継続示唆: 2つの連続する高値(*)が切り下がっているが、 それぞれの高値に対応するストキャスティクスの値は切り上がっている場合
上昇継続示唆: 2つの連続する安値(*)が切り上がっているが、 それぞれの安値に対応するストキャスティクスの値は切り下がっている場合
言うまでもないことですが、ダイバージェンスが出たから逆張り、などの安易な発想は避けるべきです。
環境認識の一つの要素として見るべき指標でしょう。
3.%Kが%Dとクロスした時にシグナル表示(MTFの%Kと%Dでも同様)
以下の条件を満たした時にシグナルを表示します。
-ロワーバンドより下で、%Kが%Dを上抜けた時
-アッパーバンドより上で、%Kが%Dを下抜けた時
-ロワーバンドより下で、%K(MTF)が%D(MTF)を上抜けた時
-アッパーバンドより上で、%K(MTF)が%D(MTF)を下抜けた時
4.%Kが%Dとクロスした時にアラート設定
以下の条件でアラート設定が可能です。
-ロワーバンドより下で、%Kが%Dを上抜けた時
-アッパーバンドより上で、%Kが%Dを下抜けた時
インジケーターの使用について
当インジケーターは招待制インジケーター(有料)となっています。
使用を希望される方はプライベートチャットや下記リンクのDMでご連絡ください。
このページのコメント欄はインジケーターそのものに対するコメントやアップデートの記載のためのものとなっております。Tradingviewのハウスルールを守るためにもコメント欄からの連絡はご遠慮ください。

TradeChartist Essential MTF Screener™TradeChartist Essential MTF Screener is an adaptive and powerful multi time frame screener toolkit for several essential trading indicators like RSI, Stochastic, CCI, MACD, 15 different Moving Averages, Heikin Ashi Trend and Net Volume, which can be visualised as a singular Indicator plot or as MTF Screener blocks showing absolute or trend-based colour coded Bull/Bear Strength along with real-time indicator value labels.
===================================================================================================================
™𝗧𝗿𝗮𝗱𝗲𝗖𝗵𝗮𝗿𝘁𝗶𝘀𝘁 𝗘𝘀𝘀𝗲𝗻𝘁𝗶𝗮𝗹 𝗠𝗧𝗙 𝗦𝗰𝗿𝗲𝗲𝗻𝗲𝗿 𝗨𝘀𝗲𝗿 𝗠𝗮𝗻𝘂𝗮𝗹
====================================================
MTF Screener can be used as a singular Time Frame screener plot or as colour coded screener blocks with several Time Frames (based on Time Frame Multiplier inputs) and based on user preference of the indicator such as RSI, Stoch, CCI, MACD, one of 15 Moving Averages, Heikin Ashi Trend or Net Volume from the 𝐈𝐧𝐝𝐢𝐜𝐚𝐭𝐨𝐫 𝐓𝐲𝐩𝐞 dropdown.
For RSI, Stoch, MACD and Moving Averages, Source price is required from the Sᴏᴜʀᴄᴇ dropdown (default - close). Sᴍᴏᴏᴛʜɪɴɢ input can be used to smooth the plot.
RSI, CCI and Stoch lengths are 14 as default and each of them have Uᴘᴘᴇʀ Bᴀɴᴅ and Lᴏᴡᴇʀ Bᴀɴᴅ inputs, which decides the colour of the screener block.
MACD has 3 inputs namely - Fᴀsᴛ Lᴇɴɢᴛʜ , Sʟᴏᴡ Lᴇɴɢᴛʜ and Sᴍᴏᴏᴛʜɪɴɢ and the default is the classic settings (12,26,9). Type of MA used can be chosen from under 𝟰. 𝗠𝗼𝘃𝗶𝗻𝗴 𝗔𝘃𝗲𝗿𝗮𝗴𝗲 section of the indicator settings. For classic MACD, use EMA which is default.
Moving Average has two inputs namely - MA ᴛʏᴘᴇ (which allows one of 15 Moving Averages) and MA Lᴇɴɢᴛʜ (default - 55).
Heikin Ashi Trend and Net Volume do not need any inputs.
===================================================================================================================
𝗠𝗧𝗙 𝗦𝗰𝗿𝗲𝗲𝗻𝗲𝗿 𝗕𝗹𝗼𝗰𝗸𝘀
Screener blocks are plotted as default and each row represents a specific Time Frame based on the Time Frame Multiplier (Default - 11 TF Multipliers from 1 to 2 in steps of 0.1) entered by the user in the 𝗦𝗰𝗿𝗲𝗲𝗻𝗲𝗿 𝗣𝗹𝗼𝘁𝘀 section. There are 11 maximum rows or Time Frame Multipliers that can be displayed. For example, if the user wants just 4 timeframes say, 1hr, 2hr , 4hr and Daily on a 1hr chart, the user should enter 4 in 𝐍𝐮𝐦𝐛𝐞𝐫 𝐨𝐟 𝐌𝐓𝐅 𝐒𝐜𝐫𝐞𝐞𝐧𝐞𝐫𝐬 input box and enter 1, 2, 4 and 24 in the Time-Frame Multiplier input boxes.
The Screener block colour can be changed from the settings. Each Screener row will have the data labels displayed in real-time as default ( Aʟʟᴏᴡ Rᴇᴘᴀɪɴᴛɪɴɢ (Cᴜʀʀᴇɴᴛ HTF Dᴀᴛᴀ) ). Disabling this will have Higher Time Frame data lag based on previous HTF close. Real-time data is recommended for live prices/data as it helps see the current dynamic.
Hᴇɪᴋɪɴ Asʜɪ Sᴄʀᴇᴇɴᴇʀ plots data based on Heikin Ashi chart on normal candle/bar chart.
Tʀᴇɴᴅ Bᴀsᴇᴅ Sᴄʀᴇᴇɴᴇʀ (ʀsɪ, sᴛᴏᴄʜ, ᴄᴄɪ) plots color coded screener blocks based on Upper and Lower bands input from the user. The colors change only when the upper/lower band is breached for the first time since the opposite band breach.
The MTF Screener blocks can be used visually on price chart by just moving the MTF Screener to main chart with the default Separate Screener Pane - Default under Lᴀʙᴇʟs Dɪsᴘʟᴀʏ Tʏᴘᴇ to keep the labels on chart. Having separate scales for security price and MTF Screener makes it possible to view the screener blocks on main chart.
Screener overlaid on Price Chart disables the MTF screener blocks but shows the MTF labels on price chart.
MTF Screener block colours can be changed from Screener Blocks colour settings and the Screener Label colour can be changed from Screener Label Colour settings.
===================================================================================================================
𝗦𝗰𝗿𝗲𝗲𝗻𝗲𝗿 𝗜𝗻𝗱𝗶𝗰𝗮𝘁𝗼𝗿 𝗣𝗹𝗼𝘁
Screener Indicator Plot is a singular plot of the user preferred timeframe multiplier (entered in Iɴᴅɪᴄᴀᴛᴏʀ Pʟᴏᴛ Tɪᴍᴇғʀᴀᴍᴇ Mᴜʟᴛɪᴘʟɪᴇʀ input box) of the Essential Indicator selected by the user.
To display the indicator plot, enable Dɪsᴘʟᴀʏ Iɴᴅɪᴄᴀᴛᴏʀ Pʟᴏᴛ (ᴅɪsᴀʙʟᴇs sᴄʀᴇᴇɴᴇʀ) . For example, if the selected plot is RSI, this displays RSI of the chosen Time Frame Multiplier along with the MTF Screener Labels without the blocks.
Screener Indicator Plot colours can be changed from Indicator/Screener Label colour settings and the Label colour can be changed from Lᴀʙᴇʟ Cᴏʟᴏᴜʀ (ғᴏʀ ɪɴᴅɪᴄᴀᴛᴏʀ ᴘʟᴏᴛ) .
The example chart below shows the use of both MTF Screener Blocks and Screener Indicator Plots of various essential indicators.
===================================================================================================================
Note: ™TradeChartist Essential MTF Screener is not a Signal generator and doesnt always reflect the trend when using MTF Screener blocks. Using relatively higher Time Frame Multipliers can cause late trade entries on chart time frame. The Screener and labels help visualize the values and the relative trend where sensible using colour codes. Users must devise personal techniques to exploit and use this tool to suit their trading needs.
===================================================================================================================
Example Charts
1. BTC-USDT 1hr chart using multiple MTF Screeners
2. BTC-USDT 1hr chart using Net Volume Indicator Plot and MACD MTF Screener on chart.
3. BTC-USDT 4hr chart using Daily Heikin Ashi Trend plotted on the main chart + Daily RSI indicator plot on a separate MTF Screener pane connected to ™TradeChartist Plotter to display Divergences on Price chart.
4. BTC-USDT 4 hr chart as above example, connected to ™TradeChartist FibMaster to plot Auto Fibs and display Bull/Bear Zones based on RSI 60/40 breakout trends.
5. BTC-USDT 4 hr chart with 20 period Weekly Hull MA plotted on Main chart with 4hr, Daily and 3D 20 period Hull MA value labels with Daily MACD Indicator Plot with 1hr, 4hr and 12 hr MACD real-time value labels.
===================================================================================================================
Best Practice: Test with different settings first using Paper Trades before trading with real money
===================================================================================================================
This is not a free to use indicator. Get in touch with me (PM me directly if you would like trial access to test the indicator)
Premium Scripts - Trial access and Information
Trial access offered on all Premium scripts.
PM me directly to request trial access to the scripts or for more information.
===================================================================================================================

Simple Breakout Zones MTFSimple Breakout Zones MTF
Overview
The "Simple Breakout Zones MTF" indicator is designed to help traders identify key breakout and rejection zones using multi-timeframe (MTF) analysis. By calculating high and low zones based on both close and high/low data, this indicator provides a comprehensive view of market movements. It is ideal for traders looking to spot potential trend reversals, breakouts, or rejections with added flexibility through MTF support and customizable tolerance modes.
Key Features
Multi-Timeframe (MTF) Support: Analyze data from different timeframes for both Close Mode and HL (High/Low) Mode to gain a broader market perspective.
Tolerance Modes: Choose from three tolerance options—ATR, Percent, or Fixed—to adjust the sensitivity of breakout and rejection signals.
Zone Visualization: Easily identify high and low zones with filled areas, making it simple to spot potential breakout or rejection levels.
Breakout and Rejection Detection: Detects breakouts and rejections for both Close and HL modes, with specific conditions to ensure accurate signals.
Custom Alerts: Set up alerts for various scenarios, including when both modes agree on a breakout or rejection, or when only one mode triggers a signal.
Multi-Timeframe (MTF) and Higher Timeframe (HTF) Utility
The Multi-Timeframe (MTF) and Higher Timeframe (HTF) modes are powerful features that significantly enhance the indicator’s versatility and effectiveness. By enabling MTF/HTF analysis, traders can integrate data from multiple timeframes—such as daily, weekly, or monthly—into a single chart, regardless of the timeframe they are currently viewing. This capability is invaluable for understanding the bigger picture of market behavior. For instance, a trader working on a 15-minute chart can leverage HTF data from a daily chart to identify overarching trends, critical support and resistance levels, or potential reversal zones that would otherwise remain hidden on shorter timeframes. This multi-layered perspective is especially beneficial for swing traders, position traders, or anyone employing strategies that require alignment with longer-term market movements.
Additionally, the MTF/HTF functionality allows traders to filter out noise and false signals often present in lower timeframes. For example, a breakout signal on a 1-hour chart gains greater significance when confirmed by HTF analysis showing a similar breakout on a 4-hour or daily timeframe. This confluence increases confidence in trade setups and reduces the likelihood of acting on fleeting market fluctuations. Whether used to spot macro trends, validate trade entries, or time exits with precision, the MTF/HTF modes make this indicator a robust tool for adapting to various trading styles and market conditions.
Non-Repainting Indicator
A standout advantage of this indicator is its non-repainting nature, which applies fully to the MTF and HTF modes. Unlike repainting indicators that retroactively alter their signals, this indicator locks in its calculated levels and zones once a bar closes on the chosen timeframe—whether it’s the current chart’s timeframe or a higher one selected via MTF/HTF settings. This reliability is critical for traders who depend on consistent historical data for strategy development and backtesting. For example, a support zone identified on a daily timeframe using HTF mode will remain unchanged in the past, present, and future, ensuring that what you see in a backtest mirrors what you would have experienced in real-time trading. This non-repainting feature fosters trust in the indicator’s signals, making it a dependable choice for both discretionary and systematic traders seeking accurate, reproducible results.
How It Works
The indicator calculates the highest and lowest values over a specified period (length) for both close prices (Close Mode) and high/low prices (HL Mode). These calculations can be performed on the current timeframe or a higher timeframe using MTF settings. The high and low zones are created by taking the maximum and minimum of the Close and HL levels, respectively.
Breakouts: A breakout occurs when the price closes beyond the calculated levels for both modes or just one, depending on the alert condition.
Rejections: A rejection is detected when the price touches the zone but fails to close beyond it, indicating potential resistance or support.
Tolerance is applied to the rejection logic to account for minor price fluctuations and can be customized using ATR, a percentage of the price, or a fixed value.
Usage Instructions
1. Input Settings
Use MTF for Close Mode?: Enable this option to analyze Close Mode data from a higher timeframe. When enabled, the indicator will use the specified 'Close Mode Timeframe' for calculations.
Close Mode Timeframe: Select the timeframe for Close Mode analysis (e.g., 'D' for daily). This allows you to incorporate longer-term close price data into your analysis.
Use MTF for HL Mode?: Enable this option to analyze HL (High/Low) Mode data from a higher timeframe. When enabled, the indicator will use the specified 'HL Mode Timeframe' for calculations.
HL Mode Timeframe: Select the timeframe for HL Mode analysis. This enables you to consider longer-term high and low price levels.
Source: Choose the data source for calculations (default is 'close').
Length: Set the lookback period for calculating the highest and lowest values.
Tolerance Mode: Select how tolerance is calculated—'ATR', 'Percent', or 'Fixed'.
ATR Length: Set the ATR period if using ATR tolerance.
ATR Multiplier: Adjust the multiplier for ATR-based tolerance.
Tolerance % of Price: Set the percentage for Percent tolerance.
Fixed Tolerance (Points): Set a fixed tolerance value in points.
2. Visual Elements
High Zone: A filled area (aqua) between the highest levels of Close Max and HL Max.
Low Zone: A filled area (orange) between the lowest levels of Close Min and HL Min.
Close Max/Min: Green and red crosses indicating the highest and lowest close prices over the specified length.
HL Max/Min: Green and red crosses indicating the highest high and lowest low prices over the specified length.
3. Alerts
The indicator provides several alert conditions to notify you of potential trading opportunities:
Both Modes New High: Triggers when both Close and HL modes agree on a new high, indicating a strong breakout signal upward.
Both Modes New Low: Triggers when both modes agree on a new low, indicating a strong breakout signal downward.
Both Modes Rejection: Triggers when both modes agree on a rejection, suggesting strong resistance or support.
Close Mode New High: Triggers when only Close Mode indicates a new high, useful for early breakout signals upward.
Close Mode New Low: Triggers when only Close Mode indicates a new low, useful for early breakout signals downward.
Weak Rejection Up: Triggers when only one mode indicates a rejection upward, signaling a weaker but noteworthy resistance.
Weak Rejection Down: Triggers when only one mode indicates a rejection downward, signaling a weaker but noteworthy support.
Why Use This Indicator?
Enhanced Market Insight: Combining data from multiple timeframes and modes provides a more complete picture of market dynamics.
Customizable Sensitivity: Adjust tolerance settings to fine-tune the indicator for different market conditions or trading styles.
Clear Visual Cues: Filled zones and plotted levels make it easy to spot key areas of interest on the chart.
Versatile Alerts: Tailor alerts to capture both strong and subtle market movements, ensuring you never miss a potential opportunity.
Reliable Signals: The non-repainting nature of the indicator ensures that the signals and zones are consistent and trustworthy, both in backtesting and live trading.
Luxy VWAP Magic - MTF Projection EngineThis indicator transforms the classic VWAP into a comprehensive trading system. Instead of switching between multiple indicators, you get everything in one place: multi-timeframe analysis, statistical bands, momentum detection, volume profiling, session tracking, and divergence signals.
What Makes This Different
Traditional VWAP indicators show a single line. This tool treats VWAP as a foundation for complete market analysis. The indicator automatically detects your asset type (stocks, crypto, forex, futures) and adjusts its behavior accordingly. Crypto traders get 24/7 session tracking. Stock traders get proper market hours handling. Everyone gets institutional-grade analytics.
Anchor Period Options
The anchor period determines when VWAP resets and recalculates. You have three categories of options:
Time-Based Anchors:
Session - Resets at market open. Best for intraday stock trading where you want fresh VWAP each day.
Day - Resets at midnight UTC. Standard option for most traders.
Week / Month / Quarter / Year - Longer reset periods for swing traders and position traders who want broader context.
Rolling Window Anchors:
Rolling 5D - A sliding 5-day window that never resets. Solves the Monday problem where weekly VWAP equals daily VWAP on first day of week.
Rolling 21D - Approximately one month of trading data in continuous calculation. Excellent for crypto and forex markets that trade 24/7 without clear session breaks.
Event-Based Anchors:
Dividends - Resets on ex-dividend dates. Track institutional cost basis from dividend events.
Splits - Resets on stock split dates. Useful for analyzing post-split trading behavior.
Earnings - Resets on earnings report dates. See where volume-weighted trading occurred since last quarterly report.
Standard Deviation Bands
Three sets of bands surround the main VWAP line:
Band 1 (Aqua) - Plus and minus one standard deviation. Approximately 68% of price action occurs within this range under normal distribution. Touches suggest minor extension.
Band 2 (Fuchsia) - Plus and minus two standard deviations. Only 5% of trading should occur outside this range statistically. Touches here indicate significant overextension and high probability of mean reversion.
Band 3 (Purple) - Plus and minus three standard deviations. Touches are rare (0.3% probability) and represent extreme conditions. Often marks climax moves or panic selling/buying.
Each band can be toggled independently. Most traders show Band 1 by default and add Band 2 and 3 for specific setups or volatile instruments.
Multi-Timeframe VWAP System
The MTF section plots previous period VWAPs as horizontal support and resistance levels:
Daily VWAP - Previous day's final VWAP value. Key intraday reference level.
Weekly VWAP - Previous week's final VWAP. Important for swing traders.
Monthly VWAP - Previous month's final VWAP. Institutional benchmark level.
Quarterly VWAP - Previous quarter's final VWAP. Major support/resistance for position traders.
Previous Day VWAP - Yesterday's closing VWAP specifically, separate from current daily calculation.
The Confluence Zone percentage setting determines how close multiple VWAPs must be to trigger a confluence alert. When two or more timeframe VWAPs converge within this threshold, you get a high-probability support/resistance zone.
Session VWAPs for Global Markets
For forex, crypto, and futures traders who operate in 24/7 markets, the indicator tracks three major global sessions:
Asia Session - UTC 21:00 to 08:00. Gold colored line. Typically lower volatility, range-bound action that sets overnight levels.
London Session - UTC 08:00 to 17:00. Orange colored line. Often determines daily direction with high volume European participation.
New York Session - UTC 13:00 to 22:00. Blue colored line. Highest volume session globally. Sharp directional moves common.
Previous session VWAP values display as horizontal lines when each session closes, acting as intraday support and resistance. The table shows which sessions are currently active with checkmarks.
On-Chart Labels and Signals
The indicator plots several types of labels directly on price action when significant events occur:
Volume Spike Labels
Fire when current bar volume exceeds configurable thresholds relative to both the previous bar and the 20-bar average. Default settings require 300% of previous bar AND 200% of average volume. Green labels indicate bullish candles. Red labels indicate bearish candles. These spikes often mark institutional entry points.
Momentum Shift Labels
Appear when VWAP acceleration changes direction. The Slowing label warns when an active trend loses steam, often preceding reversal. The Accelerating label confirms trend continuation or potential bottom during downtrends. Filters available to show only reversal signals in existing trends.
VWAP Squeeze Labels
Detect when standard deviation bands contract relative to ATR (Average True Range). Low volatility compression often precedes explosive breakout moves. When the squeeze fires (releases), a label appears with directional prediction based on VWAP slope.
Divergence Labels
Mark price/volume divergences using CVD (Cumulative Volume Delta) analysis:
Bullish divergence: Price makes lower low, but CVD makes higher low. Hidden accumulation despite price weakness.
Bearish divergence: Price makes higher high, but CVD makes lower high. Hidden distribution despite price strength.
Dynamic VWAP Coloring
The main VWAP line changes color based on its slope direction:
Green - VWAP is rising. Institutional buying pressure. Volume-weighted price increasing.
Red - VWAP is falling. Institutional selling pressure. Volume-weighted price decreasing.
Gray - VWAP is flat. Consolidation or balance between buyers and sellers.
This coloring can be disabled for a static blue line if you prefer cleaner visuals. The VWAP label next to the line shows the current trend direction and delta percentage.
Calculated Projection Cone
One of the most powerful features is the Calculated Projection Cone. Unlike traditional extrapolation methods that simply extend a trend line forward, this system analyzes what actually happened in similar market conditions throughout the chart's history.
How It Works:
The system classifies each bar into one of 27 unique market states:
Z-Score Level - LOW (oversold), MID (fair value), or HIGH (overbought) based on configurable thresholds
Trend Direction - DOWN, FLAT, or UP based on VWAP slope
Volume Profile - LOW (below 80%), NORMAL (80-150%), or HIGH (above 150%) relative volume
When you look at the current bar, the indicator:
1. Identifies the current market state (e.g., LOW Z-Score + UP Trend + HIGH Volume)
2. Searches through all historical bars on the chart that had the same state
3. Calculates what happened in those bars X bars later (where X is your projection horizon)
4. Shows you the probability of up/down and the average move size
Visual Elements:
Probability Cone - Colored green (bullish probability above 55%), red (bearish below 45%), or gold (neutral). The cone width represents the historical range of outcomes (roughly the 20th to 80th percentile).
Center Line - Shows the average expected price based on historical outcomes in similar conditions.
Probability Label - Displays direction probability and average move. Example: "67% UP (+0.8%)" means 67% of similar past cases moved up, averaging 0.8% gain.
Fallback System:
When the exact 27-state match has insufficient historical data:
First fallback: Uses Z-Score plus Trend only (9 broader states, ignoring volume)
Second fallback: Uses Z-Score only (3 states)
When fallback is active, confidence automatically adjusts
Settings:
Projection Horizon - How many bars forward to analyze outcomes (5, 10, 15, or 20 bars, default 10)
Lookback Period - Historical data window in days (30-252, default 60)
Minimum Samples - Cases needed before using fallback (5-30, default 10)
Z-Score Threshold - Bucket boundary for LOW/MID/HIGH classification (1.0, 1.5, or 2.0 sigma)
Cloud Transparency - Adjust visibility (50-95%)
Colors - Customize bullish, bearish, and neutral cone colors
Confidence Levels:
HIGH - 30 or more similar historical cases found
MEDIUM - 15-29 similar cases
LOW - Fewer than 15 cases (more uncertainty)
IMPORTANT DISCLAIMER:
The Calculated Projection is based on past patterns only. It is NOT a price prediction or financial advice. Similar market states in the past do not guarantee similar outcomes in the future. The probability shown is historical frequency, not a guarantee. Always combine with other analysis and never rely solely on projections for trading decisions.
Alert Conditions
The indicator includes over 20 pre-built alert conditions:
Price vs VWAP:
Price crosses above VWAP
Price crosses below VWAP
Band Touches:
Price touches plus or minus one sigma band
Price touches plus or minus two sigma band (extreme)
Price touches plus or minus three sigma band (very extreme)
Z-Score Extremes:
Z-Score crosses above plus two (overbought extreme)
Z-Score crosses below minus two (oversold extreme)
Momentum and Trend:
Momentum slowing
Momentum accelerating
Trend turns bullish/bearish/neutral
Volume:
Volume spike detected
CVD Direction:
Buyers take control
Sellers take control
High Probability Signals:
Bullish reversal signal (oversold plus accelerating momentum)
Bearish reversal signal (overbought plus slowing momentum)
MTF and Special:
MTF confluence zone entry
VWAP squeeze fired
Bullish/Bearish divergence detected
Any significant signal (catch-all)
All signals use confirmed bar data to prevent false alerts from incomplete candles.
Settings Overview
Settings are organized into logical groups:
VWAP Settings
Anchor Period selection
Show/Hide VWAP line
Dynamic coloring toggle
VWAP label visibility
Bands Visibility
Toggle each of three bands independently
Info Table
Show/Hide table
Table position (9 options)
Text size
Volume spike label settings with adjustable thresholds
Momentum label settings with filters
Signal labels limited to 5 most recent (auto-managed)
Probability engine lookback period
Multi-Timeframe VWAP
Enable/Disable MTF system
Show MTF in table
Show MTF lines on chart
Individual timeframe toggles
Confluence zone threshold
Squeeze detection toggle
Session VWAPs
Enable/Disable session tracking
Apply to all assets option
Show session labels
Divergence Detection
Enable/Disable divergence
Pivot lookback period
Show divergence labels
Calculated Projection
Enable/Disable projection cone
Projection horizon (5, 10, 15, or 20 bars)
Lookback period in days (30-252)
Minimum samples threshold
Z-Score classification threshold (1.0, 1.5, or 2.0 sigma)
Cloud transparency adjustment
Bullish, bearish, and neutral colors
The Info Table - Your Trading Dashboard
The right side of your chart displays a compact table with up to twelve metrics.
Row-by-Row Breakdown:
Asset and Period - Shows what the indicator detected (US Stock, Crypto, Forex, etc.) and your selected anchor period. The detection happens automatically based on exchange data, so VWAP resets and calculations match your actual trading instrument.
Delta Percentage - How far current price sits from VWAP, expressed as a percentage. Positive means price trades above fair value. Negative means below. Large delta values (beyond 1-2%) often precede mean reversion moves. Day traders watch this for overextension.
Z-Score - Statistical deviation from VWAP measured in standard deviations. Unlike raw delta, Z-Score accounts for volatility. A 2% move in a volatile biotech stock differs from 2% in a stable utility. Z-Score normalizes this. Values beyond plus or minus two sigma occur only 5% of the time statistically.
Trend Direction - Whether VWAP itself is rising, falling, or flat. Rising VWAP means the volume-weighted average price is increasing, which indicates institutional accumulation. Falling VWAP suggests distribution. This differs from price trend since it weights by volume.
Momentum State - Is the trend accelerating or slowing down? This measures the rate of change in VWAP slope. When an uptrend shows slowing momentum, it often precedes reversal. Accelerating momentum in a downtrend can signal capitulation and potential bottom.
Relative Volume - Current bar volume compared to the 20-bar average, shown as percentage. Values above 150% indicate above-average activity. Spikes above 200-300% often mark institutional involvement. Low volume (below 80%) warns of potential fake moves.
MTF Bias - Four checkmarks or X marks showing whether price sits above or below Daily, Weekly, Monthly, and Quarterly VWAP. Four checkmarks means strong bullish alignment across all timeframes. Four X marks indicates bearish alignment. Mixed readings suggest consolidation or transition.
Band Probabilities - Historical statistics showing how often price touched each standard deviation band over your lookback period. This helps you understand if mean reversion or trend following works better for your specific instrument.
Session Status - Which global trading sessions are currently active (Asia, London, New York). Shows checkmarks for active sessions. Important for forex and crypto traders who need to know when major liquidity windows open and close.
Divergence State - Whether the indicator detects bullish or bearish divergence between price and cumulative volume delta. Bullish divergence occurs when price makes lower lows but buying pressure (CVD) makes higher lows, suggesting hidden accumulation.
Confidence Score - A weighted composite of all factors displayed as a progress bar and percentage. Combines MTF alignment, Z-Score, trend direction, volume delta, momentum, and relative volume into a single 0-100 score. Higher scores indicate stronger conviction setups.
Calculated Projection - When the Projection Cone is enabled, shows the historical probability of price direction and expected move. For example: "▲ 67% (+0.8%)" means in similar market states historically, price moved up 67% of the time with an average gain of 0.8%. The system analyzes 27 unique market states based on Z-Score, Trend, and Volume conditions.
Recommended Use Cases
Day Trading Stocks:
Use Session anchor with Band 1 visible. Watch for price returning to VWAP after morning move. Volume spikes near VWAP often mark institutional accumulation zones.
Swing Trading:
Use Weekly or Rolling 21D anchor. Enable MTF lines for Daily and Weekly levels. Trade pullbacks to these levels in direction of MTF bias.
Crypto and Forex:
Enable Session VWAPs. Use Rolling anchors to avoid artificial resets. Monitor session transitions for breakout opportunities.
Mean Reversion:
Focus on Z-Score reaching plus or minus two. Add Band 2 visibility. Combine with slowing momentum for highest probability reversals.
Trend Following:
Watch MTF bias alignment. Four checkmarks plus accelerating momentum plus high volume confirms trend continuation setups.
Projection Planning:
Enable the Calculated Projection to see what happened historically in similar market conditions. Use 5-10 bars for intraday setups, 15-20 bars for swing trade planning. Focus on high probability readings (above 60%) with HIGH confidence (30 or more samples). The cone shows the probable range of outcomes based on actual historical data. Combine with other factors like MTF alignment and volume for higher conviction setups.
Important Notes
The indicator does not repaint. MTF values use previous period's confirmed data.
Rolling VWAP works best on 15-minute timeframes and above due to bar lookback requirements.
Session VWAPs apply to global markets by default (forex, crypto, futures). Enable the all-assets option for stocks if desired.
Volume data for forex represents tick volume, not actual traded volume.
All alert conditions fire only on confirmed (closed) bars to prevent false signals.
The Calculated Projection updates each bar as market state changes. This is expected behavior. The projection shows probabilities based on similar past conditions, not a fixed prediction.
Q AND A
Q: Does this indicator repaint?
A: No. The main VWAP calculation uses standard TradingView VWAP methodology. Multi-timeframe values use previous period's confirmed data with appropriate lookahead settings. All alert signals require bar confirmation.
Q: Why does my Rolling VWAP look different on 1-minute versus 15-minute charts?
A: Rolling VWAP calculates across a fixed number of trading days. On very short timeframes, the bar lookback may hit TradingView limits. For best Rolling VWAP accuracy, use 15-minute or higher timeframes.
Q: Can I use this on any instrument?
A: Yes. The indicator automatically detects asset type and adjusts behavior. Stocks use standard market hours. Crypto uses 24/7 calculations. Forex uses tick volume. Everything adapts automatically.
Q: What does the Confidence Score actually measure?
A: The score combines six weighted factors: MTF alignment (25%), Z-Score position (20%), Trend direction (20%), CVD pressure (15%), Momentum state (10%), and Relative volume (10%). Higher scores indicate more factors aligned in one direction.
Q: Why are Session VWAPs not showing on my stock chart?
A: Session VWAPs apply to 24-hour markets by default (forex, crypto, futures). For stocks, enable the Use for All Assets option in Session VWAP settings.
Q: The Divergence labels appear delayed. Is this a bug?
A: Divergence detection requires pivot confirmation, which needs bars on both sides of the pivot point. The label appears at the actual pivot location (several bars back) once confirmed. This is intentional and prevents false signals.
Q: Can I change the band colors?
A: Yes. Each of the three bands has its own color input setting. You can customize Band 1, Band 2, and Band 3 colors to match your preferences. The defaults are Aqua, Fuchsia, and Purple. The main VWAP line color adapts dynamically based on slope direction or can be set to static blue.
Q: How do I set up alerts?
A: Right-click on the chart, select Add Alert, choose this indicator, and select your desired condition from the dropdown. All conditions include descriptive alert messages with relevant data.
Q: What is the Probability Engine lookback period?
A: This setting determines how many trading days the indicator analyzes to calculate band touch rates and mean reversion statistics. Default is 60 days (approximately 3 months). Longer periods provide more stable statistics but may miss recent behavior changes.
Q: Why do I see fewer labels than expected?
A: Signal labels (Volume, Momentum, Squeeze, Divergence) are limited to 5 most recent labels on the chart to keep it clean. When a new label appears, the oldest one is automatically removed. Additionally, momentum labels have several filters: check the slope multiplier setting (higher values require stronger trends) and the Only Reversal Signals option (when enabled, labels only appear for potential reversals, not trend confirmations).
Q: What is the Calculated Projection and how accurate is it?
A: The Calculated Projection analyzes what happened in past market conditions similar to the current state. It classifies each bar by Z-Score level, Trend direction, and Volume profile (27 unique states), then shows the historical probability of up vs down and the average move size. It is NOT a price prediction or guarantee. The probability shown is how often similar conditions led to up/down moves historically, not a future guarantee. Always use it as one input among many.
Q: Why does the Projection probability change?
A: The projection updates on each bar as market state changes. If Z-Score moves from LOW to MID, or trend shifts from UP to FLAT, the system looks up a different historical category. This is expected behavior. The projection shows what happened in similar past conditions to the current bar's state.
Q: The Projection shows LOW confidence. What does that mean?
A: Confidence levels indicate sample size: HIGH means 30 or more historical cases found, MEDIUM means 15-29 cases, LOW means fewer than 15 cases. When sample size is low, the system uses a fallback: first aggregating by Z-Score plus Trend only (ignoring volume), then by Z-Score only. LOW confidence means less statistical reliability, so weight other factors more heavily in your decision.
Q: Why does the cone sometimes show 50/50 probability?
A: A 50/50 reading means that in similar past market states, price moved up roughly half the time and down half the time. This indicates a neutral or balanced condition where historical patterns provide no directional edge. Consider waiting for a higher probability setup or using other analysis methods.
CREDITS AND ACKNOWLEDGMENTS
Methodology Foundation:
VWAP (Volume Weighted Average Price) - Standard institutional benchmark calculation, widely used since the 1980s for algorithmic execution and fair value assessment
Standard Deviation Bands - Statistical volatility measurement applying normal distribution principles to price deviation from mean
Z-Score Analysis - Classic statistical normalization technique for comparing values across different volatility regimes
Cumulative Volume Delta (CVD) - Order flow analysis concept measuring aggressive buying versus selling pressure
Concept Integration:
Mean reversion probability engine - Custom historical statistics tracking for band touch rates
Momentum acceleration detection - Second derivative analysis of VWAP slope changes
VWAP Squeeze - Volatility compression concept adapted from TTM Squeeze methodology applied to VWAP bands versus ATR
Confidence scoring system - Weighted composite scoring combining multiple technical factors
Calculated Projection Cone - Probability-based projection using 27-state market classification (Z-Score, Trend, Volume) with historical outcome analysis and weighted fallback system
All calculations use standard public domain formulas and TradingView built-in functions. No proprietary third-party code was used.
For questions, feedback, or feature requests, please comment below or send a private message.
Happy Trading!

Cyclic Smoothed RSI MTFAdaptive cyclic smoothed Relative Strength Indicator (csRSI MTF)
The cyclic smoothed RSI MTF indicator is an enhancement of the RSI , adding zero-lag smoothing, adaptive oversold/overbought bands and period color highlighting from higher timeframe to filter signals.
Providing the following advanced features:
using the current dominant cycle length as input for the indicator to ensure more accurate change in trends,
additional smoothing without introducing lag and maintaining clear sharp turns for signal generation,
adaptive upper and lower bands to avoid whipsaw trades and adapt the indicator to trending/cyclic conditions,
using higher time-frame csRSI oversold/overbought conditions to automatically highlight time windows with green/red backgrounds on the indicator panel for signal filtering and/or alert rules,
can be used to trigger alerts on your key symbols to get informed when a red/green windows are reached.
The following common problems with standard indicators are solved by this indicator:
First, normal indicators introduce a lot of false signals due to their noisy signal line. Second, to compensate for the noise, one would normally try to add some smoothing. But this only results in adding more delay to the indicator, which makes it almost useless. Third, oscillators contain static threshold levels to define oversold/overbought conditions. However, the market is not static and changes between trending and cycling periods. In trending periods, these static oversold/overbought levels are useless ore will trigger too much whipsaw trades. Finally, indicators don't take their state from other timeframes into account to filter signals.
All four problems described above are solved by the developed adaptive cyclic RSI with embedded MTF period highlighting.
Examples
S&P500 EMini Futures - csRSI 2H chart / 1D filter example signals
S&P E-Mini Futures 2h chart with daily higher time-frame filtering period for the csRSI, showing the standard RSI in the lower panel for signal comparison, signals from the csRSI are marked on the price chart
Bitcoin BTC /USD - csRSI 2H chart / 1D filter example signals
Bitcoin BTC /USD 2h chart with daily higher time-frame filtering period for the csRSI, signals marked
EUR/USD Forex - csRSI 20min chart / 2h filter example signals
EUR/USD 20min chart with 2H higher time-frame filtering period for the csRSI, signals marked
Info:
All three examples are setup with the basic standard settings and no additional parameter adjustments. The placed arrows on the price/indicator panel and the projection price areas have been added manually to visualize the signals for an discretionary trading approach. They are derived based on standard technical indicator oscillator readings (signal turn above/below bands). Due to the nature of the indicator (ultra-smooth, sharp curves, dynamic bands), these signals are easy to spot, and will help to avoid whipsaw trades in volatile conditions.
Settings & Parameter
The Inputs section allows you to select the time frame for the indicator signals. We recommend keeping the indicator time-frame according to your chart time frame ("Same as chart"). The cycle length allows to improve the signals by entering the dominant cycle length of the analyzed dataset. This parameter is optional if the current dominant cycle is not known. In that case, leave it at 20. The dominant cycle length can even improve the indicator signal generation. The examples above have not been optimized by using the dominant cycle length and just used the standard setting of 20.
The MTF CYCLE FILTER area is used to set the time-frame used as filter to plot the colored indicator background in red and green areas when the higher time-frame indicator is above (red) or below (green) the dynamic bands. These indicate the period of time with high probability to look for signals on the main indicator line.
The MTF Resolution parameter input is important for generating the highlighted red/green areas on the indicator panel. You must enter a higher time-frame than your indicator time-frame in order to get the reliable highlighting. We recommend the following combinations of trading time-frame and filter time-frame resolutions:
Chart Timeframe | MTF Indicator Highlighting Resolution
------------------------------------------------------------------------
20 min | 2 h
2 h | 1 d
You can enter the current dominant cycle length on the chosen higher time-frame resolution to even further optimize the indicator accuracy in the field "MTF CYCLE FILTER - Cycle Length".
The Style sections allows to active/de-active individual plots. The standard setting disables the higher time-frame csRSI indicator which is only used to indicate the colored areas. If required, you can also enable the MTF indicator and adaptive bands to be plotted in the same indicator panel. The values shown in the style section also indicate which values are available for individual alert generation.
Automatic Signals & Alerts
It is possible to create your own automatic signals with the csRSI MTF indicator using the TradingView alert function. Click on the three dots "More" beside the indicator name label and select "Add Alert on csRSI ..." from the context menu. For example, if you want to receive an alert when the high probability periods (red/green highlighted areas) have been reached for a symbol without manually watching the indicator panel, you can set up a custom alert. The csRSI indicator provides the raw values necessary to set up your alarm conditions. Set the "CSRSI MTF" as the value for the "Out of Channel" condition and select the "HigBand MTF" and "LowBand MTF" indicator values as the upper and lower limit parameters in the alarm's dialog box. Once you have set up this alarm, you will not need to monitor your charts manually. The TradingView alert will inform you as soon as an important time zone is reached. These are the situations when you would open the chart and watch for trigger signals on the indicator line. If you set up this alert as an email, you can even focus on other things and let the csRSI MTF highlighter condition alert you when you should pay attention to the trading chart.
Usage & Trade Signals
Classic rules apply as with every technical oscillator. In addition use this indicator to identify the following conditions:
Indicator turns above/below the adaptive upper and lower bands (expected trend reversals)
Indicator crosses below upper band / crossed above lower band (start of trend reversal)
Indicator crosses above upper band / crossed below lower band (trend continuation/confirmation)
Divergence between price / indicator indicate strong signal confidence
Hidden divergences between price/indicator indicate string signal confidence
After strong price movements, wait for the second signal confirmed by a divergence
Use the mentioned conditions in the highlighted red/green periods indicated by the MTF settings
Purpose & Disclaimer
This indicator is not designed for use as an automated trading strategy. This is an improved technical indicator using the dominant cycle to provide its advanced features. The basic applications of technical analysis for using oscillators apply. The script is intended for use in discretionary trading and can be used as a part of automated systems. Indicator signal failures will occur as you should expect with every technical indicator. If you are not sure if this indicator might help your trading style, please try and check our open source public version which will give you basic understanding upfront.
Basic open-source public version
This indicator is an advanced version of our public available open-source cyclic smoothed RSI indicator named "RSI cyclic smoothed v2". The advanced invite-only version provides fully automatic time frame highlighting by using a cyclically smoothed RSI from a higher time frame to indicate time frames with high probability signals. These high probability windows are highlighted when the indicator from the higher time frame is in dynamic overbought or oversold territory. You will find the basic open-source public version here below for your own review:
How to get access
Please check the "authors instructions" section for further details.
付費腳本
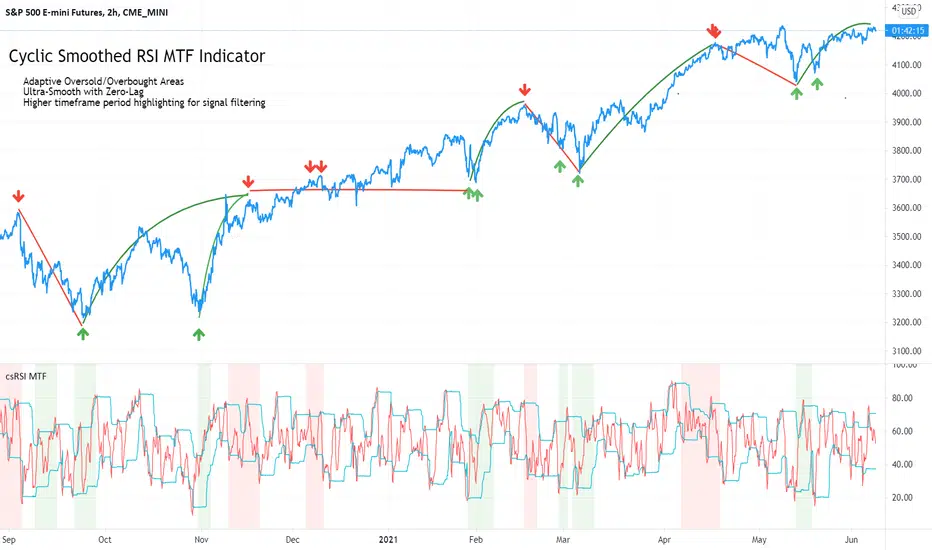
W%R Cycle Swings - MTF Trend📄 English Description
Overview
The W%R Cycle Swings – MTF Trend indicator is a market-structure tool built on top of Williams %R cycle logic. It detects meaningful swing highs and lows from W%R behavior, then uses those swings to locate the first Market Structure Shift (MSS-first) and track multi-timeframe trend bias + cancel levels.
This is not a random mashup of indicators: all components are derived from one core concept—W%R cycles—and are combined into a single, coherent framework for reading structure and trend across timeframes.
Core Concepts
1. Williams %R Cycle Swings (Current Timeframe)
Instead of using price swings based only on highs/lows, this script uses Williams %R behavior to define swing points:
Swing High pattern: OS → OB → OS
Swing Low pattern: OB → OS → OB
The script:
Tracks overbought/oversold states using user-defined levels.
Builds a zone for each potential swing (accumulating the extremums during the OB/OS phase).
Confirms a swing only when the opposite state appears again.
Plots labels on the chart:
Swing High label above price
Swing Low label below price
Optional price display on the label (toggle in settings).
This makes the swing points cycle-based rather than purely bar-based.
2. MSS-first (Market Structure Shift on Current TF)
Once swings are defined, the script looks for the first break of the most recent swing:
Bullish MSS-first: price breaks above the last confirmed swing high.
Bearish MSS-first: price breaks below the last confirmed swing low.
You can choose whether to confirm by close or by wick (mssByClose input).
When an MSS-first is detected:
A colored label (bullish/bearish) is drawn at the relevant swing level.
A horizontal line is drawn from the swing bar to the MSS bar to visually connect the structure break.
Internal trendBias is updated to Up or Down, preventing duplicate MSS labels in the same direction.
This gives a clear, visual definition of when the structure actually shifted based on W%R-driven swings.
3. MTF MSS-first Trend & Cancel Logic
The same MSS-first concept is applied inside a function and called via request.security() on multiple timeframes (5m, 15m, 30m, 1h, 4h).
For each timeframe, the function:
Recalculates W%R swings with the same parameters.
Detects MSS-first events (bullish or bearish).
Tracks a trend state:
1 → Up trend
-1 → Down trend
0 → Unknown / Neutral
Maintains a cancel level, which represents the price that would invalidate the current trend:
In an uptrend, cancel is typically the last relevant swing low.
In a downtrend, cancel is typically the last relevant swing high.
This provides:
Trend direction per TF (Up / Down / -)
A concrete price level that acts as a structural “stop” or invalidation level.
4. MTF Trend Table (Visual Overview)
If enabled, a compact table is displayed on the chart (position configurable):
Columns: 5m, 15m, 30m, 1h, 4h
Rows:
Trend → shows Up, Down or -, with color-coded background.
Cancel → shows the current cancel price for that timeframe.
This creates a multi-timeframe structure dashboard that tells you:
Which timeframes are currently in an Up or Down MSS-based trend.
At which price the current structural view would be canceled.
5. Alert Conditions
The script includes alert conditions for:
Current timeframe MSS-first:
Bullish MSS-first (structure break up).
Bearish MSS-first (structure break down).
MTF MSS-first events for:
5m, 15m, 30m, 1h, 4h (Bullish & Bearish separately).
This allows you to receive notifications when a fresh structural shift happens on any of the tracked timeframes.
How to Use
Use Swing High / Swing Low labels to understand the current W%R cycle structure on your main timeframe.
Watch for MSS-first labels to catch the first break of structure after a swing completes.
Use the MTF Trend table:
Trade in the direction of higher-timeframe trends.
Use cancel levels as logical invalidation areas or structural stop guides.
Combine the current timeframe swings with MTF bias:
Example: look for long setups when H1/H4 show Up trend and price forms new bullish MSS on lower TF.
The tool is suitable for both intraday and swing trading, on any symbol and timeframe.
Why This Script Is Original
It links cycle-based swings from Williams %R directly to MSS-first detection, rather than using generic pivot logic.
It combines:
W%R-driven swing definition,
MSS-first structural breaks,
Multi-timeframe trend state,
Cancel (invalidation) levels,
Alerts for MSS events on multiple TFs,
into a single, coherent market-structure framework.
The MTF table is not a generic dashboard: it is specifically built around this W%R-MSS-first structural model, which gives traders both trend context and exact invalidation prices.
🇹🇭 Thai Description — คำอธิบายภาษาไทย
ภาพรวม
อินดิเคเตอร์ W%R Cycle Swings – MTF Trend เป็นเครื่องมืออ่านโครงสร้างราคา โดยใช้ “วงจรของ Williams %R” เป็นหลักในการหา Swing High / Swing Low แล้วใช้จุด Swing เหล่านั้นมาหา MSS-first (จุดเปลี่ยนโครงสร้างครั้งแรก) จากนั้นต่อยอดไปสู่ การดูแนวโน้มหลายกรอบเวลา + ระดับ Cancel (จุดที่โครงสร้างจะถูกมองว่าพัง)
แนวคิดหลัก
Swing จาก Williams %R (TF ปัจจุบัน)
ใช้รูปแบบ OS → OB → OS เพื่อยืนยัน Swing High
และ OB → OS → OB เพื่อยืนยัน Swing Low
เมื่อยืนยันแล้วจะสร้าง Label “Swing High / Swing Low” บนกราฟ และสามารถแสดงราคาบนป้ายได้
ทำให้จุด Swing มีพื้นฐานจาก “Cycle ของ W%R” ไม่ใช่แค่ high/low เฉย ๆ
MSS-first บน TF ปัจจุบัน
ถ้าราคาทะลุ Swing High ล่าสุด → มองเป็น Bullish MSS-first
ถ้าราคาทะลุ Swing Low ล่าสุด → มองเป็น Bearish MSS-first
เลือกได้ว่าจะยืนยันจาก Close หรือจาก ไส้แท่งเทียน
วาดป้าย MSS + เส้นเชื่อมจาก Swing ไปยังจุดที่เกิด MSS
มีตัวแปร trendBias ป้องกันไม่ให้ยิง MSS ซ้ำในทิศทางเดิมจนรก
MTF MSS-first + Cancel Logic
นำ Logic เดียวกันไปใช้กับ TF: 5m, 15m, 30m, 1h, 4h
สำหรับแต่ละ TF จะได้:
สถานะแนวโน้ม: Up / Down / Unknown
ระดับ Cancel: ราคาที่ถ้าหลุดจะถือว่าโครงสร้างเทรนด์นั้นถูก “ยกเลิก”
เช่น ในเทรนด์ขาขึ้น ระดับ Cancel มักมาจาก Swing Low ล่าสุด ฯลฯ
MTF Table บนกราฟ
แสดง Trend + Cancel ของ 5 TF ในรูปแบบตาราง
อ่านง่าย: แถว Trend เป็น Up/Down พร้อมสีพื้น, แถว Cancel เป็นตัวเลขราคา
ใช้ดูภาพรวมโครงสร้างหลาย TF ในมุมมองเดียว
Alert Conditions
แจ้งเตือน MSS-first ของ TF ปัจจุบัน
แจ้งเตือน MSS-first ของ TF 5m / 15m / 30m / 1h / 4h แยก Bull / Bear
วิธีใช้งาน
ใช้ Swing High / Swing Low เพื่อดูว่าโครงสร้าง cycle ปัจจุบันอยู่ตรงไหน
รอให้เกิด MSS-first เพื่อมองว่า “โครงสร้างราคาเริ่มกลับตัวแล้ว”
ใช้ Table MTF:
ดูว่า TF ไหนเป็น Up / Down
ใช้ราคาบรรทัด Cancel เป็นแนว “จุดตัดขาดทุนเชิงโครงสร้าง” หรือจุดเปลี่ยนมุมมอง
เทรดตามทิศทาง TF ใหญ่ แล้วหา Entry จาก MSS ของ TF เล็ก
จุดเด่น / ความเป็น Original
ใช้ Williams %R เป็นฐานในการสร้าง Swing Pattern แทนการใช้ Pivot ธรรมดา
เชื่อม W%R Swing เข้ากับแนวคิด MSS-first อย่างเป็นระบบ
มีทั้ง:
ป้าย Swing
ป้าย MSS + เส้นเชื่อม
MTF Trend + Cancel
Alert เตือน MSS ในหลาย TF
อยู่ในสคริปต์เดียว
เหมาะกับคนที่ต้องการอ่านโครงสร้างราคาแบบมีที่มาที่ไป ไม่ใช่แค่ตามอินดี้ตัวเดียวครับ ✅

BG Ichimoku Tenkan & RSI MTF (Optimized)BG Ichimoku Tenkan & RSI MTF (Optimized)
The "BG Ichimoku Tenkan & RSI MTF (Optimized)" is a powerful and versatile TradingView indicator designed to provide multi-timeframe insights into market momentum using both the Tenkan-sen component of the Ichimoku Kinko Hyo and the Relative Strength Index (RSI). Developed by BAB & GINO, this tool helps traders quickly gauge trends and potential reversals across various timeframes directly on their chart.
Key Features and Functionality
This indicator combines visual clarity with comprehensive data presentation in a customizable table, making it easier to monitor multiple market dynamics at a glance.
Tenkan-sen Analysis
The Tenkan-sen (turning line) is a crucial part of the Ichimoku Kinko Hyo, calculated as the average of the highest high and lowest low over the past 9 periods. It serves as a short-term trend indicator.
Main Tenkan-sen Plot: The indicator displays the main Tenkan-sen line on your chart, colored dynamically to match the active chart's timeframe color for easy identification.
Multi-Timeframe (MTF) Tenkan Lines: You can enable additional Tenkan-sen lines for up to seven user-defined timeframes (e.g., 1m, 3m, 5m, 15m, 30m, 60m, 240m). These lines extend from the current bar with an adjustable offset, helping you visualize higher or lower timeframe Tenkan-sen levels relative to the current price.
MTF Line Labels: Each MTF Tenkan line can have a corresponding label indicating its timeframe (e.g., "1m", "3m"), with customizable size and offset for optimal visibility.
Tenkan Trend in Table: The indicator's integrated table clearly shows the current relationship between the Tenkan-sen and the price for each selected timeframe. An "🔼" symbol indicates the Tenkan-sen is above the price (bullish signal), while a "🔽" symbol indicates it's below (bearish signal), along with the Tenkan-sen's rounded value.
RSI Analysis
The Relative Strength Index (RSI) is a momentum oscillator that measures the speed and change of price movements. It typically ranges from 0 to 100 and is used to identify overbought or oversold conditions.
Customizable RSI Levels: You can set standard high (e.g., 60) and low (e.g., 40) RSI levels, as well as extreme high (e.g., 80) and extreme low (e.g., 20) levels to define zones of interest.
RSI Status in Table: The table provides a quick overview of the RSI value for each chosen timeframe, accompanied by intuitive emojis and symbols:
"🥵": Extremely overbought (above extreme high level)
"↑": Overbought (above high level)
"🥶": Extremely oversold (below extreme low level)
"↓": Oversold (below low level)
"-": Neutral (between high and low levels) The RSI value is also displayed, rounded to two decimal places.
Customizable Settings
The indicator offers extensive customization options through its input panel:
Table Position: Choose where the information table appears on your chart (Top Left, Top Right, Bottom Left, Bottom Right, Bottom Center).
Tenkan-sen Display: Toggle the visibility of the main Tenkan-sen line and the MTF Tenkan lines.
Line Offset: Adjust how far the MTF Tenkan lines extend from the current price bar.
MTF Label Settings: Control the visibility, size, and pixel offset of the MTF Tenkan line labels.
RSI Configuration: Define the RSI length and the thresholds for high, low, extreme high, and extreme low levels.
Table Text Size: Customize the font size within the indicator's table (Tiny, Small, Normal, Large).
Timeframe Selection: Independently set up to seven specific timeframes (in minutes) for both Tenkan and RSI analysis.
Timeframe Colors: Assign unique colors to each of the seven selected timeframes. These colors are used for the MTF Tenkan lines on the chart, the main Tenkan-sen line when its timeframe matches the chart, and the header cells in the information table, providing a consistent visual theme.
This "BG Ichimoku Tenkan & RSI MTF (Optimized)" indicator is a valuable tool for traders looking to enhance their market analysis with multi-timeframe confirmation, aiding in better-informed trading decisions.

Multi-Function RSI(MTF, divergence, signal and alert)Japanese below / 日本語説明は下記
Overview
Multi-function RSI indicator with functions below.
1.MTF with display timeframe control
2.Auto divergence drawing incl. hidden divergence
3.Signal when RSI crosses over upper band/crosses under lower band
4.Color background when MTF RSI crosses over/under lower band
5.Alert when RSI crosses over upper band/crosses under lower bands
Please see the details below.
Functions:
1.MTF with display timeframe control
You can display daily, 4hour or 1 hour RSI or all of them as upper timeframe MTF RSI.
How is it different from other MTF indicators?
Problems with other MTF RSI indicators are;
-If you set higher timeframe RSI, it will also be shown on further higher timeframes.
i.e. If you set 4hour chart’s RSI on 1 hour or lower time frame charts, it will also appear on daily and weekly chart, which is not necessary.
To tackle these problems, this indicator has incorporated functions below.
-To show MTF RSI on timeframe lower than the upper timeframe you set as MTF timeframe.
For example, if you select daily timeframe for MTF RSI , the RSI will be shown only on 4 hour or lower timeframes(1H, 30M, 15M, 5M, 1M).
Left: 4hour chart, Middle: Daily chart, Right: Weekly chart
If you look at 4hour chart, daily chart’s RSI is shown(pale blue and orange) but weekly chart does not show daily chart’s RSI.
2.Auto divergence drawing incl. hidden divergence
Regular divergence line and hidden divergence line will be automatically drawn for current timeframe RSI as per the logic below.
Bearish : When two consecutive pivot highs go up but RSI values corresponding to each high go down.
Bullish: When two consecutive pivot lows go down but RSI values corresponding to each low go up.
Pivot highs(lows) are identified when those are preceded by n lower highs(lows) and proceeded by n lower highs(lows).
* n is parameterized.
See the diagram below.
Bearish : When two consecutive pivot highs go down but RSI values corresponding to each highs go up.
Bullish : When two consecutive pivot lows go up but RSI values corresponding to each low go down.
3.Signal when RSI crossing upper/lower bands
Signal will be shown when;
-RSI(current timeframe) crosses over upper band
-RSI(current timeframe) crosses under lower band
Example:
Purple triangle is signals.
4.Color background when MTF RSI crosses over/under lower band
Background color can be applied when MTF RSI crosses over upper band/under lower band.
Example:
Pale purple is daily RSI on 4 hour chart. Background color applied while daily RSI is outside upper/lower bands.
5.Alert when RSI crosses over upper band/under lower band
Alert can be set when;
-RSI crosses over upper band
-RSI crosses under lower band
How to use this indicator?
This indicator is paid indicator and invited-only indicator.
Please contact me via private chat or follow links in my signature so that I can grant the access right to the indicator.
Comment section is only for comments on the indicator or updates. Please refrain from contacting me using comments to follow TradingView house rules.
———————————————————————————————————————
多機能RSIインジケーターです。以下の機能が搭載されています。
1.マルチタイムフレーム機能(表示時間足制御機能付き)
2.ダイバージェンス自動描画機能(ヒドゥンダイバージェンス対応)
3.RSIがアッパーバンド、ロワーバンドとクロスした時にシグナル表示
4.上位足RSI(MTF RSI)がアッパーバンドより上にある時、ロワーバンドより下にある時に背景をハイライト
5.RSIがアッパーバンド、ロワーバンドとクロスした時にアラート設定
機能詳細は以下の通りです。
機能詳細
1.マルチタイムフレーム機能(表示時間足制御機能付き)
日足、4時間足、1時間足のいずれか、もしくは全てをRSIをマルチタイムフレームRSIとして表示することができます。(不要な場合は非表示可能)
他のマルチタイムフレームRSIとの違い
他のマルチタイムフレームRSIのインジケーターでは、以下の問題に直面します。
・上位足のRSIを表示すると、さらに上位足でもそのRSIが表示され見にくくなる。
例: 4時間足のRSIを下位足で表示可能な様に設定すると、日足や週足でも表示され、チャートが見にくくなる。
この問題に対して、このインジケーターでは、
・上位足のRSIを表示する時間軸を制御することで上位足で不必要な情報を表示させない。
という機能を加えることでこの問題を解決しています。
具体的には、マルチタイムフレーム用に選択した上位足のタイムフレームより小さいタイムフレームでのみ上位足のRSIが表示されるようになっています。
例えば、上位足として日足を選択した場合、日足のRSIは4時間足、1時間足、30分足、15分足、5分足、1分足にのみ表示されます。
<サンプルチャート>
左から4時間足、日足、週足です。
4時間足では日足のRSI(薄いパープルのライン)が表示されていますが、週足には表示されません。これはオシレーターが表示される時間軸を裏側のロジックで制御しているためです。
2.ダイバージェンス自動描画機能(ヒドゥンダイバージェンス対応)
以下のロジックに基づきダイバージェンスを自動描画します。(不要な場合は非表示可能)
<通常のダイバージェンス>
下降示唆:2つの連続する高値(*)が切り上げられているが、 それぞれの高値に対応するRSIの値は切り下げている場合
上昇示唆:2つの連続する安値(*)が切り下がっているが、 それぞれの安値に対応するRSIの値は切り上がっている場合
*高値(安値)は、左右n本(**)ずつのローソク足の高値(安値)より高い(低い)高値(安値)をピボットハイ・ローとして算出しています。
** nはユーザ設定値です。
<例: ダイバージェンス>
高値PH1はPH1のローソクの高値より左側にn個のより低い高値、右側にn個のより低い高値があった場合に高値として認識されます。
上記の例では高値がPH2>PH1と切り上がっていますが、対応するRSIの値はvalue2
下降継続示唆:2つの連続する高値(*)が切り下がっているが、 それぞれの高値に対応するRSIの値は切り上がっている場合
上昇継続示唆:2つの連続する安値(*)が切り上がっているが、 それぞれの安値に対応するRSIの値は切り下がっている場合
言うまでもないことですが、ダイバージェンスが出たから逆張り、などの安易な発想は避けるべきです。
環境認識の一つの要素として見るべき指標でしょう。
3.RSIがアッパーバンドを上抜いた時、ロワーバンドを下抜いた時にシグナル表示
アッパーバンド(初期値70)とロワーバンド(初期値30)の数値は変更可能です。
サンプルチャート:
4.上位足RSI(MTF RSI)がアッパーバンドより上にある時、ロワーバンドより下にある時に背景をハイライト
サンプルチャート:
日足のRSI(薄いパープルのライン)がアッパーラインより上にある時に背景がグレーがかっています。
このように上位足のRSIの状況を視覚的に認識したい時に役立つでしょう。
日足RSIラインは非表示にすることができますので、背景色だけ表示しておいて、背景に色が付き、かつダイバージェンスも出たら反転を警戒といった状況判断が可能です。
5.RSIがアッパーバンド、ロワーバンドとクロスした時にアラート設定
アラートを設定したいタイムフレームを開いた状態で、アラート設定の画面を開き以下の条件を選択することができます。
・RSIがアッパーバンドを上抜いた時
・RSIがロワーバンドを下抜いた時
インジケーターの使用について
当インジケーターは招待制インジケーター(有料)となっています。
使用を希望される方はプライベートチャットや下記リンクのDMでご連絡ください。
このページのコメント欄はインジケーターそのものに対するコメントやアップデートの記載のためのものとなっております。Tradingviewのハウスルールを守るためにもコメント欄からの連絡はご遠慮ください。
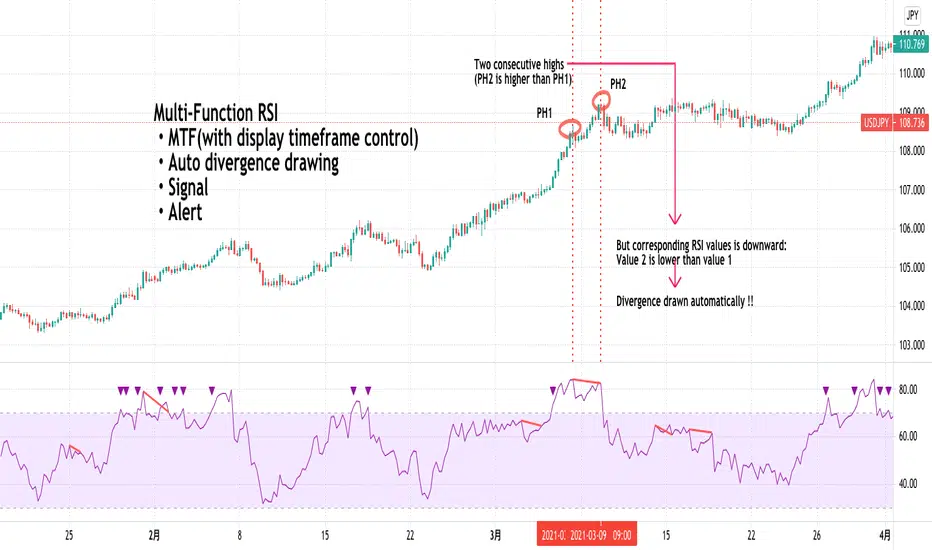
Demand Supply Zones with MTFDemand Supply Zones with Multi-Timeframe Analysis
Overview:
Advanced institutional demand/supply zone detector with multi-timeframe analysis, proximity alerts, and trend dashboards. Identifies high-probability reversal areas using intelligent base detection and breakout validation across 4 simultaneous timeframes.
Core Unique Features:
• 💎 Elite Base Factor: Auto-detects institutional base patterns using pre-breakout candle body ratio analysis (adjustable 0.1-2.0).
• 🌐 4-Timeframe Zone Detection: Simultaneous MTF zones with individual "👁️ Tested" toggles for granular control - unprecedented in demand/supply indicators.
• 🚨 Proximity Dashboard: Real-time distance tracking to nearest zones (current + all MTF). Visual "APPROACHING!" alerts when price within threshold %.
• 📊 Zone Analytics Dashboard: Live counters for active/tested zones per timeframe with date range display and MTF status tracking.
• 📈 Multi-Timeframe Trend Analysis: 4-TF trend direction
• 🎯 Advanced EMA System: 10 multi-timeframe EMA-20 lines + Golden/Death Cross alerts with customizable styling.
• 📅 Date Range Filter: Performance optimization with calendar-based zone limits (10-500 zones).
• 🧩 Gap Filling: Optional gap bridging between base and leg-out candles for continuous zones.
• 🔐 No Repainting: MTF zones created only on confirmed bars with lookahead bias disabled.
How It Works:
1. Base Detection: Identifies consolidation candles (1-4 consecutive) with customizable body % threshold. Elite mode auto-detects when pre-breakout candle is significantly smaller.
2. Leg-Out Validation: Confirms breakout strength of legout
3. Zone Extension: Projects zones forward (10-500 bars).Fresh zones (green/red) turn gray when tested.
4. MTF Integration: Detects zones from 4 higher timeframes with independent parameters. Each MTF has individual tested zone toggle.
5. Analytics: Proximity dashboard calculates real-time distance to nearest zones. Trend dashboard shows direction across 4 TFs.
Important Notes:
• Educational Purpose: This indicator is for analysis and learning only. Does not guarantee future results.
• Risk Management Required: Always use stop losses and proper position sizing.
• Chart Type: Use standard Candlestick charts. Non-standard charts (Heikin Ashi/Renko) not recommended for accurate zone detection.
• Timeframe Requirements: MTF zones appear only when viewing lower timeframe than selected MTF (e.g., view 1H chart to see Daily MTF zones).
• Performance: Enable Date Range Filter when using multiple MTF timeframes to reduce computational load.
• Past Performance Disclaimer: Historical accuracy does not guarantee future trading results.
⭐ If you find this indicator valuable, please like and share!

Wyckoff Smart Money Pro [MTF]Wyckoff Smart Money Pro detects trading ranges, phases, and events from the Wyckoff method and confirms them with VSA (Volume Spread Analysis), divergence checks, and a composite “smart money” strength index. It generates optional buy/sell signals only when multiple conditions align (phase, VSA, CO strength, effort vs. result, time/volume filters). The dashboard, POC/Value Area, and MTF backdrop help you manage context and risk in real time.
What this indicator does
Wyckoff Smart Money Pro is a multi-timeframe Wyckoff tool that:
⦁ Finds accumulation/distribution ranges and tracks Phases A–E.
⦁ Labels Wyckoff events (PS, SC, AR, ST, Spring/Test, SOS, LPS, UTAD, SOW, LPSY, TS…) and VSA patterns (No Demand/Supply, Stopping Volume, Upthrust, etc.).
⦁ Computes a Composite Operator (CO) Strength score from price/volume behavior to approximate “smart money” bias.
⦁ Adds divergence, effort vs. result, and a volume profile (POC & 70% value area) inside the detected range.
⦁ Provides buy/sell signals only when a configurable confluence is present (events + VSA + CO + EVR + phase + filters).
⦁ Supports MTF context (with a safe HTF resolver and fallbacks) and an Info Dashboard to summarize the current state.
It is designed to make the Wyckoff workflow visual and rules-based without promising results or automating decisions.
How it works (methods & calculations)
1) Range & Phase model
⦁ A sliding lookback searches for a valid range (recent highest high/lowest low), requiring width within 2–10× ATR(14) and a minimum bar count inside the bounds.
⦁ Once a range is active, the script derives Creek/Ice/Mid/Quartiles and classifies bars into Wyckoff Phases A–E using event recency (barssince) and where price sits relative to the range.
⦁ The background color reflects the current Phase; optional MTF events (from the chosen HTF) tint the background lightly for higher-timeframe context.
2) Wyckoff & VSA event engine
⦁ Events include PS, SC, AR, ST, Spring, Test, SOS, LPS, PSY, BC, UTAD, SOW, LPSY, TS, plus minor/multiple variants and Creek/Ice jumps.
⦁ VSA patterns detect No Demand/No Supply, Stopping Volume, Buying/Selling Climax, Upthrust/Pseudo Upthrust, Bag Holding, Shake-Out, Volume Dry-Up, etc., from spread vs. average spread and volume vs. average volume with tunable thresholds.
3) Smart-money (CO) Strength
⦁ CO Strength (0–100) blends: relative volume on up/down bars, professional accumulation/distribution, no-supply/no-demand, stopping volume, Springs/UTADs and Tests, SOS/SOW, price’s position inside the range, and volume-delta vs. its MA.
⦁ Persistent accumCount / distCount counters smooth temporary noise.
4) Divergence & Effort-vs-Result
⦁ Price vs. cum volume-delta divergence highlights weakening pushes.
⦁ EVR flags “High effort / no result” and potential Bullish/Bearish reversals, or “Low effort / high result” moves that are often unsustainable.
5) Volume Profile (inside range)
⦁ A 50-bin profile accumulates volume across the detected range to derive POC, VAH/VAL (70% value area). Lines update as the active range evolves.
6) Multi-Timeframe (MTF) safety
⦁ getHTF() converts your multiplier to a valid Pine timeframe string (e.g., 60, 240, 2D, 1W), and the script falls back to current timeframe values if an HTF request returns na.
⦁ If you enter a Custom HTF, it must be strictly higher than the chart’s timeframe (validated at runtime).
7) Signals & risk model
⦁ Signals are not tied to any single pattern. A buy may require Spring/Test/Shake-out/Creek Jump or SOS plus confirmation (VSA, CO>60, Phase C/D, divergence/EVR context).
⦁ Sell is symmetrical (UTAD/Failed Spring/SOW/Ice Jump + VSA + CO<40 + Phase C/D).
⦁ Minimum confidence is configurable; SL/TP and R:R lines are drawn from range edges or recent bar extremes.
⦁ Filters: trading hours, weekend avoidance, and a minimum volume threshold (relative to average) are available to suppress low-quality contexts.
⦁ Alerts include all major events, divergences, structure/phase changes, and the gated Buy/Sell signals (with a cooldown to reduce alert spam).
Inputs (key ones you’ll actually use)
⦁ Display Settings: toggle ranges, phases, events, VSA, signals, dashboard.
⦁ MTF: Enable HTF, set Multiplier or a Custom HTF (must be higher than current).
⦁ Range Detection: period / min bars / pivot strength.
⦁ VSA: volume sensitivity & climax multiplier.
⦁ Signal Settings: minimum confidence, risk/reward labels.
⦁ Advanced Filters: trading hours, weekend avoidance, and Min Volume Filter (× avg).
⦁ Colors: phase backgrounds, structure colors, and line styling.
How to use (practical flow)
1. Choose a symbol & timeframe you normally analyze (e.g., 5–60m for entries, 4H/D for context).
2. If using MTF, pick a multiplier (e.g., 5×) or a Custom HTF (e.g., 240/4H).
3. Wait for a range to form; watch Phase and CO Strength on the Dashboard.
4. When events (e.g., Spring/Test in Phase C or UTAD in distribution) appear with favorable VSA, CO, EVR, and volume/time filters, consider the signal and review R:R lines.
5. Use POC/VA and Creek/Ice/Mid as structure references; manage risk around the range edge that generated the setup.
On-chart legend (what the letters mean)
Wyckoff events (labels)
⦁ PS Preliminary Support, SC Selling Climax, AR Automatic Rally, ST Secondary Test
⦁ Spring Spring; Test Test of Spring
⦁ SOS Sign of Strength; LPS Last Point of Support
⦁ PSY Preliminary Supply, BC Buying Climax
⦁ UTAD Upthrust After Distribution; SOW Sign of Weakness; LPSY Last Point of Supply
⦁ TS Terminal Shakeout; MS Multiple Spring
⦁ CJ Creek Jump; IJ Ice Jump
⦁ mSOS / mSOW Minor Sign of Strength/Weakness
VSA patterns (tiny labels)
⦁ ND No Demand, NS No Supply, SV Stopping Volume, BC/SC Buying/Selling Climax
⦁ PA/PD Professional Accumulation/Distribution, BH Bag Holding, DU Volume Dry-Up
⦁ SO Shake-Out, TS Test for Supply (VSA test), UT Upthrust, PUT Pseudo Upthrust
Other visuals
⦁ Range box with Creek (upper third), Ice (lower third), Mid, Quartiles
⦁ POC/VAH/VAL: yellow solid (POC), purple dotted (value area)
⦁ VWAP and Dynamic S/R (stepline)
⦁ Green/Red triangles: gated Buy/Sell signals (only if min confidence & filters are met)
⦁ Risk label near the triangle: confidence /10 and R:R
Alerts included
⦁ Core events (Spring/Test/UTAD/SOS/SOW/TS), secondary events (SC/AR/BC/LPS/LPSY), VSA patterns, EVR states, Hidden Accumulation/Distribution, HTF events, Divergences, Phase/Structure changes, and the constrained Buy/Sell signals with a cooldown.
Notes, limits & best practices
⦁ This is not a buy/sell system; it’s a context & confirmation tool. Combine with your plan, risk limits, and execution criteria.
⦁ Long, illiquid, or news-driven bars can distort volume/spread logic; filters help but cannot eliminate this.
⦁ For MTF, if an exchange doesn’t support a specific HTF, the script falls back safely to current TF values to avoid na-propagation.
⦁ Dashboard rows/size/position are user-configurable to keep charts uncluttered.
Changelog (what’s new in this version)
⦁ MTF safety & validation (Custom HTF must be above current; graceful fallbacks for request.security() na results).
⦁ Performance caching for close position & up/down bar flags; drawing cleanup to stay under label/line limits.
⦁ Volume Profile upgraded to 50 bins; VA algorithm adjusted accordingly.
⦁ Signal gating with time/day/volume filters and alert cooldown to reduce noise.
⦁ Bug guards for parameter conflicts (e.g., rangeMinBars cannot exceed rangePeriod).
Disclaimer
This script is for educational and research purposes only and does not constitute financial advice or a recommendation to buy or sell any asset. Market risk is real; always test on a demo and trade at your own discretion.

Stochastic RSI with MTF TableShort Description of the Script
The provided Pine Script indicator, titled "Stochastic RSI with MTF Table," calculates and displays the Stochastic RSI for the current timeframe and multiple other timeframes (5m, 15m, 30m, 60m, 240m, and daily). The Stochastic RSI is a momentum indicator that blends the Relative Strength Index (RSI) and Stochastic Oscillator to identify overbought and oversold conditions, as well as potential trend reversals via K and D line crossovers.
Key features of the script include:
Inputs: Customizable parameters such as K smoothing (default 3), D smoothing (default 3), RSI length (default 14), Stochastic length (default 14), source price (default close), and overbought/oversold levels (default 80/20).
MTF Table: A table displays the Stochastic RSI status for each timeframe:
"OB" (overbought) if K > 80, "OS" (oversold) if K < 20, or "N" (neutral) otherwise.
Crossovers: "K↑D" for bullish (K crosses above D) and "K↓D" for bearish (K crosses below D).
Visualization: Plots the K and D lines for the current timeframe, with horizontal lines at 80 (overbought), 50 (middle), and 20 (oversold), plus a background fill for clarity.
Table Position: Configurable to appear in one of four chart corners (default: top-right).
This indicator helps traders assess momentum across multiple timeframes simultaneously, aiding in the identification of trend strength and potential entry/exit points.
Trading Strategy with 50EMA and 200EMA for Highest Winning Rate
To create a strategy with the best probability of a high winning rate using the Stochastic RSI MTF indicator alongside the 50-period Exponential Moving Average (50EMA) and 200-period Exponential Moving Average (200EMA), we can combine trend identification with momentum-based entry timing. The 50EMA and 200EMA are widely used to determine medium- and long-term trends, while the Stochastic RSI MTF table provides multi-timeframe momentum signals. Here’s the strategy:
1. Determine the Overall Trend
Bullish Trend: The 50EMA is above the 200EMA on the current timeframe (e.g., daily or 60m chart). This suggests an uptrend, often associated with a "Golden Cross."
Bearish Trend: The 50EMA is below the 200EMA on the current timeframe. This indicates a downtrend, often linked to a "Death Cross."
Implementation: Plot the 50EMA and 200EMA on your chart and visually confirm their relative positions.
2. Identify Entry Signals Using the Stochastic RSI MTF Table
In a Bullish Trend (50EMA > 200EMA):
Look for timeframes in the MTF table showing:
Oversold (OS): K < 20, indicating a potential pullback in the uptrend where price may rebound.
Bullish Crossover (K↑D): K crosses above D, signaling rising momentum and a potential entry point.
Example: If the 60m and 240m timeframes show "OS" or "K↑D," this could be a buy signal.
In a Bearish Trend (50EMA < 200EMA):
Look for timeframes in the MTF table showing:
Overbought (OB): K > 80, suggesting a rally in the downtrend where price may reverse downward.
Bearish Crossover (K↓D): K crosses below D, indicating declining momentum and a potential short entry.
Example: If the 30m and daily timeframes show "OB" or "K↓D," this could be a sell/short signal.
Current Timeframe Check: Use the plotted K and D lines on your trading timeframe for precise entry timing (e.g., confirm a K↑D crossover on a 60m chart for a long trade).
3. Confirm Signals Across Multiple Timeframes
Strengthen the Signal: A higher winning rate is more likely when multiple timeframes align with the trend and signal. For instance:
Bullish trend + "OS" or "K↑D" on 60m, 240m, and daily = strong buy signal.
Bearish trend + "OB" or "K↓D" on 15m, 60m, and 240m = strong sell signal.
Prioritize Higher Timeframes: Signals from the 240m or daily timeframe carry more weight due to their indication of broader trends, increasing reliability.
4. Set Stop-Loss and Take-Profit Levels
Long Trades (Bullish):
Stop-Loss: Place below the most recent swing low or below the 50EMA, whichever is closer, to protect against trend reversals.
Take-Profit: Target a key resistance level or use a risk-reward ratio (e.g., 2:1 or 3:1) based on the stop-loss distance.
Short Trades (Bearish):
Stop-Loss: Place above the most recent swing high or above the 50EMA, whichever is closer.
Take-Profit: Target a key support level or apply a similar risk-reward ratio.
Trailing Stop Option: As the trend progresses, trail the stop below the 50EMA (for longs) or above it (for shorts) to lock in profits.
5. Risk Management
Position Sizing: Risk no more than 1-2% of your trading capital per trade to minimize losses from false signals.
Volatility Consideration: Adjust stop-loss distances and position sizes based on the asset’s volatility (e.g., wider stops for volatile stocks or crypto).
Avoid Overtrading: Wait for clear alignment between the EMA trend and MTF signals to avoid low-probability setups.
Example Scenario
Chart: 60-minute timeframe.
Trend: 50EMA > 200EMA (bullish).
MTF Table: 60m shows "OS," 240m shows "K↑D," and daily is "N."
Action: Enter a long position when the 60m K line crosses above D, confirming the table signal.
Stop-Loss: Below the recent 60m swing low (e.g., 2% below entry).
Take-Profit: At the next resistance level or a 3:1 reward-to-risk ratio.
Outcome: High probability of success due to trend alignment and multi-timeframe confirmation.
Why This Strategy Works
Trend Following: Trading in the direction of the 50EMA/200EMA trend reduces the risk of fighting the market’s momentum.
Momentum Timing: The Stochastic RSI MTF table pinpoints pullbacks or reversals within the trend, improving entry timing.
Multi-Timeframe Confirmation: Alignment across timeframes filters out noise, increasing the win rate.
Risk Control: Defined stop-loss and position sizing protect against inevitable losses.
Caveats
No strategy guarantees a 100% win rate; false signals can occur, especially in choppy markets.
Test this strategy on historical data or a demo account to verify its effectiveness for your asset and timeframe.
This approach leverages the strengths of both trend-following (EMA) and momentum (Stochastic RSI) tools, aiming for a high-probability, disciplined trading system.

Statistical Price Bands with MTF Bands by QTX Algo SystemsStatistical Price Bands with MTF Bands by QTX Algo Systems
Overview
This indicator builds on the original Statistical Price Bands with Trend Filtering script by introducing Multi-Timeframe (MTF) Band Visualization. While the base version calculated adaptive price bands using statistical percentiles, trend filtering, and volatility adjustments, this enhanced version adds support/resistance bands from multiple timeframes onto the current chart.
This is not a minor cosmetic update. The MTF version includes additional request.security() logic and significantly increases context by allowing traders to reference band extremes from longer or shorter timeframes without switching charts. For this reason, the original and MTF versions are maintained separately, as this script requires a Pro+ or Premium TradingView plan to function correctly.
What’s New in This Version
Multi-Timeframe Band Support: Fetches and displays upper and lower bands from other timeframes (e.g., 30min, 1H, 4H, 1D, 1W, 1M).
Chart-Based MTF Labels: Each band is labeled with its source timeframe (e.g., “1D U” = 1-Day Upper Band) for easy visual reference.
Custom Timeframe Control: Users can toggle specific timeframes on/off depending on their preferences and strategy.
Core Calculation Method (Unchanged)
Statistical Percentile Calculation:
Determines upper and lower thresholds using a historical percentile method applied to price deviations from a VWMA anchor.
Volatility Adjustment:
Dynamically scales the percentile thresholds based on a volatility factor (standard deviation vs. moving average).
Trend Filtering:
Adds a directional bias based on whether price is above or below its VWMA, pushing the bands higher in uptrends and lower in downtrends.
MTF Band Integration
This version calculates additional statistical bands using the same logic as the chart’s timeframe, but applies it to other timeframes selected by the user. These values are fetched using request.security() and then plotted onto the current chart using lines and labels.
This functionality allows traders to:
See if current price is extended compared to higher timeframe extremes.
Spot trend continuation or exhaustion relative to intraday or macro levels.
Identify areas of confluence for trade entries, exits, or stop placement.
Inputs & Customization
Statistical Percentile (default: 95)
Controls how extreme the bands are. Higher values = wider bands.
Lookback Period (default: 350)
Number of bars used to calculate percentiles. Longer = smoother bands.
VWMA Length (default: 20)
Sets the moving average anchor for calculating relative price deviation.
Volatility Factor Multiplier (default: 1.0)
Scales the influence of market volatility on band width.
Trend Strength Multiplier (default: 10.0)
Adjusts how far bands shift in the direction of the trend.
Timeframe Toggles (MTF)
Select which timeframes (e.g., 1H, 4H, 1D, 1W) to show on the chart.
Label Offset
Controls how far right MTF labels appear on the chart.
Use Case Scenarios
Overextension Detection:
Price touching or breaching an MTF band may suggest exhaustion, especially if confirmed by confluence or divergence.
Trend Confirmation:
Bands tilting in one direction across multiple timeframes can suggest strong trend alignment.
Risk Management:
Use bands from higher timeframes as trailing stops or invalidation zones.
Why This Is a Separate Script
This version uses request.security() to retrieve values from multiple timeframes, which:
Requires an upgraded TradingView plan (Pro+ or higher).
May impact performance on lower-tier plans.
Provides a major functional difference from the original, not a minor tweak or cosmetic upgrade.
To maintain compatibility and accessibility for all users, both versions are published separately:
The original for single-timeframe users.
This version for those using a multi-timeframe workflow.
Disclaimer
This script is for educational purposes only. It is intended to support your analysis—not to predict outcomes or replace risk management. Past performance is not indicative of future results. Always perform your own analysis and trade responsibly.
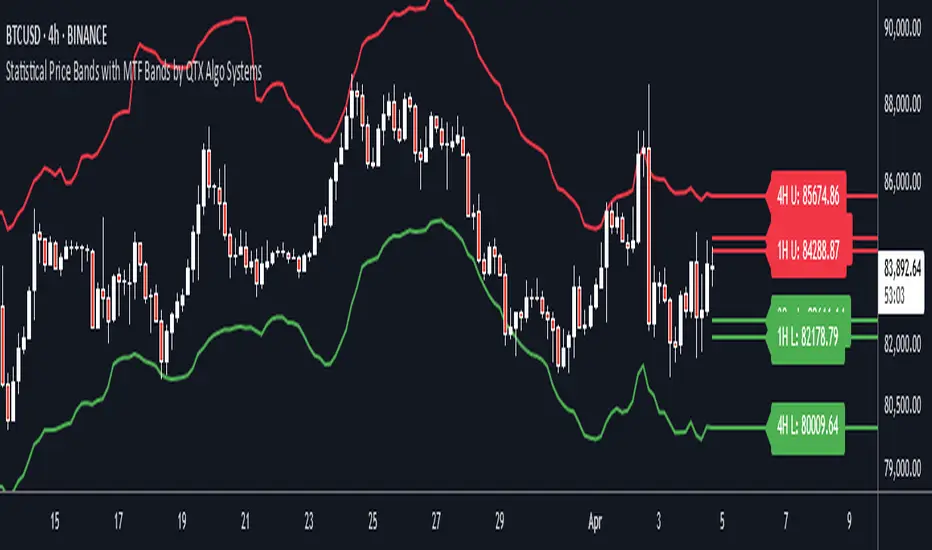
3 Line Strike MTF [MsF]Japanese below / 日本語説明は英文の後にあります。
-------------------------
*This indicator is based on TheTrdFloor's "3 Line Strike ". It's a very cool indicator. thank you.
In addition to the original indicator, it will be judged Engulfing only when the display of the MTF signal and the candle have a difference of 2 times or more.
=== Function description ===
1. Display of the MTF signal
Detects Engulfing of the specified Multi Time Frame. MTF Engulfing is displayed with 🍆 and 🍑.
2. Judged Engulfing on a difference of 2 times or more
Show a signal if the body of the current candle is more than twice as large as the body of the previous candle. This will make the signal mark appear larger than normal.
=== Parameter description ===
- COMMON SETTING
- Show Signal on MTF ? … If the check this, you can get MTF 3 Line Strike
- Judge Double Engulfing ? … If you check it, the signal will come up only when the Engulfing has doubled or more.
- 3 LINE STRIKE
- Show Bearish 3 Line Strike … The Bearish 3 Line Strike (3LS-Bear) is a candlestick pattern comprised of 3 bullish (green) candles, followed by a bearish engulfing candle (see 'Big A$$ Candles' below). This pattern tends to be best used as a signal of the end of a retracement period as part of a trend continuation strategy. Default: Checked
- Show Bullish 3 Line Strike … The Bullish 3 Line Strike (3LS-Bull) is a candlestick pattern comprised of 3 bearish (red) candles, followed by a bullish engulfing candle (see 'Big A$$ Candles' below). This pattern tends to be best used as a signal of the end of a retracement period as part of a trend continuation strategy. Default: Checked
- BIG A$$ CANDLES
- Show Bearish Big A$$ Candles … Bearish 'Big A$$ Candles' are the same as Bearish Engulfing candles.
- Show Bullish Big A$$ Candles … Bullish 'Big A$$ Candles' are the same as Bullish Engulfing candles.
-------------------------
本来のインジケーターに、①MTFシグナルの表示と②ローソク足の表示に2倍以上の差がある場合のみ包み足の判定を追加しました。
=== 機能説明 ===
1. MTFシグナルの表示
指定された時間足の包み足を検出します。 🍆 と 🍑 で表示されます。
2. 2倍以上の差で包み足判定
現在のローソクの実体が前のローソクの実体よりも 2 倍以上大きい場合にシグナルを表示します。マークは通常よりも大きく表示されます。
=== パラメータの説明 ===
- COMMON SETTING
- Show Signal on MTF ? … MTFシグナルを表示します
- Judge Double Engulfing ? … 包み足が前の足の2倍以上になった場合のみシグナルを発報します
- 3 LINE STRIKE
- Show Bearish 3 Line Strike … 陰線が3連続続いた後の包み足を検出します
- Show Bullish 3 Line Strike … 陽線が3連続続いた後の包み足を検出します
- BIG A$$ CANDLES
- Show Bearish Big A$$ Candles … 陽線の包み足を検出します
- Show Bullish Big A$$ Candles … 陰線の包み足を検出します
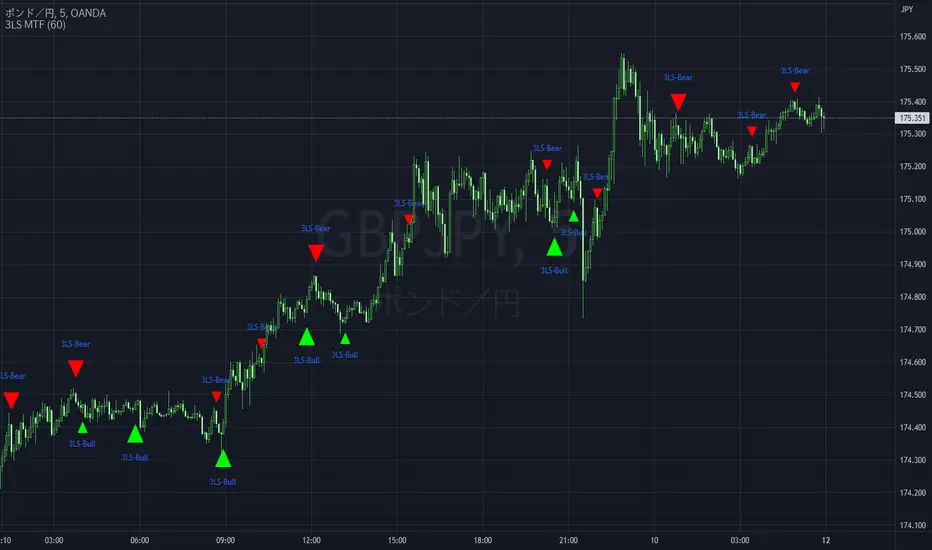
[Yorsh] BJN MTF FVG/iFVG v1.01. Executive Summary
The BJN MTF FVG/iFVG v1.0 is a highly specialized and performance-optimized tool for TradingView that provides a multi-layered view of market imbalances. Built on the modern PineScript v6, its sole purpose is to detect and display Fair Value Gaps (FVGs) from up to five user-defined higher timeframes directly onto a single chart.
In a market saturated with "all-in-one" tools that slow down trading platforms, this indicator's primary competitive advantage is its unrelenting focus on speed and clarity. It is engineered from the ground up to be a lightweight, efficient, and "noise-reducing" utility. It provides traders with essential higher-timeframe context without the lag, clutter, or performance degradation typical of other multi-timeframe (MTF) indicators.
2. Core Features Overview
The indicator is designed with a "do one thing well" philosophy, concentrating on the accurate and efficient plotting of multi-timeframe FVGs.
A. Multi-Timeframe (MTF) FVG Plotting
Up to Five Custom Timeframes: You can monitor FVGs from any five timeframes of your choice (e.g., 1m, 3m, 5m, 15m, 1H) simultaneously, all from your main trading chart. This eliminates the need to constantly switch between charts to understand the broader market structure.
Clear Labeling: Each FVG box is cleanly labeled with its corresponding timeframe (e.g., "5 ✔"), so you can instantly identify its origin and significance.
B. Intelligent FVG Validation & Sizing
Dynamic Sizing Rules: The indicator intelligently validates FVGs based on their size in points. It automatically applies a larger minimum size requirement during the volatile NY session and a smaller requirement for non-NY hours, effectively filtering out minor, insignificant gaps and focusing only on meaningful imbalances.
Validity Markers: FVGs that meet the minimum size criteria are marked with a checkmark ("✔") and extended slightly into the future, signifying them as potent support/resistance zones. Undersized FVGs are marked with an "✖" and treated as potential areas of weakness.
C. Unique "iFVG" Noise Reduction
This is a key feature for maintaining a clean chart. The indicator tracks undersized, "invalid" FVGs and waits to see how the market reacts to them.
Automatic Deletion or Recolor: When the price closes through an invalid FVG (creating an "iFVG" or inverted FVG), the user has two choices:
Delete Box (Default): The box is automatically removed from the chart. This is the "Noise Reduction" mode, designed to keep the workspace free of irrelevant, broken levels.
Recolor Box: The box is recolored to a faded gray. This option is ideal for traders who want to backtest and study how these broken, minor FVGs behave as future support or resistance.
D. Smart Visibility Options
Prevents Duplication: The indicator includes an intelligent option to automatically hide an MTF box if its timeframe matches your current chart's timeframe. This is designed to work seamlessly with a Current Timeframe (CTF) FVG indicator, preventing redundant, overlapping boxes.
3. The Performance Advantage: A Lag-Free MTF Experience
Multi-timeframe indicators are notoriously resource-intensive and are the primary cause of chart lag on TradingView. The BJN MTF FVG indicator was specifically engineered to solve this problem, making it far superior to its competitors.
Optimized timeframe.change() Trigger: Instead of recalculating its logic on every single price tick, the script only runs its intensive request.security calls when a candle closes on the specified higher timeframe. This reduces the number of calculations by over 99% compared to poorly coded MTF indicators, resulting in a dramatic performance increase.
Strict Historical Limits: The user can define a maximum history lookback (in hours or minutes) for each timeframe. For example, the 1-minute chart might only process the last 4 hours of data. This prevents the indicator from drawing thousands of historical boxes that are no longer relevant, which is the main cause of platform freezing and slow loading times.
Lightweight State Management: The script maintains a very small, active list of only the invalid FVGs it needs to monitor for inversion. Valid FVGs are simply "fire-and-forget" drawings, meaning they don't consume ongoing memory or processing power.
In short, this indicator delivers the critical higher-timeframe context traders need without ever compromising the speed and responsiveness of your trading platform.
4. Ideal User Profile
This indicator is the perfect tool for:
Day Traders and Scalpers: Who need to be aware of higher-timeframe support and resistance levels without leaving their execution chart.
SMC / ICT Traders: Who use multi-timeframe FVG confluence as a core part of their trading strategy.
Performance-Focused Traders: Anyone who has experienced chart lag from other indicators and desires a clean, fast, and reliable toolkit.
Traders Seeking Clarity: Individuals who prefer a decluttered workspace and want an indicator that intelligently removes irrelevant information.
5. Conclusion
The BJN MTF FVG/iFVG v1.0 excels through its simplicity, intelligence, and exceptional performance. It rejects the "kitchen-sink" approach of other tools and instead provides a refined, highly optimized solution to one of the most important tasks in modern trading: analyzing multi-timeframe market structure. It is a faster, cleaner, and more intelligent way to map higher-timeframe liquidity.