Vix_Fix Enhanced MTF [Cometreon]The VIX Fix Enhanced is designed to detect market bottoms and spikes in volatility, helping traders anticipate major reversals with precision. Unlike standard VIX Fix tools, this version allows you to control the standard deviation logic, switch between chart styles, customize visual outputs, and set up advanced alerts — all with no repainting.
🧠 Logic and Calculation
This indicator is based on Larry Williams' VIX Fix and integrates features derived from community requests/advice, such as inverse VIX logic.
It calculates volatility spikes using a customizable standard deviation of the lows and compares it to a moving high to identify potential reversal points.
All moving average logic is based on Cometreon's proprietary library, ensuring accurate and optimized calculations on all 15 moving average types.
🔷 New Features and Improvements
🟩 Custom Visual Styles
Choose how you want your VIX data displayed:
Line
Step Line
Histogram
Area
Column
You can also flip the orientation (bottom-up or top-down), change the source ticker, and tailor the display to match your charting preferences.
🟩 Multi-MA Standard Deviation Calculation
Customize the standard deviation formula by selecting from 15 different moving averages:
SMA (Simple Moving Average)
EMA (Exponential Moving Average)
WMA (Weighted Moving Average)
RMA (Smoothed Moving Average)
HMA (Hull Moving Average)
JMA (Jurik Moving Average)
DEMA (Double Exponential Moving Average)
TEMA (Triple Exponential Moving Average)
LSMA (Least Squares Moving Average)
VWMA (Volume-Weighted Moving Average)
SMMA (Smoothed Moving Average)
KAMA (Kaufman’s Adaptive Moving Average)
ALMA (Arnaud Legoux Moving Average)
FRAMA (Fractal Adaptive Moving Average)
VIDYA (Variable Index Dynamic Average)
This gives you fine control over how volatility is measured and allows tuning the sensitivity for different market conditions.
🟩 Full Control Over Percentile and Deviation Conditions
You can enable or disable lines for standard deviation and percentile conditions, and define whether you want to trigger on over or under levels — adapting the indicator to your exact logic and style.
🟩 Chart Type Selection
You're no longer limited to candlestick charts! Now you can use Vix_Fix with different chart formats, including:
Candlestick
Heikin Ashi
Renko
Kagi
Line Break
Point & Figure
🟩 Multi-Timeframe Compatibility Without Repainting
Use a different timeframe from your chart with confidence. Signals remain stable and do not repaint. Perfect for spotting long-term reversal setups on lower timeframes.
🟩 Alert System Ready
Configure alerts directly from the indicator’s panel when conditions for over/under signals are met. Stay informed without needing to monitor the chart constantly.
🔷 Technical Details and Customizable Inputs
This indicator includes full control over the logic and appearance:
1️⃣ Length Deviation High - Adjusts the lookback period used to calculate the high deviation level of the VIX logic. Shorter values make it more reactive; longer values smooth out the signal.
2️⃣ Ticker - Choose a different chart type for the calculation, including Heikin Ashi, Renko, Kagi, Line Break, and Point & Figure.
3️⃣ Style VIX - Change the visual style (Line, Histogram, Column, etc.), adjust line width, and optionally invert the display (bottom-to-top).
📌 Fill zones for deviation and percentile are active only in Line and Step Line modes
4️⃣ Use Standard Deviation Up / Down - Enable the overbought and oversold zone logic based on upper and lower standard deviation bands.
5️⃣ Different Type MA (for StdDev) - Choose from 15 different moving averages to define the calculation method for standard deviation (SMA, EMA, HMA, JMA, etc.), with dedicated parameters like Phase, Sigma, and Offset for optimized responsiveness.
6️⃣ BB Length & Multiplier - Adjust the period and multiplier for the standard deviation bands, similar to how Bollinger Bands work.
7️⃣ Show StdDev Up / Down Line - Enable or disable the visibility of upper and lower standard deviation boundaries.
8️⃣ Use Percentile & Length High - Activate the percentile-based logic to detect extreme values in historical volatility using a customizable lookback length.
9️⃣ Highest % / Lowest % - Set the high and low percentile thresholds (e.g., 85 for high, 99 for low) that will be used to trigger over/under signals.
🔟 Show High / Low Percentile Line - Toggle the visual display of the percentile boundaries directly on the chart for clearer signal reference.
1️⃣1️⃣ Ticker Settings – Customize parameters for special chart types such as Renko, Heikin Ashi, Kagi, Line Break, and Point & Figure, adjusting reversal, number of lines, ATR length, etc.
1️⃣2️⃣ Timeframe – Enables using SuperTrend on a higher timeframe.
1️⃣3️⃣ Wait for Timeframe Closes -
✅ Enabled – Displays Vix_Fix smoothly with interruptions.
❌ Disabled – Displays Vix_Fix smoothly without interruptions.
☄️ If you find this indicator useful, leave a Boost to support its development!
Every feedback helps to continuously improve the tool, offering an even more effective trading experience. Share your thoughts in the comments! 🚀🔥
在腳本中搜尋"mtf"

Volume pressure by GSK-VIZAG-AP-INDIA🔍 Volume Pressure by GSK-VIZAG-AP-INDIA
🧠 Overview
“Volume Pressure” is a multi-timeframe, real-time table-based volume analysis tool designed to give traders a clear and immediate view of buying and selling pressure across custom-selected timeframes. By breaking down buy volume, sell volume, total volume, and their percentages, this indicator helps traders identify demand/supply imbalances and volume momentum in the market.
🎯 Purpose / Trading Use Case
This indicator is ideal for intraday and short-term traders who want to:
Spot aggressive buying or selling activity
Track volume dynamics across multiple timeframes *1 min time frame will give best results*
Use volume pressure as a confirming tool alongside price action or trend-based systems
It helps determine when large buying/selling activity is occurring and whether such behavior is consistent across timeframes—a strong signal of institutional interest or volume-driven trend shifts.
🧩 Key Features & Logic
Real-Time Table Display: A clean, dynamic table showing:
Buy Volume
Sell Volume
Total Volume
Buy % of total volume
Sell % of total volume
Multi-Time frame Analysis: Supports 8 user-selectable custom time frames from 1 to 240 minutes, giving flexibility to analyze volume pressure at various granularities.
Color-Coded Volume Bias:
Green for dominant Buy pressure
Red for dominant Sell pressure
Yellow for Neutral
Intensity-based blinking for extreme values (over 70%)
Dynamic Data Calculation:
Uses volume * (close > open) logic to estimate buy vs sell volumes bar-by-bar, then aggregates by timeframe.
⚙️ User Inputs & Settings
Timeframe Selectors (TF1 to TF8): Choose any 8 timeframes you want to monitor volume pressure across.
Text & Color Settings:
Customize text colors for Buy, Sell, Total volumes
Choose Buy/Sell bias colors
Enable/disable blinking for visual emphasis on extremes
Table Appearance:
Set header color, metric background, and text size
Table positioning: top-right, bottom-right, etc.
Blinking Highlight Toggle: Enable this to visually highlight when Buy/Sell % exceeds 70%—a sign of strong pressure.
📊 Visual Elements Explained
The table has 6 rows and 10 columns:
Row 0: Headers for Today and TF1 to TF8
Rows 1–3: Absolute values (Buy Vol, Sell Vol, Total Vol)
Rows 4–5: Relative percentages (Buy %, Sell %), with dynamic background color
First column shows the metric names (e.g., “Buy Vol”)
Cells blink using alternate background colors if volume pressure crosses thresholds
💡 How to Use It Effectively
Use Buy/Sell % rows to confirm potential breakout trades or identify volume exhaustion zones
Look for multi-timeframe confluence: If 5 or more TFs show >70% Buy pressure, buyers are in control
Combine with price action (e.g., breakouts, reversals) to increase conviction
Suitable for equities, indices, futures, crypto, especially on lower timeframes (1m to 15m)
🏆 What Makes It Unique
Table-based MTF Volume Pressure Display: Most indicators only show volume as bars or histograms; this script summarizes and color-codes volume bias across timeframes in a tabular format.
Customization-friendly: Full control over colors, themes, and timeframes
Blinking Alerts: Rare visual feature to capture user attention during extreme pressure
Designed with performance and readability in mind—even for fast-paced scalping environments.
🚨 Alerts / Extras
While this script doesn’t include TradingView alert functions directly, the visual blinking serves as a strong real-time alert mechanism.
Future versions may include built-in alert conditions for buy/sell bias thresholds.
🔬 Technical Concepts Used
Volume Dissection using close > open logic (to estimate buyer vs seller pressure)
Simple aggregation of volume over custom timeframes
Table plotting using Pine Script table.new, table.cell
Dynamic color logic for bias identification
Custom blinking logic using na(bar_index % 2 == 0 ? colorA : colorB)
⚠️ Disclaimer
This indicator is a tool for analysis, not financial advice. Always backtest and validate strategies before using any indicator for live trading. Past performance is not indicative of future results. Use at your own risk and apply proper risk management.
✍️ Author & Signature
Indicator Name: Volume Pressure
Author: GSK-VIZAG-AP-INDIA
TradingView Username: prowelltraders

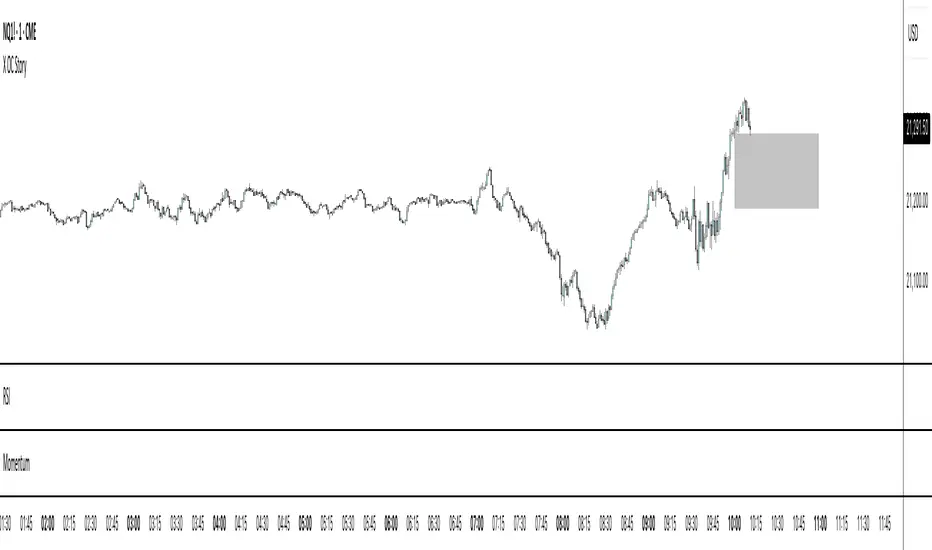
X OC StoryOverview
The "X OC Story" is a Pine Script indicator that visualizes the Open-Close range of a higher timeframe (HTF) candle on a lower timeframe chart. By plotting dynamic lines to represent the open and close prices of the previous HTF bar, this tool gives traders a clearer context of recent market sentiment and structural shifts. It includes color-coded visual fills to distinguish between bullish and bearish candles and offers the option to display only the most recent range.
Concept
1. Multi-Timeframe Analysis (MTF)
At its core, this indicator utilizes multi-timeframe analysis by requesting open, high, low, and close values from a user-defined HTF (input.timeframe('60')) and applying them to a lower timeframe chart. This allows traders to incorporate higher timeframe information without switching chart intervals.
2. Timeframe Change Detection
The indicator detects when a new HTF candle begins which lets the script know when to capture and visualize a new set of HTF open-close values.
3. Encapsulation with Custom Type (candles)
The script defines a custom type candles to encapsulate OHLC values of the previous HTF candle. This improves code readability and structure by keeping all relevant HTF data in a single object.
4. Dynamic Line Drawing
When a new HTF candle is detected, two horizontal lines are drawn for Open and Close. These are updated dynamically on each bar to extend across the entire HTF candle range on the lower timeframe chart.
5. Visual Highlighting
a shaded area is drawn between the open and close lines which help highlight market structure without overwhelming the chart.
6. Selective Persistence of Drawings
Users can enable deleteOld to show only the most recent HTF open-close range. When enabled, previously drawn lines are tracked in an array and deleted upon creation of a new range, keeping the chart clean and focused.
How a Trader Might Use This Tool
Contextual Decision-Making
This indicator helps traders see where the market is trading relative to the previous HTF candle:
Trading above the HTF close may suggest bullish continuation
Trading below the HTF open may indicate a bearish reversal or breakdown
Confluence Zones
The open and close lines of HTF candles often act as support/resistance levels. A trader might:
Watch for rejections or breakouts at these levels
Use them in confluence with intraday setups or trend indicators
Scalping or Intraday Strategy Support
Since this visual is drawn on a lower timeframe (like 5m or 15m), it’s particularly useful for scalpers or day traders who want to factor in HTF sentiment without leaving their active chart.
Cleaner Charting
With the optional setting to display only the most recent range (deleteOld), traders avoid clutter and focus on the current actionable zone.
Summary
“X OC Story” is a clean, visual, and effective multi-timeframe utility that helps traders:
Identify HTF open-close context
Highlight possible support/resistance zones
Analyze sentiment and structure visually
It’s an excellent addition to any discretionary trader’s toolkit for improved context awareness and informed entries or exits.
EWMA & EWVar + EWStd Expansion with MTF_V.5EWMA & EWVar + EWStd Expansion with MTF_V.5
This indicator combines adaptive trend smoothing (EWMA), variance estimation (EWVar) and dynamic volatility “bursts” (EWStd Expansion) with optional higher-timeframe confirmation. It’s designed both for visual chart analysis and for automated alerts on regime changes.
Key Features
EWMA (Exponential Smoothing):
• Computes an exponential moving average with either a custom α or a length-derived α = 2/(N+1).
• Option to recalculate only every N bars (reduces CPU load).
EWVar & EWStd (Variance & Standard Deviation):
• Exponentially weighted variance tracks recent price dispersion.
• EWStd (σ) is computed alongside the EWMA.
• Z-score (deviation in σ units) shows how far price has diverged from trend.
Multi-Timeframe Filter (MTF):
• Optionally require the same trend direction on a chosen higher timeframe (e.g. Daily, Weekly, H4).
• Real-time lookahead available (may repaint).
Gradient Around EWMA:
• A multi-layer “glow” zone of ±1σ, broken into up to 10 steps.
• Color interpolates between “upper” and “lower” shades for bullish, bearish and neutral regimes.
Instantaneous Trendline (ITL):
• Ultra-fast trend filter with slope-based coloring.
• Highlights micro-trends and short-lived accelerations.
Cross-Over Signals (ITL ↔ EWMA):
• Up/down triangles plotted when the ITL crosses the main EWMA.
EWStd Expansion (Volatility Bursts):
• Automatically detects σ expansions (σ growth above a set % threshold).
• Price filter: only when price moves beyond EWMA ± (multiplier·σ).
• Optional higher-timeframe confirmation.
Labels & Alerts:
• Text labels and circular markers on bars where a volatility burst occurs.
• Built-in alertcondition calls for both bullish and bearish expansions.
How to Use
Visual Analysis:
• The gradient around EWMA shows the width of the volatility channel expanding or contracting.
• ITL color changes instantly highlight short-term impulses.
• EWMA line color switches (bullish/bearish/neutral) indicate trend state.
Spotting Volatility Breakouts:
• “EWStd Expansion” labels and circles signal the onset of strong moves when σ spikes.
• Useful for entering at the start of new impulses.
Automated Alerts:
• Set alerts on the built-in conditions “Bullish EWStd Expansion Alert” or “Bearish EWStd Expansion Alert” to receive a popup or mobile push when a burst occurs.
This compact tool unifies trend, volatility and multi-timeframe analysis into a single indicator—ideal for traders who want to see trend direction, current dispersion, and timely volatility burst signals all at once.

[TehThomas] - Fair Value GapsThis script is designed to automatically detect and visualize Fair Value Gaps (FVGs) on your chart in a clean, intuitive, and highly responsive way. It’s built with active traders in mind, offering both dynamic updates and customization options that help you stay focused on price action without being distracted by outdated or irrelevant information.
What Are Fair Value Gaps?
Fair Value Gaps are areas on a chart where there’s an inefficiency in price, typically formed when price moves aggressively in one direction, leaving a gap between the wicks of consecutive candles. These gaps represent imbalanced price action where not all buy or sell orders were efficiently matched. As a result, they often become magnet zones where price returns later to "fill" the imbalance before continuing in its intended direction. Many traders use them as points of interest for entries, re-entries, or anticipating reversals and consolidations.
This concept is frequently used in Smart Money and ICT-based trading models, where understanding how price seeks efficiency is crucial to anticipating future moves. When combined with concepts like liquidity, displacement, and market structure, FVGs become powerful tools for technical decision-making.
Script Features & Functionality
1. Live Updating Gaps (Dynamic Shrinking)
One of the core features of this script is its ability to track and dynamically shrink Fair Value Gaps as price trades into them. Instead of leaving a static zone on your chart, the gap will adjust in real-time, reflecting the portion that has been filled. This gives you a much more accurate picture of remaining imbalance and avoids misleading zones.
2. Automatic Cleanup After Fill
Once price fully fills an FVG, the script automatically removes it from the chart. This helps keep your workspace clean and focused only on relevant price zones. There’s no need to manually manage your gaps, everything is handled behind the scenes to reduce clutter and distraction.
3. Static Mode Option
While dynamic updating is the default, some traders may prefer to keep the original size of the gap visible even after partial fills. For that reason, the script includes a toggle to switch from live-updating (shrinking) mode to static mode. In static mode, FVGs stay fixed from the moment they are drawn, giving you a more traditional visual reference point.
4. Multi-Timeframe Support (MTF)
You can now view higher timeframe FVGs, such as those from the 1H or 4H chart, while analyzing lower timeframes like the 5-minute. This allows you to see key imbalances from broader market context without having to flip between charts. FVGs from higher timeframes will be drawn distinctly so you can differentiate them at a glance.
5. Cleaner Visualization
The script is designed with clarity in mind. All drawings are streamlined, and filled gaps are removed to maintain a minimal, distraction-free chart. This makes it easier to combine this tool with other indicators or price-action-based strategies without overloading your workspace.
6. Suitable for All Market Types
This script can be used on any asset that displays candlestick-based price action — including crypto, forex, indices, and stocks. Whether you're scalping low-timeframe setups or swing trading with a higher timeframe bias, FVGs remain a useful concept and this script adapts to your trading style.
Use Case Examples
On a 5-minute chart, display 1-hour FVGs to catch major imbalance zones during intraday trading.
Combine the FVGs with liquidity levels and inducement patterns to build ICT-style trade setups.
Use live-updating gaps to monitor in-progress fills and evaluate whether a zone still holds validity.
Set the script to static mode to perform backtesting or visual replay with historical setups.
Final Notes
Fair Value Gaps are not a standalone trading signal, but when used with market structure, liquidity, displacement, and order flow concepts, they provide high-probability trade locations that align with institutional-style trading models. This script simplifies the visualization of those zones so you can react faster, stay focused on clean setups, and eliminate unnecessary distractions.
Whether you’re trading high volatility breakouts or patiently waiting for retracements into unfilled imbalances, this tool is designed to support your edge with precision and flexibility.

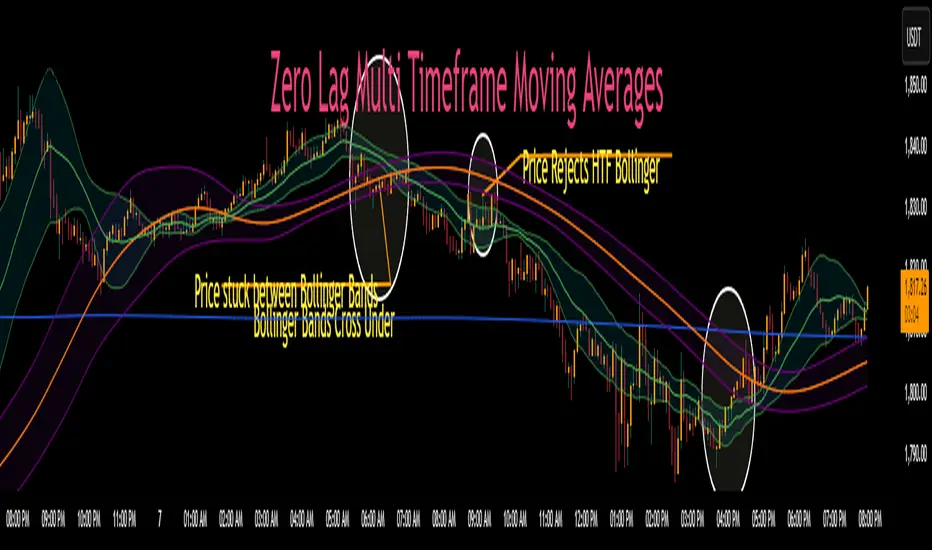
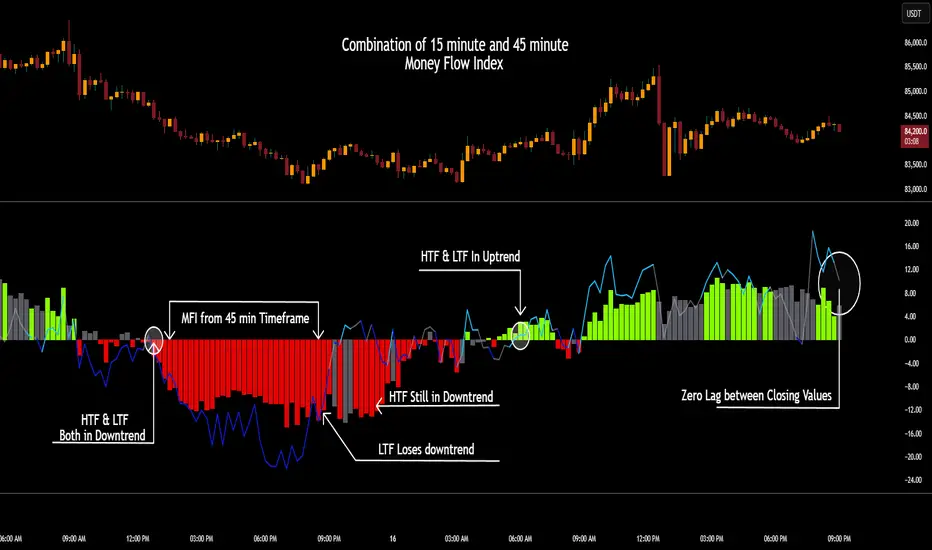
Zero Lag MTF Moving Average by CoffeeshopCryptoBased on Moving Average Types supplied by @TradingView www.tradingview.com
Ideas and code enhanced to show higher timeframe by @CoffeeShopCrypto
It’s time to take the guesswork out of moving averages and multiple timeframes when day trading. Moving averages are a cornerstone of many trading strategies, often viewed as dynamic support and resistance levels. Traders rely on these levels to anticipate price reactions, whether it’s a bounce in a trending market or a reversal in a ranging one. Additionally, the direction and alignment of multi timeframe moving averages—whether they’re moving in the same direction or diverging—provide critical clues about market momentum and potential reversals. However, the traditional higher timeframe moving average indicators force traders to wait for higher timeframe candles to close, creating lag and missed opportunities.
The Old Way
For example: If you are on a 5 minute chart and you want to observe the location and direction of a 30 minute chart Moving Average, you'll need to wait for a total of 6 candles to close, and again every 6 candles after that. This only creates more lag.
The New Way
Now there is no waiting for high timeframe session candles to close. No matter what timeframe Moving Average you want to know about, this indicator will show you its location on your current chart at any time in real time.
For those who prefer Bollinger Bands, this indicator adds a whole new dimension to your strategy. Traders often wait for price action to break outside the lower time frame Bollinger bands before considering a trade, while still seeking key support or resistance levels beyond them. But if you don't know the position of your higher time frame Bollinger, you could be trading into a trap. With Zero Lag Multi Timeframe Moving Average, you can view both your current and higher timeframe Bollinger Bands simultaneously with zero waiting. This lets you instantly see when price action is traveling between the bands of either timeframe or breaking through both—indicating a strong trend in that direction. Additionally, when both sets of Bollinger Bands overlap at the same price levels, it highlights areas of strong consolidation and ranging conditions, giving you a clear picture of market dynamics. This is a key element in price action that tells you there is currently no direction to the market and both the current and higher time frames are flat.
Enter Zero Lag Multi Timeframe Moving Average—the ultimate tool for real-time higher timeframe moving averages and Bollinger Bands. This innovative indicator eliminates the delay, delivering instant, precise values for higher timeframe averages and bands, even on open candles. Seamlessly combining current and higher timeframe data, it allows traders to identify key moments where moving averages or Bollinger Bands align or diverge, signaling market conditions. Whether you’re gauging the strength of a trend, pinpointing potential reversals, or identifying consolidation zones, Zero Lag Multi Timeframe Moving Average gives you the clarity needed to make better trading decisions according to market conditions.
Why is this "Mashup" of moving averages different and important?
Honestly its really about the calculation thats imported through the "import library" function.
Heres what it does:
The ZLMTF-MA is designed to help traders easily see where higher timeframe moving averages and Bollinger Bands are—without needing to switch chart timeframes or wait for those larger candles to close. It works by adjusting common moving average types like SMA, EMA, and VWMA to show what they would look like if they were based on a higher timeframe, right on your current chart. This helps users stay focused on their main timeframe while still having a clear view of the bigger picture, making it easier to spot trend direction, key support and resistance levels, and overall market structure. The goal is to keep things simple, fast, and more visually informative for everyday traders.
Bollinger Bands
When working with Bollinger Bands, a common strategy is to take the trades once price action has escaped through the top or bottom of your current Bollinger Band.
A false breakout occurs when both Bollinger Bands are not moving in the same direction as eachother or when they are overlapping.
Moving Averages as Support and Resistance:
Traders who use Moving Averages as support or resistance, looking for rejections or failures of these areas can now see multiple timeframe price action instantly and simultaneously.
Trading Setup Examples:
Price Action Scenario 1:
Higher Timeframe Ranging-
When price action breaks through a current moving average headed toward a higher timeframe moving average, trades are taken with caution if the moving averages are converging.
Price Action Scenario 2:
Strong Trending Market -
If the moving averages are in the same direction, and your price action is now leading the low timeframe moving average, you have re-entered a strong trend.
Price Action Scenario 3:
High Timeframe Rejections -
If you have a rejection of a higher timeframe moving average, and your both averages are still diverging, this is the end of a pullback as you re-enter a strong trend in the original direction
Price Action Scenario 4:
Trend Reversals -
If you close beyond both the low and high timeframe moving averages, you can consider that price action is strong enough to change direction here and you should prepare for trade setups in the opposite direction of the previous.
HTF MA Label Information:
Even if your high timeframe moving average is turned off, you can still see this label.
It gives you a quick reminder of what high timeframe settings you have used to see MA values.
6 Dynamic EMAs by Koenigsegg🚀 6 Dynamic EMAs by Koenigsegg
Take control of your chart with ultimate flexibility. This tool gives you 6 customizable EMAs across any timeframe, helping you read the market like a pro — whether you're scalping seconds or swinging days. Built for precision, designed for dominance.
The combinations? Endless. Mix and match any EMA lengths and timeframes for tailored confluence — exactly how elite traders operate.
🔑 Key Features
✅ 6 Fully Customizable EMAs
⏳ Multi-Timeframe Support (from seconds to months)
🎨 Custom Colors & Thickness for each EMA
🚨 Built-in Cross Alerts for instant trade signals
🧠 Clean, efficient logic using request.security()
🔁 Dynamically toggle EMAs on/off
⚙️ Lightweight for smooth chart performance
🧩 Endless combo potential — confluence on your terms
📈 What Is an EMA?
The EMA is a type of moving average that adjusts more quickly to recent price changes than a Simple Moving Average (SMA). It does this by giving exponentially more weight to the most recent candles.
⚙️ How Does It Function?
Smoothing Price Data:
It takes the average of closing prices over a chosen period (like 20 or 50 candles), but gives more influence to the latest prices.
Reacts Quickly to Price Shifts:
Since recent data is weighted more heavily, the EMA adjusts faster to sudden price changes — helping you spot trend reversals or momentum shifts earlier.
Dynamic Support & Resistance:
Traders often use EMAs as moving support/resistance levels. Price often "respects" EMAs in trending markets — bouncing off them during pullbacks.
Trend Confirmation:
- If price is above the EMA, the market is likely in an uptrend.
- If price is below the EMA, the market is likely in a downtrend.
- Multiple EMAs (like 12/21 or 50/200) crossing each other are used for entry/exit signals.
💡 Example:
If you use a 21 EMA on a chart, it shows you the average price of the last 21 candles, but the most recent ones weigh heavier. This makes the EMA more responsive than an SMA, and better for short-term or active trading.
📊 Why EMAs Matter — and How Multi-Timeframe EMAs Give You the Edge
Exponential Moving Averages (EMAs) are essential tools for identifying trend direction, momentum shifts, and dynamic support/resistance. Because they weight recent price data more heavily, EMAs adapt quickly to changing market conditions, giving traders early insight into reversals or continuations.
Where this script shines is in its multi-timeframe (MTF) capability. For example, plotting a daily EMA on a 4H chart gives you high-level directional guidance while still allowing precision entries. This enables confluence between LTF (low timeframe) signals and HTF (high timeframe) momentum — a crucial edge used by institutional-level traders.
You can configure the tool to run classic combos like the 12/21 crossover on your current chart, while layering in a 50 or 200 EMA from a higher timeframe for macro confirmation. The 6th EMA, colored light blue by default, is perfect for adding one final level of structure insight — often used as a long-term anchor or trend bias marker.
Whether you're riding the wave or catching the reversal, these EMAs serve as your adaptable compass in every environment.
🎯 Purpose
This indicator was built to give traders a clear, responsive, and multi-timeframe edge using dynamic Exponential Moving Averages. Whether you're trend-following, identifying momentum shifts, or building a confluence system — these 6 EMAs are here to align with your strategy and style.
💡 Pro Tip
Instead of cluttering your chart with multiple EMA indicators, this script consolidates all into one sleek tool. You can toggle off bands you don't currently need, like running only the 12/21 EMAs on your active chart timeframe, while adding the 12/21 EMAs from a higher timeframe to guide trade decisions.
With this setup, you're not just reacting — you're orchestrating your trades with intention.
⚠️ Disclaimer
This script is for educational and informational purposes only. It does not constitute financial advice. Always do your own research and trade responsibly. Past performance does not guarantee future results.

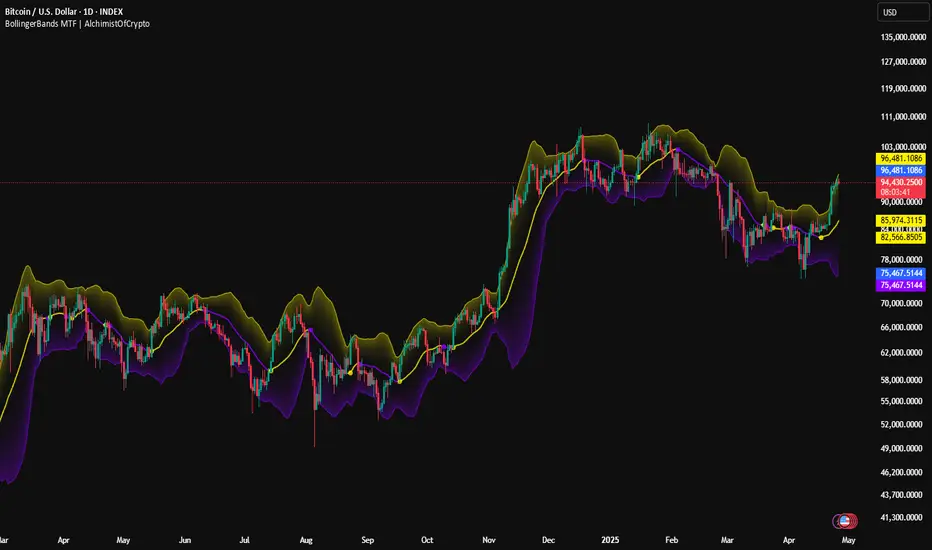
BollingerBands MTF | AlchimistOfCrypto🌌 Bollinger Bands – Unveiling Market Volatility Fields 🌌
"The Bollinger Bands, reimagined through quantum mechanics principles, visualizes the probabilistic distribution of price movements within a multi-dimensional volatility field. This indicator employs principles from wave function mathematics where standard deviation creates probabilistic boundaries, similar to electron cloud models in quantum physics. Our implementation features algorithmically enhanced visualization derived from extensive mathematical modeling, creating a dynamic representation of volatility compression and expansion cycles with adaptive glow effects that highlight the critical moments where volatility phase transitions occur."
📊 Professional Trading Application
The Bollinger Bands Quantum transcends traditional volatility measurement with a sophisticated gradient illumination system that reveals the underlying structure of market volatility fields. Scientifically calibrated for multiple timeframes and featuring eight distinct visual themes, it enables traders to perceive volatility contractions and expansions with unprecedented clarity.
⚙️ Indicator Configuration
- Volatility Field Parameters 📏
Python-optimized settings for specific market conditions:
- Period: 20 (default) - The quantum time window for volatility calculation
- StdDev Multiplier: 2.0 - The probabilistic boundary coefficient
- MA Type: SMA/EMA/VWMA/WMA/RMA - The quantum field smoothing algorithm
- Visual Theming 🎨
Eight scientifically designed visual palettes optimized for volatility pattern recognition:
- Neon (default): High-contrast green/red scheme enhancing volatility transition visibility
- Cyan-Magenta: Vibrant palette for maximum volatility boundary distinction
- Yellow-Purple: Complementary colors for enhanced compression/expansion detection
- Specialized themes (Green-Red, Forest Green, Blue Ocean, Orange-Red, Grayscale): Each calibrated for different market environments
- Opacity Control 🔍
- Variable transparency system (0-100) allowing seamless integration with price action
- Adaptive glow effect that intensifies during volatility phase transitions
- Quantum field visualization that reveals the probabilistic nature of price movements
🚀 How to Use
1. Select Visualization Parameters ⏰: Adjust period and standard deviation to match market conditions
2. Choose MA Type 🎚️: Select the appropriate smoothing algorithm for your trading strategy
3. Select Visual Theme 🌈: Choose a color scheme that enhances your personal pattern recognition
4. Adjust Opacity 🔎: Fine-tune visualization intensity to complement your chart analysis
5. Identify Volatility Phases ✅: Monitor band width to detect compression (pre-breakout) and expansion (trend)
6. Trade with Precision 🛡️: Enter during band contraction for breakouts, or trade mean reversion using band boundaries
7. Manage Risk Dynamically 🔐: Use band width as volatility-based position sizing parameter
[blackcat] L3 Projected Magic-9 SequenceOVERVIEW
The L3 Projected Magic-9 Sequence indicator is a sophisticated tool designed to help traders identify potential trend reversals through a unique sequence of price movements. By calculating projected highs and lows based on previous bar conditions, this script provides valuable insights into possible future market directions. It plots these key levels on the chart and highlights specific sequential patterns that often precede significant reversals, offering traders a visual advantage in their decision-making process 📈💡.
FEATURES
Projections: Calculates and plots projected highs and lows based on intricate conditions derived from previous bars' open, close, high, and low prices. These projections serve as dynamic support and resistance levels, helping traders anticipate potential turning points in the market 📊.
Sequential Patterns:
Identifies various sequential patterns known as "Magic" sequences, such as Magic-9 and Magic-13.
Labels these sequences directly on the chart for easy identification: 5, 6, 7, 8, 9, 12, 13 for both bullish and bearish trends.
Provides additional labels when these sequences align with projected highs or lows, enhancing the reliability of the signal 🏷️.
Differentiates between trend and sideways phases using the Magic-9 Project Range. Traditional sequences generating buy and sell signals of 9 and 13 during sideways swings are displayed indistinguishably from other numbers. However, the 9 and 13 generated by breakouts are highlighted with red and green labels for better visibility 🚦.
Project Range Adjustment:
The Project Range is automatically adjusted by Multiple Time Frame (MTF).
A higher cycle is selected as the baseline of the Project Range based on the current operating cycle, ensuring adaptability to varying market conditions ⏳.
Customization:
Offers customizable colors for plotted lines and labels, allowing users to tailor the appearance to their preferences 🎨.
Adjustable settings for lookback periods and other parameters to fine-tune the indicator according to individual trading styles.
Automatic Timeframe Selection:
Automatically selects the most suitable timeframe for data fetching, ensuring optimal performance across different chart intervals ⏳.
Ensures compatibility with various trading strategies, whether short-term intraday or long-term positional trading.
HOW TO USE
Adding the Indicator:
Open your TradingView platform and navigate to the chart where you want to apply the indicator.
Click on the "Indicators" button at the top of the screen and search for L3 Projected Magic-9 Sequence.
Select the indicator from the list and add it to your chart.
Understanding Projections:
Once added, observe the plotted projected highs and lows on your chart.
These lines represent anticipated support and resistance levels based on complex calculations involving previous bar data.
Identifying Sequential Patterns:
Look for labels such as 5, 6, 7, 8, 9, 12, and 13 appearing on the chart.
These labels signify specific sequential patterns that often precede market reversals.
Pay special attention to labels that include arrows (e.g., 9▼, 13▲), indicating alignment with projected highs or lows.
Note the differentiation between trend and sideways phases:
During sideways swings, traditional sequences generating buy and sell signals of 9 and 13 are displayed indistinguishably from other numbers.
Breakout-generated 9 and 13 are highlighted with red and green labels for clear identification.
Combining with Other Tools:
While the L3 Projected Magic-9 Sequence offers powerful insights, it is essential to combine its signals with other technical analysis tools.
Use moving averages, volume indicators, or candlestick patterns to confirm the validity of the identified sequences before executing trades.
LIMITATIONS
Market Conditions: The indicator performs best in trending markets but may generate false signals during periods of consolidation or range-bound movement 🌐.
Complexity: Due to its reliance on specific sequential patterns, some traders might find the concept challenging to grasp initially. Thorough testing and understanding are crucial before deploying it in live trading environments.
Data Dependency: Accurate projections depend on having sufficient historical data. Insufficient data may lead to less reliable results.
NOTES
Backtesting: Before implementing the indicator in real-time trading, conduct extensive backtesting to evaluate its effectiveness under various market conditions.
Risk Management: Always adhere to proper risk management principles, even when relying on robust indicators like this one. Set stop-loss orders and position sizes accordingly to protect your capital 🛡️.
Continuous Learning: Stay updated with the latest developments and adjustments made to the indicator by following community discussions and official updates from the author.

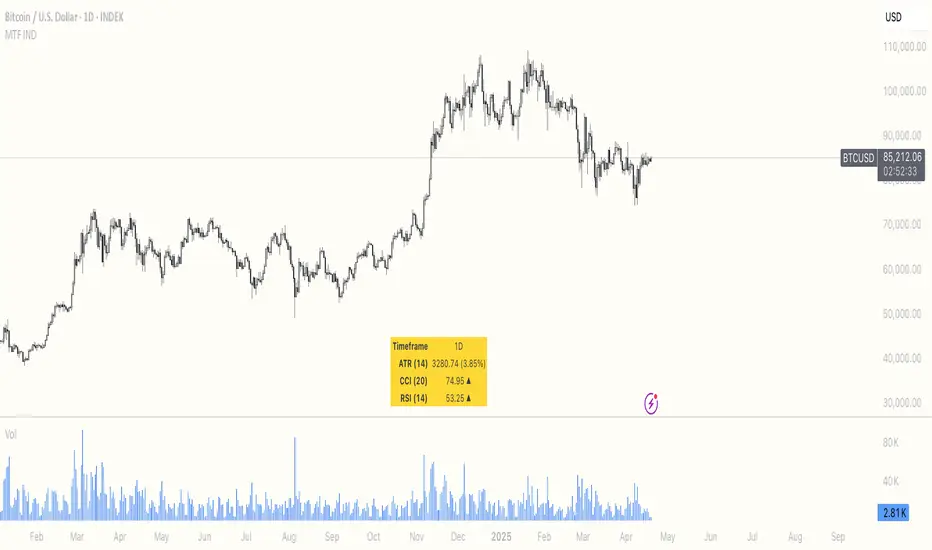
Multi Timeframe ATR, CCI & RSIMulti Timeframe ATR, CCI & RSI (MTF IND)
This indicator displays ATR, CCI, and RSI values from a custom selected timeframe in a clean table overlay.
It helps monitor volatility and momentum from higher/lower timeframes directly on your current chart.
Features:
• Select custom timeframe for all indicators (e.g., 1D, 1W, 65m, etc.)
• ATR with selectable smoothing type (RMA, SMA, EMA, WMA)
• CCI & RSI with trend arrows (▲ rising, ▼ falling, ▬ neutral)
• Compact summary table
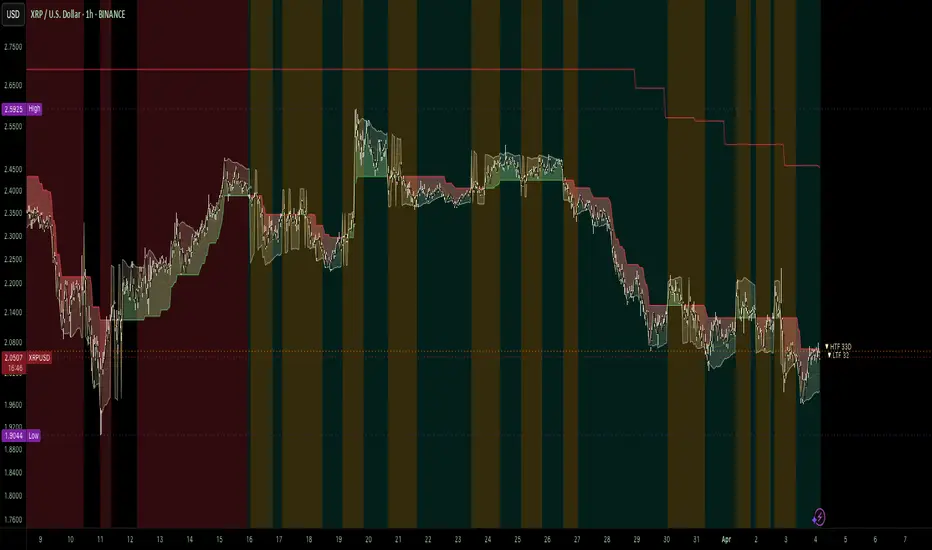
CSCMultiTimeframeToolsLibrary "CSCMultiTimeframeTools"
Calculates instant higher timeframe values for higher timeframe analysis with zero lag.
getAdjustedLookback(current_tf_minutes, higher_tf_minutes, length)
Calculate adjusted lookback period for higher timeframe conversion.
Parameters:
current_tf_minutes (int) : Current chart timeframe in minutes (e.g., 5 for 5m).
higher_tf_minutes (int) : Target higher timeframe in minutes (e.g., 15 for 15m).
length (int) : Base length value (e.g., 14 for RSI/MFI).
Returns: Adjusted lookback period (length × multiplier).
Purpose and Benefits of the TimeframeTools Library
This library is designed to solve a critical pain point for traders who rely on higher timeframe (HTF) indicator values while analyzing lower timeframe (LTF) charts. Traditional methods require waiting for multiple candles to close—for example, to see a 1-hour RSI on a 5-minute chart, you’d need 12 closed candles (5m × 12 = 60m) before the value updates. This lag means missed opportunities, delayed signals, and inefficient decision-making.
Why Traders Need This
Whether you’re scalping (5M/15M) or swing trading (1H/4H), this library bridges the gap between timeframes, giving you HTF context in real time—so you can act faster, with confidence.
How This Library Eliminates the Waiting Game
By dynamically calculating the adjusted lookback period, the library allows:
Real-time HTF values on LTF charts – No waiting for candle closes.
Accurate conversions – A 14-period RSI on a 1-hour chart translates to 168 periods (14 × 12) on a 5-minute chart, ensuring mathematical precision.
Flexible application – Works with common indicators like RSI, MFI, CCI, and moving averages (though confirmations should be done before publishing under your own secondary use).
Key Advantages Over Manual Methods
Speed: Instantly reflects HTF values without waiting for candle resolutions.
Adaptability: Adjusts automatically if the user changes timeframes or lengths.
Consistency: Removes human error in manual period calculations.
Limitations to Note
Not a magic bullet – While it solves the lag issue, traders should still:
Validate signals with price action or additional confirmations.
Be mindful of extreme lookback lengths (e.g., a 200-period daily SMA on a 1-minute chart requires 28,800 periods, which may strain performance).
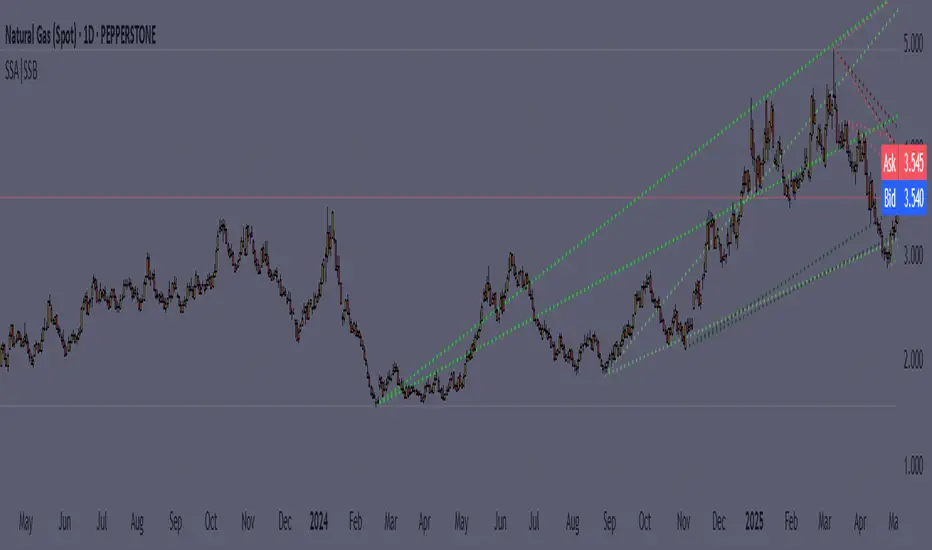
Dynamic Support|Resistance SSA & SSBHello, traders. I offer you an indicator to complement the Ichimoku Kinho Hyo trading system. This indicator determines possible dynamic resistance and support levels based on pivots and end points of the Senkou Span A and Senkou Span B lines.
You determine the pivots yourself, choosing how many bars back to look for HIGH and LOW.
Attention! Unlike the classical theory of Goichi Hosoda: the levels are dynamic, that is, they change values with each new bar!
Also added is the MTF function for displaying levels from different time frames.
Accumulation-Distribution CandlesThis structural visualization tool maps each candle through the lens of Effort vs. Result, blending Volume, Range, and closing bias into a normalized pressure score. Candle bodies are dynamically color-coded using a five-tier system—from heavy accumulation to heavy distribution—revealing where energy is building, dispersing, or neutral. This helps to visually isolate Markup, Markdown, Re-accumulation, and Distribution at a glance.
The indicator calculates a strength score by multiplying price result (close minus open) by effort (volume or price range), smoothing this raw value using a Fibonacci-based EMA. (34 for standard, 55 for crypto; the higher crypto value acknowledges that 24/7 trading offers more hours per week or month than trad markets.) The result is standardized against its rolling deviation and clamped to a range. This score determines the visual tier:
• 💙 Dark Blue = heavy Accumulation (strong upward result on strong effort)
• 🩵 Pale Blue = mild Accumulation
• 🌚 Gray = neutral (low conviction or balance)
• 💛 Pale Yellow = mild Distribution
• 🧡 Deep Yellow = heavy Distribution (strong downward result on strong effort)
The tool is optimized for the 1D chart, where Wyckoff phases are most clearly expressed. However, it adapts well to lower timeframes when used selectively. Traders may hide the body coloring and enable only zone highlighting to preserve other candle overlays such as SUPeR TReND 2.718, which offers directional clarity and trend duration. This combination is especially useful on intraday charts (15m–1H) where microstructure matters but visual clutter must be avoided.
When used alongside other Volume overlays (such as the OBVX Conviction Bias) or Volatility indicators (such as the Asymmetric Turbulence Ribbon (ATR)), this indicator adds confluence to directional setups by contextualizing pressure with Volatility. For example: compression zones marked by ATR may align with persistent pale blue candles—indicating quiet Accumulation before expansion.
Optional Overlays:
Normally ON -
• 📌 Pin Bars , filtered by volume, to isolate wick-dominant reversals from key zones
• 💪🏻 Strong-Body Candles — fuchsia candles w/ high body-to-range ratio reflect conviction
• 🧯 Wick Absorption Candles — red candles w/ long wicks and low closing strength indicate failed pushes or absorbed breakouts
• 🟦/🟧 Zone Highlighting for candles above a defined Accumulation/Distribution threshold
Normally OFF -
• 🔺 Fractals (5-bar) to map swing pivots by underlying pressure tier (normally OFF)
• 🟥/🟩 Engulfing patterns, filtered by directional conviction (normally OFF)
The Pin Bar strategy benefits most from the zone logic—when a bullish pin bar appears in an Accumulation zone (esp. pale or dark blue), and Volume exceeds its rolling average, it may mark a spring or failed breakdown. Conversely, bearish pins in Distribution zones can mark rejection or resistance.
This is not a signal engine—it’s a narrative filter designed to slot cleanly into a multi-layered workflow of visual structure and informed execution. Use it to identify bias and phase. Then deploy trade triggers from tools like SUPeR TReND 2.718, or the liquidity flows shown the The Silver Lining or the AltSeasonality - MTF indicators, for example. The candle colors tell you who’s in control—the other tools tell you when to act.
SUPeR TReND 2.718An evolved version of the classic Supertrend, SUPeR TReND 2.718 is built to deliver elegant, high-precision trend detection using Euler's constant (e = 2.718) as its default multiplier. Designed for clarity and visual flow, this indicator brings together smooth line work, intelligent color logic, and a minimalistic tally system that tracks trend persistence — all in a highly customizable, overlay-ready format.
Unlike traditional implementations, this version maintains line visibility regardless of fill opacity, ensuring crisp tracking even in complex environments. Ideal for traders who value both aesthetics and actionable structure.
__________________________________________________________
🔑 Key Features:
- 📐 ATR-based Supertrend with default multiplier = e (2.718)
- 📉 Dynamic trend line with optional fill beneath price
- ⏳ Trend duration tally label (count-only or full format)
- ⬆️ Higher-timeframe Supertrend overlay (optional)
- 🟢 Directional candle coloring for clarity
- 🟡 Subtle anchor line to guide perception without clutter
- ⚙️ PineScript v6 compliant, efficient and modular
__________________________________________________________
🧠 Interpretation Guide:
- The Supertrend line tracks trend support or resistance — beneath price in uptrends, above in downtrends.
- The shaded fill reflects direction with 70% transparency.
- The trend tally label counts how long the current trend has lasted.
- Candle colors confirm direction without overtaking price action.
- The optional HTF line shows higher-timeframe context.
- A soft yellow anchor line stabilizes the fill relationship without distraction.
__________________________________________________________
⚙️ Inputs & Controls:
- ✏️ ATR Length – Volatility lookback
- 🧮 Multiplier – Default = 2.718 (Euler's number)
- 🕰️ Higher Timeframe – Choose your bias frame
- 👁️ Show HTF / Main – Toggle each trend layer
- 🧾 Show Label / Simplify – Show trend duration, with or without arrows
- 🎨 Color Candles – Turn directional bar coloring on or off
- 🪄 Show Fill – Toggle the shaded visual rhythm
- 🎛️ All visuals use tuned colors and transparencies for clarity
__________________________________________________________
🚀 Best Practices:
- ✅ Works on any time frame; shines on 1h v. 1D
- 🔁 Use the HTF line for macro bias filtering
- 📊 Combine with volume or liquidity overlays for edge
- 🧱 Use as a structural base layer with minimalist stacks
__________________________________________________________
📈 Strategy Tips:
- 🧭 MTF Trend Alignment: Enable the HTF line to filter trades. If the HTF trend is up, only take longs on the lower frame, and vice versa.
- 🔁 Pullback Entries: During a strong trend, consider short-term dips below the Supertrend line as possible re-entry zones — only if HTF remains aligned.
- ⏳ Tally for Exhaustion: When the bar count exceeds 15+, look for confluence (volume divergence, key levels, reversal signals).
- ⚠️ HTF Flip + Extended Trend: When the HTF trend reverses while the main trend is extended, that may be a macro exit or fade signal.
- 🚫 Solo Mode: Disable HTF and use the main trend + tally as a standalone signal layer.
- 🧠 Swing Setup Friendly: Especially powerful on 1D or 1h in swing systems or trend-based grid strategies.
EMA 10/55/200 - LONG ONLY MTF (4h with 1D & 1W confirmation)Title: EMA 10/55/200 - Long Only Multi-Timeframe Strategy (4h with 1D & 1W confirmation)
Description:
This strategy is designed for trend-following long entries using a combination of exponential moving averages (EMAs) on the 4-hour chart, confirmed by higher timeframe trends from the daily (1D) and weekly (1W) charts.
🔍 How It Works
🔹 Entry Conditions (4h chart):
EMA 10 crosses above EMA 55 and price is above EMA 55
OR
EMA 55 crosses above EMA 200
OR
EMA 10 crosses above EMA 500
These entries indicate short-term momentum aligning with medium/long-term trend strength.
🔹 Confirmation (multi-timeframe alignment):
Daily (1D): EMA 55 is above EMA 200
Weekly (1W): EMA 55 is above EMA 200
This ensures that we only enter long trades when the higher timeframes support an uptrend, reducing false signals during sideways or bearish markets.
🛑 Exit Conditions
Bearish crossover of EMA 10 below EMA 200 or EMA 500
Stop Loss: 5% below entry price
⚙️ Backtest Settings
Capital allocation per trade: 10% of equity
Commission: 0.1%
Slippage: 2 ticks
These are realistic conditions for crypto, forex, and stocks.
📈 Best Used On
Timeframe: 4h
Instruments: Trending markets like BTC/ETH, FX majors, or growth stocks
Works best in volatile or trending environments
⚠️ Disclaimer
This is a backtest tool and educational resource. Always validate on demo accounts before applying to real capital. Do your own due diligence.

MA CloudThis indicator plots a Moving Average (MA) cloud with ultra-smooth visuals, designed to help traders identify trend direction, momentum, and volatility in a clear and intuitive way.
Features:
Multiple MA types: choose between EMA, SMA, WMA, or RMA
Adaptive cloud width: based on standard deviation of price to visualize volatility
Smoothing controls: post-processed smoothing gives a silky, curved appearance
Multi-Timeframe (MTF) support: default to chart timeframe, or override to any custom timeframe (e.g. 1H, 1D, etc.)
Custom styling: adjustable colours, line thickness, and cloud opacity
Use cases:
Quickly assess trend strength and direction
Use cloud thickness as a volatility proxy
Spot pullback entries during trending conditions
Combine with price action or support/resistance for confluence
Settings:
MA Type – select your preferred moving average method
MA Length – period for the average
Cloud Width Factor – adjusts the distance of the cloud edges
Smoothing Length – softens the output for a polished look
Timeframe – optional override to analyse data from a higher or lower timeframe
