OrderBlock Trend (CISD)OrderBlock Trend (CISD) Indicator
Overview:
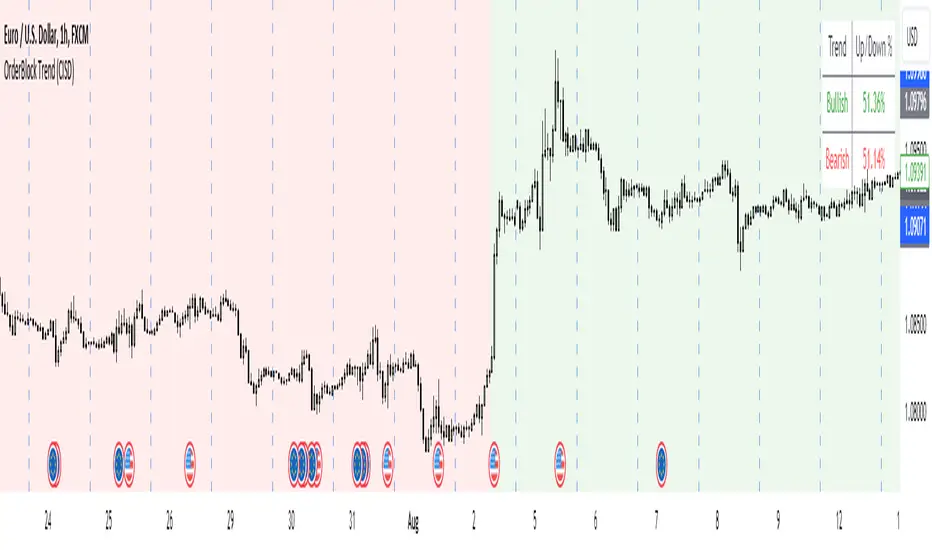
The "OrderBlock Trend (CISD)" AKA: change in state of delivery by ICT inner circle trader this indicator is designed to help traders identify and visualize market trends based on higher timeframe candle behavior. This script leverages the concept of order blocks, which are price levels where significant buying or selling activity has occurred, to signal potential trend reversals or continuations. By analyzing bullish and bearish order blocks on a higher timeframe, the indicator provides visual cues and statistical insights into the market's current trend dynamics.
Key Features:
Higher Timeframe Analysis: The indicator uses a higher timeframe (e.g., Daily) to assess the trend direction based on the open and close prices of candles. This approach helps in identifying more significant and reliable trend changes, filtering out noise from lower timeframes.
Bullish and Bearish Order Blocks: The script detects the first bullish or bearish candle on the selected higher timeframe and uses these candles as reference points (order blocks) to determine the trend direction. A bullish trend is indicated when the current price is above the last bearish order block's open price, and a bearish trend is indicated when the price is below the last bullish order block's open price.
Visual Trend Indication: The indicator visually represents the trend using background colors and plot shapes:
A green background and a square shape above the bars indicate a bullish trend.
A red background and a square shape above the bars indicate a bearish trend.
Candle Count and Statistics: The script keeps track of the number of up and down candles during bullish and bearish trends, providing percentages of up and down candles in each trend. This data is displayed in a table, giving traders a quick overview of market sentiment during each trend phase.
User Customization: The higher timeframe can be adjusted according to the trader's preference, allowing flexibility in trend analysis based on different time horizons.
Concepts and Calculations:
The "OrderBlock Trend (CISD)" indicator is based on the concept of order blocks, a key area where institutional traders are believed to place large orders, creating significant support or resistance levels. By identifying these blocks on a higher timeframe, the indicator aims to highlight potential trend reversals or continuations. The use of higher timeframe data helps filter out minor fluctuations and focus on more meaningful price movements.
The candle count and percentage calculations provide additional context, allowing traders to understand the proportion of bullish or bearish candles within each trend. This information can be useful for assessing the strength and consistency of a trend.
How to Use:
Select the Higher Timeframe: Choose the higher timeframe (e.g., Daily) that best suits your trading strategy. The default setting is "D" (Daily), but it can be adjusted to other timeframes as needed.
Interpret the Trend Signals:
A green background indicates a bullish trend, while a red background indicates a bearish trend. The corresponding square shapes above the bars reinforce these signals.
Use the information on the proportion of up and down candles during each trend to gauge the trend's strength and consistency.
Trading Decisions: The indicator can be used in conjunction with other technical analysis tools and indicators to make informed trading decisions. It is particularly useful for identifying trend reversals and potential entry or exit points based on the behavior of higher timeframe order blocks.
Customization and Optimization: Experiment with different higher timeframes and settings to optimize the indicator for your specific trading style and preferences.
Conclusion:
The "OrderBlock Trend (CISD)" indicator offers a comprehensive approach to trend analysis, combining the power of higher timeframe order blocks with clear visual cues and statistical insights. By understanding the underlying concepts and utilizing the provided features, traders can enhance their trend detection and decision-making processes in the markets.
Disclaimer:
This indicator is intended for educational purposes and should be used in conjunction with other analysis methods. Always perform your own research and risk management before making trading decisions.
Some known bugs when you switch to lower timeframe while using daily timeframe data it didn't use the daily candle close to establish the trend change but your current time frame If some of you know how to fix it that would be great if you help me to I would try my best to fix this in the future :) credit to ChatGPT 4o
在腳本中搜尋"order"
Order Blocks - VK TradingOrder Blocks - VK Trading
This script in Pine Script identifies and highlights Order Blocks, key tools in institutional trading. Designed for traders of all levels, it provides clear and customizable visualization, helping you anticipate market movements with greater accuracy.
Key Features:
Order Block Visualization: Highlights relevant bullish and bearish zones directly on the chart.
Customizable Settings: Adjust sensitivity, colors, and other parameters to suit your analysis needs.
Dual Block Detection: Uses two independent settings to cover different market perspectives.
Visual Alerts: Automatic line drawing for key levels.
Automatic Clearing: Dynamic clearing of already invalidated blocks.
User Benefits:
Clear Visual Analysis: Identifies key supply and demand points used by institutions.
Improved Trading Decisions: Anticipate entry and exit zones more accurately.
Time Saver: Automates level plotting, allowing you to focus on strategy and execution.
Strategy Adaptability: Compatible with Smart Money, Wyckoff, and Price Action approaches.
Disclaimer:
This script is an educational and analytical tool. It does not guarantee specific results or eliminate trading risk. Trading in the financial markets involves significant risks; use this script at your own risk.

OrderBlocksLibrary "OrderBlocks"
This is a library I created that creates order blocks. It's originated from my indicator "Order blocks" (). It will return a Zone object that can be used to draw an order block. If you want to see how that is done you can check out my indicar that uses the same logic.
Create(settings)
Creates an order block if one is found according to the settings parameter.
Parameters:
settings (Settings) : set all values in this parameter to define the settings for the order block creation.
Returns: a Zone object if an order block is found, na otherwise
Zone
Fields:
Time (series int)
TimeClose (series int)
High (series float)
Low (series float)
ReactionLimit (series float)
TouchedZone (Zone type from mickes/Touched/14)
Type (series int)
Zones
Fields:
Index (series int)
Maximum (series int)
Zones (array)
Remove (Zone)
Settings
Fields:
TakeOut (series bool)
ReactionFactor (series float)
Type (series string)
ConsecutiveRisingOrFalling (series bool)
FairValueGap (series bool)
OrderLibLibrary "OrderLib"
TODO: add library description here
removeOrderView(view)
Parameters:
view (orderView)
createOrderView(model, length, profit_color, loss_color, enter_color)
Parameters:
model (orderModel)
length (simple int)
profit_color (simple color)
loss_color (simple color)
enter_color (simple color)
createOrder(enter, tp, sl)
Parameters:
enter (float)
tp (float)
sl (float)
createOrderByRR(enter, sl, rr)
Parameters:
enter (float)
sl (float)
rr (float)
createOrderByRR(enter, sl, rr, commision_percent)
Parameters:
enter (float)
sl (float)
rr (simple float)
commision_percent (simple float)
orderModel
Fields:
enter (series__float)
sl (series__float)
tp (series__float)
orderView
Fields:
enter (series__line)
sl (series__line)
tp (series__line)
OrderFlow Absorption IndicatorWhat it Does
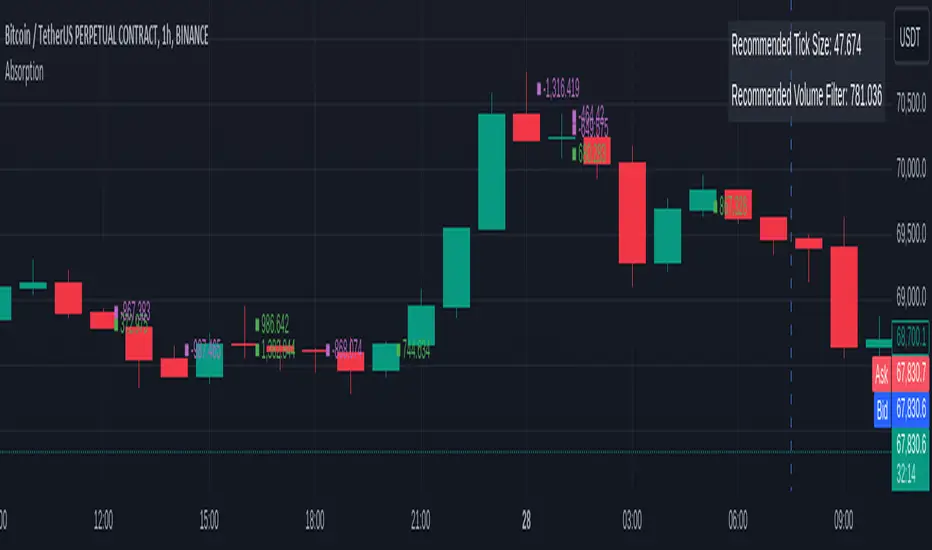
The OrderFlow Absorption Indicator marks areas where the price absorbs a large volume of aggressive market trades. This indicates areas where price may bounce back due to large limit (resting) orders absorbing significant aggressor volume (market orders). Absorption can also be seen as "preventing" or "stopping" the other side from breaking through a price level (e.g. bids stopping an influx of sell market orders). Absorption may signal a change in sentiment, potentially leading to a pullback or reversal.
An Example of Absorption
Of course, it is not always the case that such bullish absorption will initiate a trend as the example above. The OrderFlow Absorption Indicator merely serves as a tool for spotting possible absorption points in the market which you can incorporate into your trading arsenal.
How it Works
The indicator actively monitors price changes and records volume accumulated at a price level. If the price bounces back to at least where it was before the current price move, the indicator records this as absorption, provided it meets the Volume Requirement and optional Time Requirement.
How to Use it
1. Set Parameters
Choose your desired tick size and volume filter value. If unsure, refer to the table on the top right of the chart for recommended values. An automatic volume limit filter mode is also available.
Automatic Limit Mode : Enable this mode to have the indicator automatically select a volume filter value. It calculates the standard deviation of the last n minutes of volume and multiplies it by a volume multiplier. You can adjust these parameters.
Higher Volume Filter : Setting a higher volume filter value results in fewer, but higher quality detections, reducing noise.
2. Enabling the Time Limit
Enabling the time limit further improves detection quality by filtering out price levels that can defend against quick, sudden aggressive orders, acting as confirmation and indicating strong sentiment and resilient liquidity.
3. Enabling Historical Data Absorption
The indicator can also detect absorption in historical data, though less accurately than in real-time due to OHLCV aggregation.
You can select the granularity of historical data.
Lower granularity (e.g., 1 second) : Provides more accurate detections but may slow down the indicator.
Higher granularity : Improves speed but reduces detection accuracy.
Other Features
Hovering : When hovering over an absorption point, the interface reveals the price where the absorption occurred, along with the volume absorbed by the bids and asks, as well as the volume filter value used.
Delta Mode : In Delta mode, the system calculates the difference between the volume absorbed by bids and asks, revealing points only when the absolute value of this difference exceeds the volume filter value. Especially useful for larger tick sizes.
Troubleshooting
If the indicator doesn't mark anything, it means the traded volume hasn't exceeded the set volume filter value within the specified price intervals(tick size) and time limit. Adjust these settings as necessary.
Order Blocks Indicator [TradingFinder] Lightning|CHOCH |OB | BOS🔵 Introduction
In "Price Action," an "Order Block" is essentially an area on the price chart where significant players such as institutional traders have executed their moves by placing noteworthy orders. These points often indicate areas where price either attempts to break through (resistance) or returns when it reaches there (support).
Therefore, when discussing the identification of order blocks, we typically refer to finding points where the price has stalled for a while and has accumulated strength before making a significant move in one direction.
Essentially, order blocks assist traders in understanding where large players with "smart money" have likely placed their bulk orders in the market. Traders use these order blocks as part of their overall analysis to identify probable levels where price may change direction.
This version of the order block indicator is designed for traders, adding many indicators to their charts. The minimal design helps minimize disruptions to user focus.
🔵 Identification of Order Blocks
To identify order blocks, first, a "Level Break" must occur. To identify a "Demand Zone," a "High Level Break" is required, and to identify a "Supply Zone," a "Low Level Break" is needed.
Demand Zone :
Supply Zone :
🔵 "Change of Character" or "Market Shift Structure"
"ChoCh" or "MSS" is the "Break Level" that is contrary to the previous trend. For example, if a "Bearish Level" is established in the market and consecutive "Low Levels" are being broken, the price turns upward, breaking a "High Level." This break is called "ChoCh" or "MSS."
🔵 "Break of Structure"
"Break of Structure," or "BoS" for short, is the "Break Level" in the direction of the current trend. For example, if a "Bullish Level" is established in the market, when the price breaks a "High Level," a "BoS" has occurred.
🔵 Features
🟣 Major Level
This feature helps you easily identify major levels. These levels form when the price breaks another major level.
🟣 Refine Order Block
The "Refinement" feature allows you to adjust the width of the order block based on your strategy. There are two modes, "Aggressive" and "Defensive," in Order Block Refine. The difference between "Aggressive" and "Defensive" lies in the width of the order block. For "Risk Averse" traders, the "Defensive" mode is suitable because it provides smaller stop losses and larger reward-to-risk ratios. For "Risk Taker" traders, the "Aggressive" mode is more suitable. These traders prefer to enter trades at higher prices and this mode, where the width of the order block is greater, is more suitable for this group of individuals.
🔵 How to Use
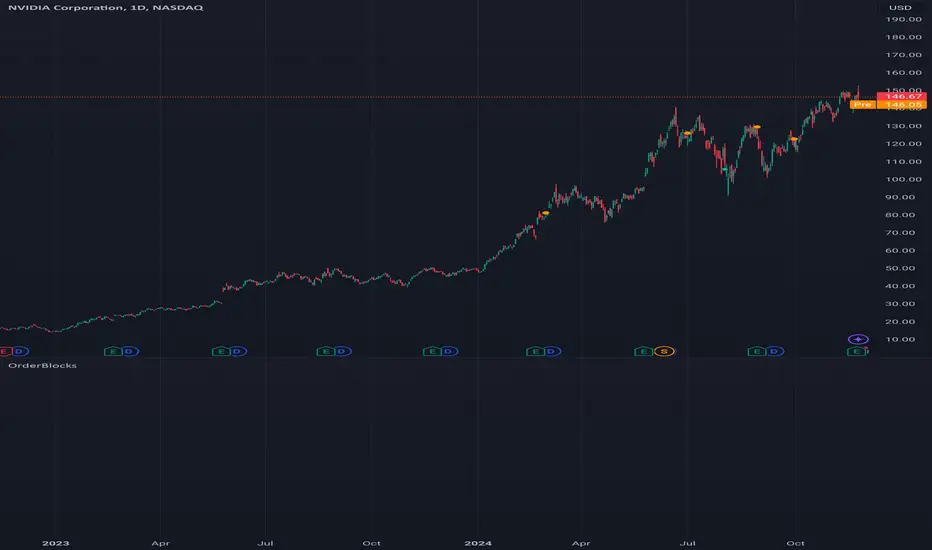
After adding the indicator to your chart, you will see a visual similar to the image below. Green order blocks are "Demand Zones" and red order blocks are "Supply Zones." The midpoint of the order blocks also indicates 50% of it.
Refine Order Block is defaulted to On and refines the order blocks. If you want the order blocks to remain original, you should set it to Off.
Refine is defaulted to "Defensive" mode. If you want it to be in "Aggressive" mode, you should change its mode through Refine Type.
Displaying "Major Levels" is turned off by default and to display them, you should set "Show High Level" and "Show Low Level" to "Yes." You can use these lines to identify liquidity or determine stop loss and take profit levels.

Order Block Detector [LuxAlgo]This script makes use of high-volume activity as an indicator of the presence of market participants accumulating orders in specific areas on a lower timeframe by detecting volume peaks to form order blocks.
Mitigated order blocks are automatically hidden from the chart, also allowing users to be able to select two different mitigation methods "wick" and "close".
Additionally, users can be alerted for the creation and mitigation of bullish/bearish order blocks.
Settings
Volume Pivot Length: Lookback of the pivot function used to detect volume peaks, lower values will detect order blocks more frequently.
Bullish OB: Determines the number of most recent unmitigated bullish order blocks to display on the chart.
Bearish OB: Determines the number of most recent unmitigated bullish order blocks to display on the chart.
Bearish OB: Determines the number of most recent unmitigated bullish order blocks to display on the chart.
Average Line Style: Line style of the average order block level.
Average Line Width: Line width of the average order block level.
Mitigation Methods: Method used to determine how an order block is mitigated. "Wick" will mitigate order blocks if the candle wick goes outside of the order block and "Close" will mitigate order blocks if the closing price goes outside of the order block.
Usage
It is common for more significant market participants to execute orders incrementally in order to avoid overwhelming the market and cause significant price movements. This practice allows the orders to be executed more efficiently and effectively, reducing the impact on the market and minimizing the potential for price volatility.
Order blocks are price areas where these orders are executed incrementally and are commonly used as areas of support/resistance for traders.
Bearish order blocks occur during a downtrend, while bullish order blocks occur in an uptrend. Bullish order blocks range from the price low to the median price, while bearish order blocks range from the median price to the price high. The median price is used as an equilibrium point.
Users can highlight the bars where an order block was detected from the style settings by toggling on the 'Bull OB' or 'Bear OB' selections.
Note that in order to confirm a peak Volume Pivot Length bars are needed, as such note that order blocks are shown retrospectively.

Order Block Finder (Experimental)The purpose of this experimental Indicator is to help identifying Institutional Order Blocks.
Often these Order Blocks can be observed at the beginning of a strong move, but there is a significant probability that these price levels will be revisited at a later point in time again. Therefore these are interesting levels to place limit orders (Buy Orders for Bullish OB / Sell Orders for Bearish OB).
A Bullish Order block is defined as the last down candle before a sequence of up candles. (Relevant price range "Open" to "Low" is marked)
A Bearish Order Block is defined as the last up candle before a sequence of down candles. (Relevant price range "Open" to "High" is marked)
In the settings the number of required sequential candles can be adjusted.
Furthermore a %-threshold can be entered. It defines which minimum %-change the sequential move needs to achieve in order to identify a relevant Order Block. If this is used, it makes sense to adjust it to the timeframe which is analyzed as of course higher timeframes usually produce bigger moves.
Channels for the last Bullish/Bearish Block can be shown/hidden.
In addition to the upper/lower limits of each Order Block, also the equlibrium (average value) is marked as this is an interesting area for price interaction.
Please note that you can optionally display a "Docu"-Label which shows some information about the indicator as a tooltip.
Remark:
As the identification of a relevant Order Block is only possible after the required number of subsequent candles has closed, this indicator "repaints" by definition. But I do not see this as an issue as the relevancy of the Order Blocks and the interaction of price with these levels usually only happens longer in the future anyway.

Order Blocks W/ Realtime Fibs [QuantVue]The "Order Blocks W/ Realtime Fibs" indicator is a comprehensive tool combining the concepts of order blocks with Fibonacci retracement. The combination can be a powerful tool for identifying entry and exit points, and potential target areas.
Order blocks indicate where major players have likely placed their orders, while Fibonacci levels provide a mathematical basis for potential support and resistance areas.
What is an Order Block?
An order block in trading refers to an area on the chart in which it is believed a substantial number of orders (buy or sell) collected over a short period. Typically, these are identified as a range of consecutive aggressive bullish or bearish bars (candles). They represent areas where significant market players have entered the market, creating a footprint of their activity.
The indicator is highly customizable allowing user to select the number of consecutive bars and minimum price movement required for an order block, along with other settings like requiring a new order block in the opposite direction before finding a new order block.
Fibonacci Retracements
Fibonacci retracements are popular among technical traders, based on the idea that markets often retrace a predictable portion of a move, after which they continue to move in the original direction.
Once an Order Block is detected the indicator will automatically draw Fibonacci levels and continue to update those levels in real time until the user selected retracement level has been hit or a new more relevant order block has been found.
The combination of order blocks and Fibonacci retracements in this indicator can be used as a method for spotting potential reversal zones.
Indicator features:
🔹Custom Order Block Parameters
🔹Mitigation Type
🔹Custom Colors
🔹Select Retracement Levels
🔹Alerts for Order Blocks & Retracements
Give this indicator a BOOST and COMMENT your thoughts!
We hope you enjoy.
Cheers!

Order Blocks Screener | Flux Charts💎 GENERAL OVERVIEW
Introducing our new Order Blocks Screener! This screener can provide information about the latest order blocks in up to 5 tickers. You can also customize the algorithm that finds the order blocks and the styling of the screener.
Features of the new Order Blocks Screener :
Find Latest Order Blocks Accross 5 Tickers
Latest Status, Restests, Bullish & Bearish Volume
Customizable Algoritm / Styling
📌 HOW DOES IT WORK ?
Order blocks occur when there is a high amount of market orders exist on a price range. It is possible to find order blocks using specific formations on the chart.
The high & low volume of order blocks should be taken into consideration while determining their strengths. The determination of the high & low volume of order blocks are similar to FVGs, in a bullish order block, the high volume is the last 2 bars' total volume, while the low volume is the oldest bar's volume. In a bearish order block scenerio, the low volume becomes the last 2 bars' total volume.
This screener then finds order blocks accross 5 different tickers, and shows the latest information about them.
Status ->
Far -> The current price is far away from the order block.
Approaching ⬆️/⬇️ -> The current price is approaching the order block, and the direction it's approaching from.
Inside -> The price is currently inside the order block.
Retests -> Retest means the price to invalidate the order block, but failed to do so. Here you can see how many times the price retested the order block.
For the bullish / bearish volume, check the "How Does It Work" section.
🚩UNIQUENESS
This screener can detect latest order blocks and give information about them for up to 5 tickers. This saves the user time by showing them all in a dashboard at the same time. The screener shows the number of the retests of the order block as an unique trait. Another unique ability of the screener is that it shows the latest valid order block's bullish and bearish volume in the dashboard.
⚙️SETTINGS
1. Tickers
You can set up to 5 tickers for the screener to scan order blocks here. You can also enable / disable them and set their individual timeframes.
2. General Configuration
Zone Invalidation -> Select between Wick & Close price for Order Block Invalidation.
Swing Length -> Swing length is used when finding order block formations. Smaller values will result in finding smaller order blocks.

Order Blocks Finder [TradingFinder] Major OB | Supply and Demand🔵 Introduction
Drawing all order blocks on the path, especially in range-bound or channeling markets, fills the chart with lines, making it confusing rather than providing the trader with the best entry and exit points.
🔵 Reason for Indicator Creation
For traders familiar with market structure and only need to know the main accumulation points (best entry or exit points), and primary order blocks that act as strong sources of power.
🟣 Important Note
All order blocks, both ascending and descending, are identified and displayed on the chart when the structure of "BOS" or "CHOCH" is broken, which can also be identified with "MSS."
🔵 How to Use
When the indicator is installed, it plots all order blocks (active order blocks) and continues until the price reaches them. This continuation happens in boxes to have a better view in the TradingView chart.
Green Range : Ascending order blocks where we expect a price increase in these areas.
Red Range : Descending order blocks where we expect a price decrease in these areas.
🔵 Settings
Order block refine setting : When Order block refine is off, the supply and demand zones are the entire length of the order block (Low to High) in their standard state and cannot be improved. If you turn on Order block refine, supply and demand zones will improve using the error correction algorithm.
Refine type setting : Improving order blocks using the error correction algorithm can be done in two ways: Defensive and Aggressive. In the Aggressive method, the largest possible range is considered for order blocks.
🟣 Important
The main advantage of the Aggressive method is minimizing the loss of stops, but due to the widening of the supply or demand zone, the reward-to-risk ratio decreases significantly. The Aggressive method is suitable for individuals who take high-risk trades.
In the Defensive method, the range of order blocks is minimized to their standard state. In this case, fewer stops are triggered, and the reward-to-risk ratio is maximized in its optimal state. It is recommended for individuals who trade with low risk.
Show high level setting : If you want to display major high levels, set show high level to Yes.
Show low level setting : If you want to display major low levels, set show low level to Yes.
🔵 How to Use
The general view of this indicator is as follows.
When the price approaches the range, wait for the price reaction to confirm it, such as a pin bar or divergence.
If the price passes with a strong candle (spike), especially after a long-range or at the beginning of sessions, a powerful event is happening, and it is outside the credibility level.
An Example of a Valid Zone
An Example of Breakout and Invalid Zone. (My suggestion is not to use pending orders, especially when the market is highly volatile or before and after news.)
After reaching this zone, expect the price to move by at least the minimum candle that confirmed it or a price ceiling or floor.
🟣 Important : These factors can be more accurately measured with other trend finder indicators provided.
🔵 Auxiliary Tools
There is much talk about not using trend lines, candlesticks, Fibonacci, etc., in the web space. However, our suggestion is to create and use tools that can help you profit from this market.
• Fibonacci Retracement
• Trading Sessions
• Candlesticks
🔵 Advantages
• Plotting main OBs without additional lines;
• Suitable for timeframes M1, M5, M15, H1, and H4;
• Effective in Tokyo, Sydney, and London sessions;
• Plotting the main ceiling and floor to help identify the trend.

Order Blocks | Flux Charts💎 GENERAL OVERVIEW
Introducing our new Volumized Order Blocks indicator! This new indicator can render order blocks with their volumetric information. It's highly customizable with detection, invalidation and style settings.
Features of the new Volumized Order Blocks indicator :
Render Bullish & Bearish Order Blocks
Enable / Disable Volumetric Information
Enable / Disable Historic Zones
Visual Customizability
📌 HOW DOES IT WORK ?
Order blocks occur when there is a high amount of market orders exist on a price range. It is possible to find order blocks using specific formations on the chart.
The high & low volume of order blocks should be taken into consideration while determining their strengths. The determination of the high & low volume of order blocks are similar to FVGs, in a bullish order block, the high volume is the last 2 bars' total volume, while the low volume is the oldest bar's volume. In a bearish order block scenario, the low volume becomes the last 2 bars' total volume.
🚩UNIQUENESS
The ability to render the total volume of Order Blocks as well as bullish / bearish volume ratio is what sets this Order Block indicator apart from others. Also the ability to combine overlapping Order Block zones will result in cleaner charts for traders.
⚙️SETTINGS
1. General Configuration
Volumetric Info -> The volumetric information of the Order Blocks will be rendered if activated.
Zone Invalidation -> Select between Wick & Close price for Order Block Invalidation.
Swing Length -> Swing length is used when finding order block formations. Smaller values will result in finding smaller order blocks.

Orderblocks & BreakersThis indicator identifies potential orderblocks and breakers based on recent swing highs and lows. It is built to offer a structured, customizable, and noise-controlled view of how price interacts with supply and demand levels.
The script applies pivot-based swing detection to identify swing highs and lows.
Bullish Orderblocks: The script Identifies and stores the last down candle before a swing high is breached and confirms and plots the orderblock with a market structure break (close above the swing high).
Bearish Orderblocks: The script Identifies and stores the last up candle before a swing low is breached and confirms and plots the orderblock with a market structure break (close below the swing low).
When price later closes through an existing orderblock, it is reclassified as a Breaker and recolored accordingly. (all colors can be changed in the settings)
What Makes It Different
Unlike most orderblock tools that simply mark every swing-based block, this version introduces:
1. Chop Control – automatically hides breakers that price repeatedly closes through (2 closes after the orderblock becomes a breaker), keeping only relevant zones visible.
2. Recent Block Filtering – limits how many of the recent orderblocks or breakers are displayed, preventing chart clutter.
3. Dynamic Updating – orderblocks automatically convert to breakers when price closes beyond them, with clear color changes.
These features make it easier to study cleaner price structure without manually managing old or invalid zones. The optional Chop Control filter can reduce overlapping or repeatedly invalidated zones to keep the chart clearer.
Customizable Parameters
- Swing detection length (shorter means more aggressive pivot detection, longer means less aggressive so less highs/lows detected)
- Number of recent blocks to display
- Visibility toggles for orderblocks or breakers
- Color and transparency controls for each type
Alerts
Alerts can be set to trigger when price tests any defined zone.
Purpose
This indicator is designed as a price structure visualization and study tool.
It may assist in understanding how price interacts with previously active regions, but it does not produce signals or trade recommendations.

Order Chain [Kioseff Trading]Hello!
This indicator "Order Chain" uses live tick data (varip) to retrieve live tick volume.
This indicator must be used on a live market with volume data
Features
Live Tick Volume
Live Tick Volume Delta
Orders are appended to boxes, whose width and height are scaled proportional to the size of the order.
CVD recorded at relevant tick levels
Order chain spans up to 450 ticks (might include aggregates)
The image above shows key features for the indicator!
The image above explains line and color placements.
The image above shows the indicator in action for a live market!
How It Works
The indicator records the difference in volume from "now" and the previous tick. Predicated on whether the "now" price is greater than or less than price one tick prior, the difference in volume is recorded as "buy" or "sell" volume.
This filled order (or aggregates) is colored in congruence with price direction. The filled order is subsequently appended to its relevant tick level and added (buy order) or subtracted (sell order) from the CVD value at the identified tick level.
Of course, thank you to @PineCoders and @RicardoSantos for their awesome libraries :D
Thank you!

OrderBlock [kyleAlgo]The principle of this indicator
ATR (Average True Range) Setting: The code uses ATR to help calculate the Supertrend indicator.
Supertrend Trend Direction: Identify bullish and bearish trends with the Supertrend method.
Order Block Recognition: This part of the code recognizes and creates order blocks, visualizing them as boxes on the chart. If the number of blocks exceeds the maximum limit, old blocks will be deleted.
Function to prevent overlapping: check whether the new order block overlaps with the existing order block through the isOverlapping function.
Order block color setting: The code sets the color according to whether the block is bullish or bearish, and whether it breaks above or below. Afterwards the color of the existing order blocks will be updated.
Sensitivity settings: Through the input settings of factor and atrPeriod, the sensitivity of Supertrend and the detection of order blocks can be affected.
Visualization: Use TradingView's box.new function to draw and visualize order blocks on the chart.
Practicality:
Support and Resistance Levels: Order blocks may represent areas of support and resistance in the market. By visualizing these areas, traders can better understand when price reversals are likely to occur.
Trading Signals: Traders may be able to identify trading signals based on the color changes of blocks and price breakouts. For example, if the price breaks above a bullish block, this could be a signal to buy.
Risk Management: By using ATR to adjust the sensitivity of Supertrend, the symbol helps traders to adjust their strategies according to market volatility. This can be used as a risk management tool to help identify stop loss and take profit points.
Multi-timeframe analysis: Although the code itself does not implement multi-timeframe analysis directly, it can be done by applying this indicator on different timeframes. This helps to analyze the market from different angles.
Flexibility and Customization: Through sensitivity settings, traders can customize the indicator according to their needs and trading style.
Reduced screen clutter: By removing overlapping order blocks and limiting the maximum number of order blocks, this code helps reduce clutter on charts, allowing traders to analyze the market more clearly.
Overall, this "Pine Script" can be a powerful analytical tool for trend traders and those looking to improve their trading decisions by visualizing key market areas. It can be used alone or combined with other indicators and trading systems for enhanced functionality.

Order Block Drawing [TradingFinder]🔵 Introduction
Perhaps one of the most challenging tasks for Pine script developers (especially beginners) is properly drawing order blocks. While utilizing the latest technical analysis methods for "Price Action," beginners heavily rely on accurately plotting "Supply" and "Demand" zones, following concepts like "Smart Money Concept" and "ICT".
However, drawing "Order Blocks" may pose a challenge for developers. Therefore, to minimize bugs, increase accuracy, and speed up the process of coding order blocks, we have released the "Order Block Drawing" library.
Below, you can read more details about how to use this library.
Important :
This library has direct and indirect outputs. The indirect output includes the ranges of order blocks plotted on the chart. However, the direct output is a "Boolean" value that becomes "true" only when the price touches an order block, colloquially termed as "Mitigate." You can use this output for setting up alerts.
🔵 How to Use
First, you can add the library to your code as shown in the example below.
import TFlab/OrderBlockDrawing_TradingFinder/1
🟣Parameters
OBDrawing(OBType, TriggerCondition, DistalPrice, ProximalPrice, Index, OBValidDis, Show, ColorZone) =>
Parameters:
• OBType (string)
• TriggerCondition (bool)
• DistalPrice (float)
• ProximalPrice (float)
• Index (int)
• OBValidDis (int)
• Show (bool)
• ColorZone (color)
OBType : All order blocks are summarized into two types: "Supply" and "Demand." You should input your order block type in this parameter. Enter "Demand" for drawing demand zones and "Supply" for drawing supply zones.
TriggerCondition : Input the condition under which you want the order block to be drawn in this parameter.
DistalPrice : Generally, if each zone is formed by two lines, the farthest line from the price is termed "Distal." This input receives the price of the "Distal" line.
ProximalPrice : Generally, if each zone is formed by two lines, the nearest line to the price is termed "Proximal" line.
Index : This input receives the value of the "bar_index" at the beginning of the order block. You should store the "bar_index" value at the occurrence of the condition for the order block to be drawn and input it here.
OBValidDis : Order blocks continue to be drawn until a new order block is drawn or the order block is "Mitigate." You can specify how many candles after their initiation order blocks should continue. If you want no limitation, enter the number 4998.
Show : You may need to manage whether to display or hide order blocks. When this input is "On", order blocks are displayed, and when it's "Off", order blocks are not displayed.
ColorZone : You can input your preferred color for drawing order blocks.
🔵 Function Outputs
This function has only one output. This output is of type "Boolean" and becomes "true" only when the price touches an order block. Each order block can be touched only once and then loses its validity. You can use this output for alerts.
= Drawing.OBDrawing('Demand', Condition, Distal, Proximal, Index, 4998, true, Color)

Order Block Overlapping Drawing [TradingFinder]🔵 Introduction
Technical analysis is a fundamental tool in financial markets, helping traders identify key areas on price charts to make informed trading decisions. The ICT (Inner Circle Trader) style, developed by Michael Huddleston, is one of the most advanced methods in this field.
It enables traders to precisely identify and exploit critical zones such as Order Blocks, Breaker Blocks, Fair Value Gaps (FVGs), and Inversion Fair Value Gaps (IFVGs).
To streamline and simplify the use of these key areas, a library has been developed in Pine Script, the scripting language for the TradingView platform. This library allows you to automatically detect overlapping zones between Order Blocks and other similar areas, and visually display them on your chart.
This tool is particularly useful for creating indicators like Balanced Price Range (BPR) and ICT Unicorn Model.
🔵 How to Use
This section explains how to use the Pine Script library. This library assists you in easily identifying and analyzing overlapping areas between Order Blocks and other zones, such as Breaker Blocks and Fair Value Gaps.
To add "Order Block Overlapping Drawing", you must first add the following code to your script.
import TFlab/OrderBlockOverlappingDrawing/1
🟣 Inputs
The library includes the "OBOverlappingDrawing" function, which you can use to detect and display overlapping zones. This function identifies and draws overlapping zones based on the Order Block type, trigger conditions, previous and current prices, and other relevant parameters.
🟣 Parameters
OBOverlappingDrawing(OBType , TriggerConditionOrigin, distalPrice_Pre, proximalPrice_Pre , distalPrice_Curr, proximalPrice_Curr, Index_Curr , OBValidGlobal, OBValidDis, MitigationLvL, ShowAll, Show, ColorZone) =>
OBType (string)
TriggerConditionOrigin (bool)
distalPrice_Pre (float)
proximalPrice_Pre (float)
distalPrice_Curr (float)
proximalPrice_Curr (float)
Index_Curr (int)
OBValidGlobal (bool)
OBValidDis (int)
MitigationLvL (string)
ShowAll (bool)
Show (bool)
ColorZone (color)
In this example, various parameters are defined to detect overlapping zones and draw them on the chart. Based on these settings, the overlapping areas will be automatically drawn on the chart.
OBType : All order blocks are summarized into two types: "Supply" and "Demand." You should input your Current order block type in this parameter. Enter "Demand" for drawing demand zones and "Supply" for drawing supply zones.
TriggerConditionOrigin : Input the condition under which you want the Current order block to be drawn in this parameter.
distalPrice_Pre : Generally, if each zone is formed by two lines, the farthest line from the price is termed Pervious "Distal." This input receives the price of the "Distal" line.
proximalPrice_Pre : Generally, if each zone is formed by two lines, the nearest line to the price is termed Previous "Proximal" line.
distalPrice_Curr : Generally, if each zone is formed by two lines, the farthest line from the price is termed Current "Distal." This input receives the price of the "Distal" line.
proximalPrice_Curr : Generally, if each zone is formed by two lines, the nearest line to the price is termed Current "Proximal" line.
Index_Curr : This input receives the value of the "bar_index" at the beginning of the order block. You should store the "bar_index" value at the occurrence of the condition for the Current order block to be drawn and input it here.
OBValidGlobal : This parameter is a boolean in which you can enter the condition that you want to execute to stop drawing the block order. If you do not have a special condition, you should set it to True.
OBValidDis : Order blocks continue to be drawn until a new order block is drawn or the order block is "Mitigate." You can specify how many candles after their initiation order blocks should continue. If you want no limitation, enter the number 4998.
MitigationLvL : This parameter is a string. Its inputs are one of "Proximal", "Distal" or "50 % OB" modes, which you can enter according to your needs. The "50 % OB" line is the middle line between distal and proximal.
ShowAll : This is a boolean parameter, if it is "true" the entire order of blocks will be displayed, and if it is "false" only the last block order will be displayed.
Show : You may need to manage whether to display or hide order blocks. When this input is "On", order blocks are displayed, and when it's "Off", order blocks are not displayed.
ColorZone : You can input your preferred color for drawing order blocks.
🟣 Output
Mitigation Alerts : This library allows you to leverage Mitigation Alerts to detect specific conditions that could lead to trend reversals. These alerts help you react promptly in your trades, ensuring better management of market shifts.
🔵 Conclusion
The Pine Script library provided is a powerful tool for technical analysis, especially in the ICT style. It enables you to detect overlapping zones between Order Blocks and other significant areas like Breaker Blocks and Fair Value Gaps, improving your trading strategies. By utilizing this tool, you can perform more precise analysis and manage risks effectively in your trades.

Order Blocks & Breaker Blocks [LuxAlgo]The Order Blocks & Breaker Blocks indicator detects order blocks that can be turned into breaker blocks on the chart automatically once mitigated.
Users can determine the amount of bullish and bearish order/breaker blocks that display on their chart from within the settings menu.
🔶 SETTINGS
Swing Lookback: Lookback period used for the detection of the swing points used to create order blocks.
Show Last Bullish OB: Number of the most recent bullish order/breaker blocks to display on the chart.
Show Last Bearish OB: Number of the most recent bearish order/breaker blocks to display on the chart.
Use Candle Body: Allows users to use candle bodies as order block areas instead of the full candle range.
🔹 Style
Show Historical Polarity Changes: Allows users to see labels indicating where a swing high/low previously occurred within a breaker block.
🔶 USAGE
We have published several scripts covering the detection of order blocks previously, however, the concept of breaker blocks was not yet introduced.
When price mitigates an order block, a breaker block is confirmed. We can eventually expect price to trade back to this breaker block offering a new trade opportunity.
We can see that this is similar to a change in polarity, where a support becomes a resistance after a breakout and vice versa.
This script highlights regular order blocks as solid extended areas on the chart and breaker blocks as dashed lines with dual-colored areas. The color change and dashed line starts at the location where the order block was mitigated.
Using a higher "Swing Lookback" setting will return longer term order/breaker blocks on the chart.
Users can optionally enable "Historical Polarity Changes" labels within the settings menu to see where breaker blocks might have provided an effective trade setup previously.
The "Historical Polarity Changes" setting is disabled by default & is most effective using replay mode as the labels are backpainted.
The order blocks & breaker blocks themselves can be used in real-time as they are detected based on the swing length & previous breaker blocks being mitigated.

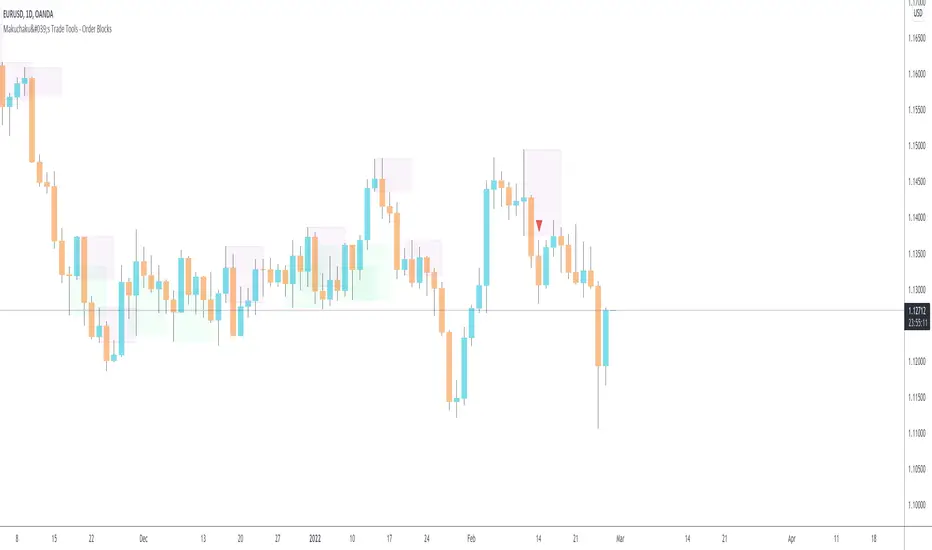
Makuchaku's Trade Tools - Order BlocksOrder blocks are a 2 candlestick pattern
Bullish order block : down candle getting engulfed by an up candle
Bearish order block : up candle getting engulfed by a down candle
Order Blocks with signalsIn order to trade the order blocks effectively, you have to look for an area on the price chart where the price had a large move. This script automatically draws the order blocks for you, so you don't have to.
Blue OB (supply): search for short opportunities
Green OB (demand): search for long opportunities
Please be aware: Do not buy and sell from every order block.
You can set two types of alerts:
- Buy
- Sell
Some short information about order blocks:
Order blocks are huge institutional buy or sell orders placed over a particular period. During these, the institutional players are looking to build up their positions in the markets.

Orderblocks (Nephew_Sam_) - Open sourceHighlights orderblocks based on fractal market structure.
Whenever a new fractal high/low is created, it will search for the Orderblock and plot lines and labels
Options:
1. Select 3/5 bar fractal
2. Plot lines and labels on OB's
- Ability to filter OB only when a candle is fully engulfed
3. Change bar color of engulfed candles
4. Option to filter OB that follows with an FVG
View the published chart for more details on how this indicator works
Disclaimer: You have the permissions to use this code however make sure you give me the credits when you do and make it open source or grant me access to the code.
Order Block Matrix [Alpha Extract]The Order Block Matrix indicator identifies and visualizes key supply and demand zones on your chart, helping traders recognize potential reversal points and high-probability trading setups.
This tool helps traders:
Visualize key order blocks with volume profile histograms showing liquidity distribution.
Identify high-volume price levels where institutional activity occurs.
rank historical order blocks and analyze their strength based on volume.
Receive alerts for potential trading opportunities based on price-block interactions.
🔶 CALCULATION
The indicator processes chart data to identify and analyze order blocks:
Order Block Detection
Inputs:
Price action patterns (consolidation areas followed by breakouts).
Volume data from current and lower timeframes.
User-defined lookback periods and thresholds.
Detection Logic:
Identifies consolidation areas using a dynamic range comparison.
Confirms breakout patterns with percentage threshold validation.
Maps volume distribution across price levels within each order block.
🔶Volume Analysis
Volume Profiling:
Divides each order block into configurable grid segments.
Maps volume distribution across price segments within blocks.
Highlights zones with highest volume concentration.
Strength Assessment:
Calculates total block volume and relative strength metrics.
Compares block volume to historical averages.
Determines probability of reversal based on volume patterns.
isConsolidation(len) =>
high_range = ta.highest(high, len) - ta.lowest(high, len)
low_range = ta.highest(low, len) - ta.lowest(low, len)
avg_range = (high_range + low_range) / 2
current_range = high - low
current_range <= avg_range * (1 + obThreshold)
🔶 DETAILS
Visual Features
Volume Profile Histograms:
Color-coded bars showing volume concentration within order blocks.
Gradient coloring based on relative volume (high volume = brighter colors).
Bull blocks (green/teal) and bear blocks (red) with varying opacity.
Block Visualization:
Dynamic box sizing based on volume concentration.
Optional block borders and background fills.
Volume labels showing total block volume.
Screener Table:
Real-time analysis of order block metrics.
Shows block direction, proximity, retest count, and volume metrics.
Color-coded for quick reference.
Interpretation
High Volume Areas: Zones with institutional interest and potential reversal points.
Block Direction: Bullish blocks typically support price, bearish blocks typically resist price.
Retests: Multiple tests of an order block may strengthen or weaken its influence.
Block Age: Newer blocks often have stronger influence than older ones.
Volume Concentration: Brightest segments within blocks represent the highest volume areas.
🔶 EXAMPLES
The indicator helps identify key trading opportunities:
Bullish Order Blocks
Support Zones: Identify strong support levels where price is likely to bounce.
Breakout Confirmation: Validate breakouts with volume analysis to avoid false moves.
Retest Strategies: Enter trades when price retests a bullish order block with high volume.
Bearish Order Blocks
Resistance Zones: Identify strong resistance levels where price is likely to reverse.
Distribution Areas: Detect zones where smart money is distributing to retail.
Short Opportunities: Find optimal short entry points at high-volume bearish blocks.
Combined Strategies
Order Block Stacking: Multiple aligned blocks create stronger support/resistance zones.
Block Mitigation: When price breaks through a block, it often indicates a strong trend continuation.
Volume Profile Applications: Higher volume segments provide more precise entry and exit points.
🔶 SETTINGS
Customization Options
Order Block Detection:
Consolidation Lookback: Adjust the period for consolidation detection.
Breakout Threshold: Set minimum percentage for breakout confirmation.
Historical Lookback Limit: Control how far back to scan for historical order blocks.
Maximum Order Blocks: Limit the number of visible blocks on the chart.
Visual Style:
Grid Segments: Adjust the number of volume profile segments.
Extend Blocks to Right: Enable/disable extending blocks to current price.
Show Block Borders: Toggle border visibility.
Border Width: Adjust thickness of block borders.
Show Volume Text: Enable/disable volume labels.
Volume Text Position: Control placement of volume labels.
Color Settings:
Bullish High/Low Volume Colors: Customize appearance of bullish blocks.
Bearish High/Low Volume Colors: Customize appearance of bearish blocks.
Border Color: Set color for block outlines.
Background Fill: Adjust color and transparency of block backgrounds.
Volume Text Color: Customize label appearance.
Screener Table:
Show Screener Table: Toggle table visibility.
Table Position: Select positioning on the chart.
Table Size: Adjust display size.
The Order Block Matrix indicator provides traders with powerful insights into market structure, helping to identify key levels where smart money is active and where high-probability trading opportunities may exist.

Order Blocks & Breaker Blocks [TradingFinder] Signals + Alerts🔵 Introduction
Order Block and Breaker Block, are powerful tools in technical analysis. By understanding these concepts, traders can enhance their ability to predict potential price reversals and continuations, leading to more effective trading strategies.
Using historical price action, volume analysis, and candlestick patterns, traders can identify key areas where institutional activities influence market movements.
🟣 Demand Order Block and Supply Breaker Block
Demand Order Block : A Demand Order Block is formed when the price succeeds in breaking the previous high pivot.
Supply Breaker Block : A Supply Breaker Block is formed when the price succeeds in breaking the Demand Order Block. As a result, the Order Block changes its role and turns from the role of price support to resistance.
🟣 Supply Order Block and Demand Breaker Block
Supply Order Block : A Supply Order Block is formed when the price succeeds in breaking the previous low pivot.
Demand Breaker Block : A Demand Breaker Block is formed when the price succeeds in breaking the Supply Order Block. As a result, the Order Block changes its role and turns from the role of price resistance to support.
🔵 How to Use
🟣 Order Blocks (Supply and Demand)
Order blocks are zones where the likelihood of a price reversal is higher. In demand zones, buying opportunities arise, while in supply zones, selling opportunities can be explored.
The "Refinement" feature allows you to adjust the width of the order block to fit your trading strategy. There are two modes in the "Order Block Refine" feature: "Aggressive" and "Defensive." The primary difference between these modes is the width of the order block.
For risk-averse traders, the "Defensive" mode is ideal as it offers a lower loss limit and a higher reward-to-risk ratio.
Conversely, for traders who are willing to take more risks, the "Aggressive" mode is more suitable. This mode, with its wider order block width, caters to those who prefer entering trades at higher prices.
🟣 Breaker Blocks (Supply and Demand)
Trading based on breaker blocks is the same as order blocks and the price in these zones is likely to be reversed.
🔵 Setting
🟣 Global Setting
Pivot Period of Order Blocks Detector : Enter the desired pivot period to identify the Order Block.
Order Block Validity Period (Bar) : You can specify the maximum time the Order Block remains valid based on the number of candles from the origin.
Mitigation Level Order Block : Determining the basic level of a Order Block. When the price hits the basic level, the Order Block due to mitigation.
Mitigation Level Breaker Block : Determining the basic level of a Breaker Block. When the price hits the basic level, the Breaker Block due to mitigation.
Switching Colors Theme Mode : Three modes "Off", "Light" and "Dark" are included in this parameter. "Light" mode is for color adjustment for use in "Light Mode".
"Dark" mode is for color adjustment for use in "Dark Mode" and "Off" mode turns off the color adjustment function and the input color to the function is the same as the output color.
🟣 Order Block Display
Show All Order Block : If it is turned off, only the last Order Block will be displayed.
Demand Main Order Block : Show or not show and specify color.
Demand Sub (Propulsion & BoS Origin) Order Block : Show or not show and specify color.
Supply Main Order Block : Show or not show and specify color.
Supply Sub (Propulsion & BoS Origin) Order Block : Show or not show and specify color.
🟣 Breaker Block Display
Show All Breaker Block : If it is turned off, only the last Breaker Block will be displayed.
Demand Main Breaker Block : Show or not show and specify color.
Demand Sub (Propulsion & BoS Origin) Breaker Block : Show or not show and specify color.
Supply Main Breaker Block : Show or not show and specify color.
Supply Sub (Propulsion & BoS Origin) Breaker Block : Show or not show and specify color.
🟣 Order Block Refinement
Refine Order Blocks : Enable or disable the refinement feature. Mode selection.
🟣 Alert
Alert Name : The name of the alert you receive.
Alert Demand OB Mitigation :
On / Off
Alert Demand BB Mitigation :
On / Off
Alert Supply OB Mitigation :
On / Off
Alert Supply BB Mitigation :
On / Off
Message Frequency :
This string parameter defines the announcement frequency. Choices include: "All" (activates the alert every time the function is called), "Once Per Bar" (activates the alert only on the first call within the bar), and "Once Per Bar Close" (the alert is activated only by a call at the last script execution of the real-time bar upon closing). The default setting is "Once per Bar".
Show Alert Time by Time Zone :
The date, hour, and minute you receive in alert messages can be based on any time zone you choose. For example, if you want New York time, you should enter "UTC-4". This input is set to the time zone "UTC" by default.
Display More Info :
Displays information about the price range of the order blocks (Zone Price) and the date, hour, and minute under "Display More Info".
If you do not want this information to appear in the received message along with the alert, you should set it to "Off".
