TPO Levels [VAH/POC/VAL] with Poor H/L, Single Prints & NPOCs### 🎯 Advanced Market Profile & Key Level Analysis
This script is a unique and comprehensive technical analysis tool designed to help traders understand market structure, value, and key liquidity levels using the principles of **Auction Market Theory** and **Market Profile**.
This script is unique (and shouldn't be censored) because :
It allows large history of levels to be displayed
Accurate as possible tick size
Doesn't draw a profile but only the actual levels
Supports multi-timeframe levels even on the daily mode giving macro context
There is no indicator out there that does it
While these concepts are universal, this indicator was built primarily for the dynamic, 24/7 nature of the **cryptocurrency market**. It helps you move beyond simple price action to understand *why* the market is moving, which is especially crucial in the volatile crypto space.
### ## 📊 The Concepts Behind the Calculations
To use this script effectively, it's important to understand the core concepts it is built upon. The entire script is self-contained and does not require other indicators.
* **What is Market Profile?**
Market Profile is a unique charting technique that organizes price and time data to reveal market structure. It's built from **Time Price Opportunities (TPOs)**, which are 30-minute periods of market activity. By stacking these TPOs, the script builds a distribution, showing which price levels were most accepted (heavily traded) and which were rejected (lightly traded) during a session.
* **What is the Value Area (VA)?**
The Value Area is the heart of the profile. It represents the price range where **70%** of the session's trading volume occurred. This is considered the "fair value" zone where both buyers and sellers were in general agreement.
* **Point of Control (POC):** The single price level with the most TPOs. This was the most accepted or "fairest" price of the session and acts as a gravitational line for price.
* **Value Area High (VAH):** The upper boundary of the 70% value zone.
* **Value Area Low (VAL):** The lower boundary of the 70% value zone.
VAH and VAL are dynamic support and resistance levels. Trading outside the previous session's value area can signal the start of a new trend.
***
### ## 📈 Key Features Explained
This script automatically calculates and displays the following critical market-generated information:
* **Multi-Timeframe Market Profile**
Automatically draws Daily, Weekly, and Monthly profiles, allowing you to analyze market structure across different time horizons. The script preserves up to 20 historical sessions to provide deep market context.
* **Naked Point of Control (nPOC)**
A "Naked" POC is a Point of Control from a previous session that has **not** been revisited by price. These levels often act as powerful magnets for price, representing areas of unfinished business that the market may seek to retest. The script tracks and displays Daily, Weekly, and Monthly nPOCs until they are touched.
* **Single Prints (Imbalance Zones)**
A Single Print is a price level where only one TPO traded during the session's development. This signifies a rapid, aggressive price move and an imbalanced market. These areas, like gaps in a traditional chart, are frequently revisited as the market seeks to "fill in" these thin parts of the profile.
* **Poor Structure (Unfinished Auctions)**
A **Poor High** or **Poor Low** occurs when the top or bottom of a profile is flat, with two or more TPOs at the extreme price. This suggests that the auction in that direction was weak and inconclusive. These weak structures often signal a high probability that price will eventually break that high or low.
***
### ## 💡 How to Use This Indicator
This tool is not a signal generator but an analytical framework to improve your trading decisions.
1. **Determine Market Context:** Start by asking: Is the current price trading *inside* or *outside* the previous session's Value Area?
* **Inside VA:** The market is in a state of balance or range-bound. Look for trades between the VAH and VAL.
* **Outside VA:** The market is in a state of imbalance and may be starting a trend. Look for continuation or acceptance of prices outside the prior value.
2. **Identify Key Levels:**
* Use historical **nPOCs** as potential profit targets or areas to watch for a price reaction.
* Treat historical **VAH** and **VAL** levels as significant support and resistance zones.
* Note where **Single Prints** are. These are often price magnets that may get "filled" in the future.
3. **Spot Weakness:**
* A **Poor High** suggests weak resistance that may be easily broken.
* A **Poor Low** suggests weak support, signaling a potential for a continued move lower if broken.
***
### ## ⚙️ Customization & Crypto Presets
The indicator is highly customizable, allowing you to change colors, transparency, the number of historical sessions, and more.
To help traders get started quickly, the indicator includes **built-in layout presets** specifically calibrated for major cryptocurrencies: ** BINANCE:BTCUSDT.P , BINANCE:ETHUSDT.P , and BINANCE:SOLUSDT.P **. These presets automatically adjust key visual parameters to better suit the unique price characteristics and volatility of each asset, providing an optimized view right out of the box.
***
### ## ⚠️ Disclaimer
This indicator is a tool for market analysis and should not be interpreted as direct buy or sell signals. It provides information based on historical price action, which does not guarantee future results. Trading involves significant risk, and you should always use proper risk management. This script is designed for use on standard chart types (e.g., Candlesticks, Bar) and may produce misleading information on non-standard charts.
在腳本中搜尋"point of control"

Smart MTF S/R Levels[BullByte]
Smart MTF S/R Levels
Introduction & Motivation
Support and Resistance (S/R) levels are the backbone of technical analysis. However, most traders face two major challenges:
Manual S/R Marking: Drawing S/R levels by hand is time-consuming, subjective, and often inconsistent.
Multi-Timeframe Blind Spots: Key S/R levels from higher or lower timeframes are often missed, leading to surprise reversals or missed opportunities.
Smart MTF S/R Levels was created to solve these problems. It is a fully automated, multi-timeframe, multi-method S/R detection and visualization tool, designed to give traders a complete, objective, and actionable view of the market’s most important price zones.
What Makes This Indicator Unique?
Multi-Timeframe Analysis: Simultaneously analyzes up to three user-selected timeframes, ensuring you never miss a critical S/R level from any timeframe.
Multi-Method Confluence: Integrates several respected S/R detection methods—Swings, Pivots, Fibonacci, Order Blocks, and Volume Profile—into a single, unified system.
Zone Clustering: Automatically merges nearby levels into “zones” to reduce clutter and highlight areas of true market consensus.
Confluence Scoring: Each zone is scored by the number of methods and timeframes in agreement, helping you instantly spot the most significant S/R areas.
Reaction Counting: Tracks how many times price has recently interacted with each zone, providing a real-world measure of its importance.
Customizable Dashboard: A real-time, on-chart table summarizes all key S/R zones, their origins, confluence, and proximity to price.
Smart Alerts: Get notified when price approaches high-confluence zones, so you never miss a critical trading opportunity.
Why Should a Trader Use This?
Objectivity: Removes subjectivity from S/R analysis by using algorithmic detection and clustering.
Efficiency: Saves hours of manual charting and reduces analysis fatigue.
Comprehensiveness: Ensures you are always aware of the most relevant S/R zones, regardless of your trading timeframe.
Actionability: The dashboard and alerts make it easy to act on the most important levels, improving trade timing and risk management.
Adaptability: Works for all asset classes (stocks, forex, crypto, futures) and all trading styles (scalping, swing, position).
The Gap This Indicator Fills
Most S/R indicators focus on a single method or timeframe, leading to incomplete analysis. Manual S/R marking is error-prone and inconsistent. This indicator fills the gap by:
Automating S/R detection across multiple timeframes and methods
Objectively scoring and ranking zones by confluence and reaction
Presenting all this information in a clear, actionable dashboard
How Does It Work? (Technical Logic)
1. Level Detection
For each selected timeframe, the script detects S/R levels using:
SW (Swing High/Low): Recent price pivots where reversals occurred.
Pivot: Classic floor trader pivots (P, S1, R1).
Fib (Fibonacci): Key retracement levels (0.236, 0.382, 0.5, 0.618, 0.786) over the last 50 bars.
Bull OB / Bear OB: Institutional price zones based on bullish/bearish engulfing patterns.
VWAP / POC: Volume Weighted Average Price and Point of Control over the last 50 bars.
2. Level Clustering
Levels within a user-defined % distance are merged into a single “zone.”
Each zone records which methods and timeframes contributed to it.
3. Confluence & Reaction Scoring
Confluence: The number of unique methods/timeframes in agreement for a zone.
Reactions: The number of times price has touched or reversed at the zone in the recent past (user-defined lookback).
4. Filtering & Sorting
Only zones within a user-defined % of the current price are shown (to focus on actionable areas).
Zones can be sorted by confluence, reaction count, or proximity to price.
5. Visualization
Zones: Shaded boxes on the chart (green for support, red for resistance, blue for mixed).
Lines: Mark the exact level of each zone.
Labels: Show level, methods by timeframe (e.g., 15m (3 SW), 30m (1 VWAP)), and (if applicable) Fibonacci ratios.
Dashboard Table: Lists all nearby zones with full details.
6. Alerts
Optional alerts trigger when price approaches a zone with confluence above a user-set threshold.
Inputs & Customization (Explained for All Users)
Show Timeframe 1/2/3: Enable/disable analysis for each timeframe (e.g., 15m, 30m, 1h).
Show Swings/Pivots/Fibonacci/Order Blocks/Volume Profile: Select which S/R methods to include.
Show levels within X% of price: Only display zones near the current price (default: 3%).
How many swing highs/lows to show: Number of recent swings to include (default: 3).
Cluster levels within X%: Merge levels close together into a single zone (default: 0.25%).
Show Top N Zones: Limit the number of zones displayed (default: 8).
Bars to check for reactions: How far back to count price reactions (default: 100).
Sort Zones By: Choose how to rank zones in the dashboard (Confluence, Reactions, Distance).
Alert if Confluence >=: Set the minimum confluence score for alerts (default: 3).
Zone Box Width/Line Length/Label Offset: Control the appearance of zones and labels.
Dashboard Size/Location: Customize the dashboard table.
How to Read the Output
Shaded Boxes: Represent S/R zones. The color indicates type (green = support, red = resistance, blue = mixed).
Lines: Mark the precise level of each zone.
Labels: Show the level, methods by timeframe (e.g., 15m (3 SW), 30m (1 VWAP)), and (if applicable) Fibonacci ratios.
Dashboard Table: Columns include:
Level: Price of the zone
Methods (by TF): Which S/R methods and how many, per timeframe (see abbreviation key below)
Type: Support, Resistance, or Mixed
Confl.: Confluence score (higher = more significant)
React.: Number of recent price reactions
Dist %: Distance from current price (in %)
Abbreviations Used
SW = Swing High/Low (recent price pivots where reversals occurred)
Fib = Fibonacci Level (key retracement levels such as 0.236, 0.382, 0.5, 0.618, 0.786)
VWAP = Volume Weighted Average Price (price level weighted by volume)
POC = Point of Control (price level with the highest traded volume)
Bull OB = Bullish Order Block (institutional support zone from bullish price action)
Bear OB = Bearish Order Block (institutional resistance zone from bearish price action)
Pivot = Pivot Point (classic floor trader pivots: P, S1, R1)
These abbreviations appear in the dashboard and chart labels for clarity.
Example: How to Read the Dashboard and Labels (from the chart above)
Suppose you are trading BTCUSDT on a 15-minute chart. The dashboard at the top right shows several S/R zones, each with a breakdown of which timeframes and methods contributed to their detection:
Resistance zone at 119257.11:
The dashboard shows:
5m (1 SW), 15m (2 SW), 1h (3 SW)
This means the level 119257.11 was identified as a resistance zone by one swing high (SW) on the 5-minute timeframe, two swing highs on the 15-minute timeframe, and three swing highs on the 1-hour timeframe. The confluence score is 6 (total number of method/timeframe hits), and there has been 1 recent price reaction at this level. This suggests 119257.11 is a strong resistance zone, confirmed by multiple swing highs across all selected timeframes.
Mixed zone at 118767.97:
The dashboard shows:
5m (2 SW), 15m (2 SW)
This means the level 118767.97 was identified by two swing points on both the 5-minute and 15-minute timeframes. The confluence score is 4, and there have been 19 recent price reactions at this level, indicating it is a highly reactive zone.
Support zone at 117411.35:
The dashboard shows:
5m (2 SW), 1h (2 SW)
This means the level 117411.35 was identified as a support zone by two swing lows on the 5-minute timeframe and two swing lows on the 1-hour timeframe. The confluence score is 4, and there have been 2 recent price reactions at this level.
Mixed zone at 118291.45:
The dashboard shows:
15m (1 SW, 1 VWAP), 5m (1 VWAP), 1h (1 VWAP)
This means the level 118291.45 was identified by a swing and VWAP on the 15-minute timeframe, and by VWAP on both the 5-minute and 1-hour timeframes. The confluence score is 4, and there have been 12 recent price reactions at this level.
Support zone at 117103.10:
The dashboard shows:
15m (1 SW), 1h (1 SW)
This means the level 117103.10 was identified by a single swing low on both the 15-minute and 1-hour timeframes. The confluence score is 2, and there have been no recent price reactions at this level.
Resistance zone at 117899.33:
The dashboard shows:
5m (1 SW)
This means the level 117899.33 was identified by a single swing high on the 5-minute timeframe. The confluence score is 1, and there have been no recent price reactions at this level.
How to use this:
Zones with higher confluence (more methods and timeframes in agreement) and more recent reactions are generally more significant. For example, the resistance at 119257.11 is much stronger than the resistance at 117899.33, and the mixed zone at 118767.97 has shown the most recent price reactions, making it a key area to watch for potential reversals or breakouts.
Tip:
“SW” stands for Swing High/Low, and “VWAP” stands for Volume Weighted Average Price.
The format 15m (2 SW) means two swing points were detected on the 15-minute timeframe.
Best Practices & Recommendations
Use with Other Tools: This indicator is most powerful when combined with your own price action analysis and risk management.
Adjust Settings: Experiment with timeframes, clustering, and methods to suit your trading style and the asset’s volatility.
Watch for High Confluence: Zones with higher confluence and more reactions are generally more significant.
Limitations
No Future Prediction: The indicator does not predict future price movement; it highlights areas where price is statistically more likely to react.
Not a Standalone System: Should be used as part of a broader trading plan.
Historical Data: Reaction counts are based on historical price action and may not always repeat.
Disclaimer
This indicator is a technical analysis tool and does not constitute financial advice or a recommendation to buy or sell any asset. Trading involves risk, and past performance is not indicative of future results. Always use proper risk management and consult a financial advisor if needed.

Advanced Volume Profile Levels (Working)This indicator is a powerful tool for traders who use volume profile analysis to identify significant price levels. It automatically calculates and plots the three most critical levels derived from volume data—the Point of Control (POC), Value Area High (VAH), and Value Area Low (VAL)—for three different timeframes simultaneously: the previous week, the previous day, and the current, live session.
The primary focus of this indicator is unmatched readability. It features dynamic, floating labels that stay clear of price action, combined with a high-contrast design to ensure you can see these crucial levels at a glance without any visual clutter.
Key Features
Multi-Session Analysis: Gain a complete market perspective by viewing levels from different timeframes on a single chart.
Weekly Levels: Identify the long-term areas of value and control from the prior week's trading activity.
Daily Levels: Pinpoint the most significant levels from the previous day's Regular Trading Hours (9:30 AM - 4:00 PM ET).
Current Session Levels: Track the developing value area and POC in real-time with a dynamic profile that updates with every bar.
Advanced Visuals for Clarity:
Floating Labels: The labels for the weekly and daily levels intelligently "float" on the right side of your chart, moving with the price to ensure they are never obscured by candles.
High-Contrast Design: Labels are designed for maximum readability with solid, opaque backgrounds and an automatic text color (black or white) that provides the best contrast against your chosen level color.
Trailing Current Levels: The labels for the current session neatly trail the most recent price action, providing an intuitive view of intra-day developments.
Comprehensive Customization: Tailor the indicator's appearance to your exact preferences.
Toggle each profile (Weekly, Daily, Current) on or off.
Individually set the color, line style (solid, dashed, dotted), and line width for each set of levels.
Adjust the text size, background transparency, and horizontal offset for all on-chart labels.
Information Hub:
On-Chart Price Labels: Each label clearly displays both the level name and its precise price (e.g., "D-POC: 22068.50").
Corner Table: An optional, clean table in the top-right corner provides a quick summary of all active weekly and daily level values.
Built-in Alerts:
Create alerts directly from the script to be notified whenever the price crosses above or below the weekly or daily Point of Control, helping you stay on top of key market movements.
How to Use
The levels provided by this indicator serve as powerful reference points for market activity:
Point of Control (POC): The price level with the highest traded volume. It acts as a magnet for price and represents the area of "fair value" for that session. Markets often test or revert to the POC.
Value Area High (VAH) & Value Area Low (VAL): These levels define the range where approximately 70% of the session's volume occurred. They are critical support and resistance zones.
Price acceptance above the VAH may signal a bullish breakout.
Price acceptance below the VAL may signal a bearish breakdown.
Rejection at the VAH or VAL often leads to price moving back across the value area towards the POC.

VolumeProfileLibrary "VolumeProfile"
Analyzes volume and price and calculates a volume profile, in particular the Point Of Control and Value Area values.
new(rowSizeInTicks, valueAreaCoverage, startTime)
Constructor method that creates a new Volume Profile
Parameters:
rowSizeInTicks (float) : Internal row size (aka resolution) of the volume profile. Useful for most futures contracts would be '1 / syminfo.mintick'. Default '4'.
valueAreaCoverage (int) : Percentage of total volume that is considered the Value Area. Default '70'
startTime (int) : Start time (unix timestamp in milliseconds) of the Volume Profile. Default 'time'.
Returns: VolumeProfile object
method calculatePOC(vp)
Calculates current Point Of Control of the VP
Namespace types: VolumeProfile
Parameters:
vp (VolumeProfile)
Returns: void
method calculateVA(vp)
Calculates current Value Area High and Low of the VP
Namespace types: VolumeProfile
Parameters:
vp (VolumeProfile)
Returns: void
method update(vp, h, l, v, t)
Processes new chart data and sorts volume into rows. Then calls calculatePOC() and calculateVA() to update the VP. Parameters are usually the output of request.security_lower_tf.
Namespace types: VolumeProfile
Parameters:
vp (VolumeProfile)
h (array) : Array of highs
l (array) : Array of lows
v (array) : Array of volumes
t (array) : Array of candle times
Returns: void
method setSessionHigh(vp, h)
Sets the high of the session the VP is tracking
Namespace types: VolumeProfile
Parameters:
vp (VolumeProfile)
h (float)
Returns: void
method setSessionLow(vp, l)
Sets the low of the session the VP is tracking
Namespace types: VolumeProfile
Parameters:
vp (VolumeProfile)
l (float)
Returns: void
method getPOC(vp)
Gets the current Point Of Control
Namespace types: VolumeProfile
Parameters:
vp (VolumeProfile)
Returns: Point Of Control (float)
method getVAH(vp)
Gets the current Value Area High
Namespace types: VolumeProfile
Parameters:
vp (VolumeProfile)
Returns: Value Area High (float)
method getVAL(vp)
Gets the current Value Area Low
Namespace types: VolumeProfile
Parameters:
vp (VolumeProfile)
Returns: Value Area Low (float)
VolumeProfile
Fields:
rowSizeInTicks (series float)
valueAreaCoverage (series int)
startTime (series int)
valueAreaHigh (series float)
pointOfControl (series float)
valueAreaLow (series float)
sessionHigh (series float)
sessionLow (series float)
volumeByRow (map)
totalVolume (series float)
pocRow (series float)
pocVol (series float)

nPOC Levels by Tyler### Explanation of the Pine Script
This Pine Script identifies and displays weekly naked Points of Control (nPOCs) on a TradingView chart. An nPOC represents a Point of Control (POC) from a previous week that has not been revisited by price action in subsequent weeks. These nPOCs are extended to the right as horizontal lines, indicating potential support or resistance levels.
#### Script Overview
1. **Indicator Declaration:**
```pinescript
//@version=5
indicator("Weekly nPOCs", overlay=true)
```
- The script is defined as a version 5 Pine Script.
- The `indicator` function sets the script's name ("Weekly nPOCs") and specifies that the indicator should be overlaid on the price chart (`overlay=true`).
2. **Function to Calculate POC:**
```pinescript
f_poc(_hl2, _vol) =>
var float vol_profile = na
if (na(vol_profile))
vol_profile := array.new_float(100, 0.0)
_bin_size = (high - low) / 100
for i = 0 to 99
if _hl2 >= low + i * _bin_size and _hl2 < low + (i + 1) * _bin_size
array.set(vol_profile, i, array.get(vol_profile, i) + _vol)
max_volume = array.max(vol_profile)
poc_index = array.indexof(vol_profile, max_volume)
poc_price = low + poc_index * _bin_size + _bin_size / 2
poc_price
```
- The function `f_poc` calculates the Point of Control (POC) for a given period.
- It takes two parameters: `_hl2` (the average of the high and low prices) and `_vol` (volume).
- A volume profile array (`vol_profile`) is initialized to store volume data across different price bins.
- The price range between the high and low is divided into 100 bins (`_bin_size`).
- The function iterates over each bin, accumulating the volumes for prices within each bin.
- The bin with the maximum volume is identified as the POC (`poc_price`).
3. **Variables to Store Weekly Data:**
```pinescript
var float poc = na
var float prev_poc = na
var line poc_lines = na
if na(poc_lines)
poc_lines := array.new_line(0)
```
- `poc` stores the current week's POC.
- `prev_poc` stores the previous week's POC.
- `poc_lines` is an array to store lines representing nPOCs. The array is initialized if it is `na` (not initialized).
4. **Calculate Weekly POC:**
```pinescript
is_new_week = ta.change(time('W')) != 0
if (is_new_week)
prev_poc := poc
poc := f_poc(hl2, volume)
if not na(prev_poc)
line new_poc_line = line.new(x1=bar_index, y1=prev_poc, x2=bar_index + 100, y2=prev_poc, color=color.red, width=2)
label.new(x=bar_index, y=prev_poc, text="nPOC", style=label.style_label_down, color=color.red, textcolor=color.white)
array.push(poc_lines, new_poc_line)
```
- `is_new_week` checks if the current bar is the start of a new week using the `ta.change(time('W'))` function.
- If it's a new week, the previous week's POC is stored in `prev_poc`, and the current week's POC is calculated using `f_poc`.
- If `prev_poc` is not `na`, a new line (`new_poc_line`) representing the nPOC is created, extending it to the right (for 100 bars).
- A label is created at the `prev_poc` level, marking it as "nPOC".
- The new line is added to the `poc_lines` array.
5. **Remove Old Lines:**
```pinescript
if array.size(poc_lines) > 52
line.delete(array.shift(poc_lines))
```
- This section ensures that only the last 52 weeks of nPOCs are kept to avoid cluttering the chart.
- If the `poc_lines` array contains more than 52 lines, the oldest line is deleted using `array.shift`.
6. **Plot the Current Week's POC as a Reference:**
```pinescript
plot(poc, title="Current Weekly POC", color=color.blue, linewidth=2, style=plot.style_line)
```
- The current week's POC is plotted as a blue line on the chart for reference.
#### Summary
This script calculates and identifies weekly Points of Control (POCs) and marks them as nPOCs if they remain untouched by subsequent price action. These nPOCs are displayed as horizontal lines extending to the right, providing traders with potential support or resistance levels. The script also manages the number of lines plotted to maintain a clear and uncluttered chart.

Weighted Volume Profile Pivot Points | Flux Charts💎 GENERAL OVERVIEW
Introducing our new Weighted Volume Profile Pivot Points (WVPPP) Indicator! This indicator renders a volume profile using the latest pivot points, automatically adjusting itself when new pivots occur. The pivoting mode can be switched between default pivot points and order blocks mode. It can be adjusted to give more weight to recent or past candlesticks, or can be used as a normal volume profile. For more information, please read the full write-up.
Features of the new Weighted Volume Profile Pivot Points (WVPPP) Indicator :
Renders Volume Profile Of The Range Between Latest Pivots
Two Pivoting Modes Including Order Blocks Mode
Adjustable Weighthing Towards Past or Recent
Customizable Row Count & Maximum Distance
Left or Right Alignment
More Styling Options
🚩UNIQUENESS
This indicator stands out with two key features. One is it's ability to weight volumes based on their distance to the current time. Giving weight to volumes may offer new trading opportunities to traders as they can now see the most recent Point Of Control (POC) or a more powerful but past POC based on their choice. Another key feature the indicator has is that it automatically finds latest valid pivot points, and uses that range for the volume profile. The range changes dynamically as new pivots points emerge. You can select between normal pivot points and order blocks mode. The indicator also has a variety of useful styling settings such as aligning the volume profile to the right or the left of the chart, POC Line styling and color settings for bullish & bearish volumes.
📌 HOW DOES IT WORK ?
A volume profile provides an in-depth look at trading activity over a period of time by plotting a histogram on the price axis. This indicator can also give weight to volumes based on their distance to the current time, essentially determining their importance for the profile. The range which the volume profile will cover is determined by the latest pivot points. Here is how it works step-by-step :
1. Determine how much candlesticks the volume profile will cover (Analyze Bars setting)
2. Find the latest pivot points. If the mode is set to "Pivots", the pivot points are the candlesticks which has the highest / lowest wick in X amount of bars (Swing Length setting). If the mode is set to "Order Blocks", the volume profile range is the area between the latest buyside order block and the sellside order block. Order blocks occur when there is a high amount of market orders exist on a price range. It is possible to find order blocks using specific candlestick formations on the chart. For more information about the order block detection, I suggest you checking the write-up of our "Volumized Order Blocks" script. Increasing the "Swing Length" setting is recommended when the mode is set to "Pivots", as this will help in finding stronger pivot points.
3. Make a range using the latest pivot points, then divide it into rows (Row Count setting)
4. Then for each candlestick, add it's volume to the corresponding row in the range. Note that the volume can be added into several rows if it overlaps with them all.
5. If the candlestick is a bullish candlestick, we add it's volume into the bullish volume of the row, if it's a bearish candlestick, we add it to the bearish volume of the row.
With the weighted volume mode, which is activated if "Volume Weighthing" setting is set to "Recent" or "Past", all volumes get a penalty based on their distance to the latest candletstick. For example, if the setting is set to "Recent", the latest candlestick contributes it's volume by 100% to the corresponding row, but the candlestick which is 50 candlesticks far from the current candlestick only contributes it's volume by ~17% to the row. The same applies to the "Past" setting, but in the reversed order, where past candlesticks have more priority than the current ones.
Volume contribution percent for "Recent" setting : ((100 * 0.85) / (i + 1)) + (100 * (1.0 - 0.85))
Volume contribution percent for "Past" setting : ((100 * 0.85) * ((i + 1) / N)) + (100 * (1.0 - 0.85))
Where i = candlestick index from right to left, N = total number of candlesticks analyzed by the volume profile.
The Point Of Control (POC) line is drawn from the row with the most total volume, and is generally considered as a strong level because a lot of trading volume happened on that particular row. Traders may use this line as a support & resistance level.
We believe that automatically ranging the volume profile to important pivot points will help traders see crucial volume information easier without unnecessary hassle. Traders can use this indicator to have an insight of areas which price moves quickly without much volume, or see areas that holds the price still for much longer and plan their trades accordingly.
⚙️SETTINGS
1. General Configuration
Mode -> The pivoting mode that is switchable between "Pivots" and "Order Blocks" as described in the write-up. Please read the upper section to understand how this setting works.
Analyze Bars -> Total amount of bars that will be analyzed by the indicator from right to left.
Row Count -> The amount of rows that will the vertical range between pivot points will be divided into.
Volume Weighting -> The volume weighting mode as explained in the write-up.
2. Style
Highlight Sessions -> The volume profile sessions will be highlighted with a blue tint. To prevent confusion, highlighting will not work if the alignment is set to "Right".
Align To -> The alignment of the volume profile.

ATR Price Targets w/POC
ATR Price Targets with Point of Control (POC):
This script is designed to help traders identify key price target levels based on configurable multipliers of the the Average True Range (ATR) and the volume based Point of Control (POC). It is intended for intraday traders looking to capture significant price movements.
Features:
ATR Price Targets: The script calculates three levels of price targets above and below the first bar of the day, based on the ATR of the last 22 days (assuming 5-minute candles). These targets are adjustable through the settings, allowing traders to set their own ATR multipliers.
Point of Control (POC): The POC is determined as the price level of the highest volume bar since the start time, providing an indication of the most traded price within the specified period.
Customizable Start Time: Traders can set their desired start time for the calculation of price targets and POC, allowing for flexibility in aligning the indicator with their trading strategy.
Plot Lines: The ATR price targets are plotted as lines for easy visualization on the chart.
Usage:
The ATR price targets can be used as potential take-profit or stop-loss levels.
The POC can serve as a key level for assessing market sentiment and potential reversals.
Traders can adjust the ATR multipliers and start time based on their specific trading style and market conditions.
Settings:
ATR Price Targets 1, 2, 3: Adjust the multipliers for the ATR price targets. By default, these are set to 1*ATR for T1+/T1-, 3*ATR for T2+/T2- and ATR*6 for T3+/T3-. Adjust with caution as the price targets found in defaults have proven to be more accurate over intraday cycles for volatile stocks.
Start Hour & Start Minute: Set the starting hour and minute for the calculations. By default, these are set to the opening 5 minute intraday bar, but can also be set to the opening bar of pre-market hours.

lib_profileLibrary "lib_profile"
a library with functions to calculate a volume profile for either a set of candles within the current chart, or a single candle from its lower timeframe security data. All you need is to feed the
method delete(this)
deletes this bucket's plot from the chart
Namespace types: Bucket
Parameters:
this (Bucket)
method delete(this)
Namespace types: Profile
Parameters:
this (Profile)
method delete(this)
Namespace types: Bucket
Parameters:
this (Bucket )
method delete(this)
Namespace types: Profile
Parameters:
this (Profile )
method update(this, top, bottom, value, fraction)
updates this bucket's data
Namespace types: Bucket
Parameters:
this (Bucket)
top (float)
bottom (float)
value (float)
fraction (float)
method update(this, tops, bottoms, values)
update this Profile's data (recalculates the whole profile and applies the result to this object) TODO optimisation to calculate this incremental to improve performance in realtime on high resolution
Namespace types: Profile
Parameters:
this (Profile)
tops (float ) : array of range top/high values (either from ltf or chart candles using history() function
bottoms (float ) : array of range bottom/low values (either from ltf or chart candles using history() function
values (float ) : array of range volume/1 values (either from ltf or chart candles using history() function (1s can be used for analysing candles in bucket/price range over time)
method tostring(this)
allows debug print of a bucket
Namespace types: Bucket
Parameters:
this (Bucket)
method draw(this, start_t, start_i, end_t, end_i, args, line_color)
allows drawing a line in a Profile, representing this bucket and it's value + it's value's fraction of the Profile total value
Namespace types: Bucket
Parameters:
this (Bucket)
start_t (int) : the time x coordinate of the line's left end (depends on the Profile box)
start_i (int) : the bar_index x coordinate of the line's left end (depends on the Profile box)
end_t (int) : the time x coordinate of the line's right end (depends on the Profile box)
end_i (int) : the bar_index x coordinate of the line's right end (depends on the Profile box)
args (LineArgs type from robbatt/lib_plot_objects/24) : the default arguments for the line style
line_color (color) : the color override for POC/VAH/VAL lines
method draw(this, forced_width)
draw all components of this Profile (Box, Background, Bucket lines, POC/VAH/VAL overlay levels and labels)
Namespace types: Profile
Parameters:
this (Profile)
forced_width (int) : allows to force width of the Profile Box, overrides the ProfileArgs.default_size and ProfileArgs.extend arguments (default: na)
method init(this)
Namespace types: ProfileArgs
Parameters:
this (ProfileArgs)
method init(this)
Namespace types: Profile
Parameters:
this (Profile)
profile(tops, bottoms, values, resolution, vah_pc, val_pc, bucket_buffer)
split a chart/parent bar into 'resolution' sections, figure out in which section the most volume/time was spent, by analysing a given set of (intra)bars' top/bottom/volume values. Then return price center of the bin with the highest volume, essentially marking the point of control / highest volume (poc) in the chart/parent bar.
Parameters:
tops (float ) : array of range top/high values (either from ltf or chart candles using history() function
bottoms (float ) : array of range bottom/low values (either from ltf or chart candles using history() function
values (float ) : array of range volume/1 values (either from ltf or chart candles using history() function (1s can be used for analysing candles in bucket/price range over time)
resolution (int) : amount of buckets/price ranges to sort the candle data into (analyse how much volume / time was spent in a certain bucket/price range) (default: 25)
vah_pc (float) : a threshold percentage (of values' total) for the top end of the value area (default: 80)
val_pc (float) : a threshold percentage (of values' total) for the bottom end of the value area (default: 20)
bucket_buffer (Bucket ) : optional buffer of empty Buckets to fill, if omitted a new one is created and returned. The buffer length must match the resolution
Returns: poc (price level), vah (price level), val (price level), poc_index (idx in buckets), vah_index (idx in buckets), val_index (idx in buckets), buckets (filled buffer or new)
create_profile(start_idx, tops, bottoms, values, resolution, vah_pc, val_pc, args)
split a chart/parent bar into 'resolution' sections, figure out in which section the most volume/time was spent, by analysing a given set of (intra)bars' top/bottom/volume values. Then return price center of the bin with the highest volume, essentially marking the point of control / highest volume (poc) in the chart/parent bar.
Parameters:
start_idx (int) : the bar_index at which the Profile should start drawing
tops (float ) : array of range top/high values (either from ltf or chart candles using history() function
bottoms (float ) : array of range bottom/low values (either from ltf or chart candles using history() function
values (float ) : array of range volume/1 values (either from ltf or chart candles using history() function (1s can be used for analysing candles in bucket/price range over time)
resolution (int) : amount of buckets/price ranges to sort the candle data into (analyse how much volume / time was spent in a certain bucket/price range) (default: 25)
vah_pc (float) : a threshold percentage (of values' total) for the top end of the value area (default: 80)
val_pc (float) : a threshold percentage (of values' total) for the bottom end of the value area (default: 20)
args (ProfileArgs)
Returns: poc (price level), vah (price level), val (price level), poc_index (idx in buckets), vah_index (idx in buckets), val_index (idx in buckets), buckets (filled buffer or new)
history(src, len, offset)
allows fetching an array of values from the history series with offset from current candle
Parameters:
src (int)
len (int)
offset (int)
history(src, len, offset)
allows fetching an array of values from the history series with offset from current candle
Parameters:
src (float)
len (int)
offset (int)
history(src, len, offset)
allows fetching an array of values from the history series with offset from current candle
Parameters:
src (bool)
len (int)
offset (int)
history(src, len, offset)
allows fetching an array of values from the history series with offset from current candle
Parameters:
src (string)
len (int)
offset (int)
Bucket
Fields:
idx (series int) : the index of this Bucket within the Profile starting with 0 for the lowest Bucket at the bottom of the Profile
value (series float) : the value of this Bucket, can be volume or time, for using time pass and array of 1s to the update function
top (series float) : the top of this Bucket's price range (for calculation)
btm (series float) : the bottom of this Bucket's price range (for calculation)
center (series float) : the center of this Bucket's price range (for plotting)
fraction (series float) : the fraction this Bucket's value is compared to the total of the Profile
plot_bucket_line (Line type from robbatt/lib_plot_objects/24) : the line that resembles this bucket and it's valeu in the Profile
ProfileArgs
Fields:
show_poc (series bool) : whether to plot a POC line across the Profile Box (default: true)
show_profile (series bool) : whether to plot a line for each Bucket in the Profile Box, indicating the value per Bucket (Price range), e.g. volume that occured in a certain time and price range (default: false)
show_va (series bool) : whether to plot a VAH/VAL line across the Profile Box (default: false)
show_va_fill (series bool) : whether to fill the 'value' area between VAH/VAL line (default: false)
show_background (series bool) : whether to fill the Profile Box with a background color (default: false)
show_labels (series bool) : whether to add labels to the right end of the POC/VAH/VAL line (default: false)
show_price_levels (series bool) : whether add price values to the labels to the right end of the POC/VAH/VAL line (default: false)
extend (series bool) : whether extend the Profile Box to the current candle (default: false)
default_size (series int) : the default min. width of the Profile Box (default: 30)
args_poc_line (LineArgs type from robbatt/lib_plot_objects/24) : arguments for the poc line plot
args_va_line (LineArgs type from robbatt/lib_plot_objects/24) : arguments for the va line plot
args_poc_label (LabelArgs type from robbatt/lib_plot_objects/24) : arguments for the poc label plot
args_va_label (LabelArgs type from robbatt/lib_plot_objects/24) : arguments for the va label plot
args_profile_line (LineArgs type from robbatt/lib_plot_objects/24) : arguments for the Bucket line plots
args_profile_bg (BoxArgs type from robbatt/lib_plot_objects/24)
va_fill_color (series color) : color for the va area fill plot
Profile
Fields:
start (series int) : left x coordinate for the Profile Box
end (series int) : right x coordinate for the Profile Box
resolution (series int) : the amount of buckets/price ranges the Profile will dissect the data into
vah_threshold_pc (series float) : the percentage of the total data value to mark the upper threshold for the main value area
val_threshold_pc (series float) : the percentage of the total data value to mark the lower threshold for the main value area
args (ProfileArgs) : the style arguments for the Profile Box
h (series float) : the highest price of the data
l (series float) : the lowest price of the data
total (series float) : the total data value (e.g. volume of all candles, or just one each to analyse candle distribution over time)
buckets (Bucket ) : the Bucket objects holding the data for each price range bucket
poc_bucket_index (series int) : the Bucket index in buckets, that holds the poc Bucket
vah_bucket_index (series int) : the Bucket index in buckets, that holds the vah Bucket
val_bucket_index (series int) : the Bucket index in buckets, that holds the val Bucket
poc (series float) : the according price level marking the Point Of Control
vah (series float) : the according price level marking the Value Area High
val (series float) : the according price level marking the Value Area Low
plot_poc (Line type from robbatt/lib_plot_objects/24)
plot_vah (Line type from robbatt/lib_plot_objects/24)
plot_val (Line type from robbatt/lib_plot_objects/24)
plot_poc_label (Label type from robbatt/lib_plot_objects/24)
plot_vah_label (Label type from robbatt/lib_plot_objects/24)
plot_val_label (Label type from robbatt/lib_plot_objects/24)
plot_va_fill (LineFill type from robbatt/lib_plot_objects/24)
plot_profile_bg (Box type from robbatt/lib_plot_objects/24)
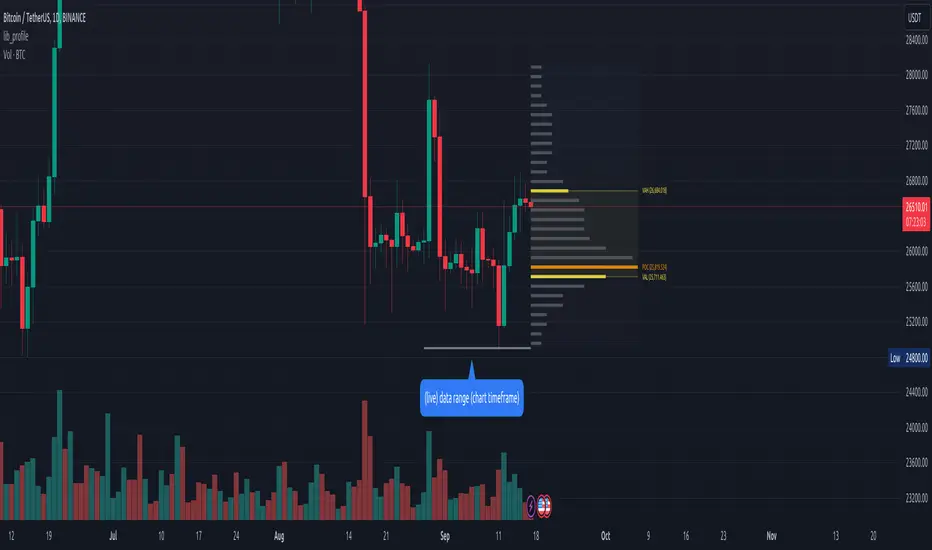
Chart Champions - Part 3 - SessionsThank you for sparing you time to read my indicator.
This indicator has been created as a suite of 3. This was to ensure that those with only the Free Trading View account could benefit (with their restriction to 3 indicators). Please ensure you install each indicator and read each indicator write up to fully understand what has tried to achieved.
Chart Champions – Part 1 –Lvls nPOC VWAPS
This indicator is broken down into:
• Levels
• VWAPS
• Naked Point of Control
Levels
It displays the levels to the right of the price Axis to enable the user to have a cleaner chart.
The below levels will automatically appear:
dOpen – pdHigh – pdLow – pdEQ – pwEQ
Optional Levels include:
mOpen – pmOpen – pdOpen – dbyOpen – wOpen – pwOpen
VWAPs
Optional VWAPs
Daily (including pdVWAP close) – Weekly – Monthly
Naked Points of Control (nPOC)
To view the nPOC move the chart back in time to pick up the nPOCs.
Chart Champions – Part 2 – CCV IBs POC
This indicator is broken down into:
• Chart Champions Value
• Initial Balance
• Points of Control
Chart Champions Value (CCV)
CCV is based on the 80% rule of the dOpen opening outside of the pdVAH/pdVAL. Please do you own research to fully understand how this trading strategy works (readily avaliable online).
Initial Balance (IB)
IB is based on the first 60 minutes of the market opening. It captures the highest and lowest points within that 60 minutes. Please do you own research to fully understand how this trading strategy works (readily avaliable online).
Points of Control (POCs)
POC are the price levels where the most volume was traded.
Developing POC (dPOC) will constantly move with volume/price action through out the day.
Optional POCs
Previous Day POC (pdPOC) – Day Before Yesterday POC (dbyPOC)
Chart Champions – Part 3 – Sessions - Manual Input
This indicator is broken down into:
• Manual Inputs (daily, weekly, monthly)
• IGOR SessionsTtimes
• Pre + Market Openings
Manual Input
Daily x3
Weekly x 3
Monthly x 3
This allows the trader to put in specific levels.
IGOR Session Times
This is a user specific requirement to highlight cetain times during the day, displayed at the bottom of the chart in the colour strip.
Pre + Market Openings
This allows the user to see when pre market trading has started and with the live maket has started, displayed at the top of the chart in colours.
A huge thank you goes out to:
Stackoverflow users AnyDozer and Bjorn.
TV user ahancock for allow me use of this code.
Disclaimer the lower the timeframe the more information it processes.

Chart Champions - Part 2 - CCV IBs POCsThank you for sparing you time to read my indicator.
This indicator has been created as a suite of 3. This was to ensure that those with only the Free Trading View account could benefit (with their restriction to 3 indicators). Please ensure you install each indicator and read each indicator write up to fully understand what has tried to achieved.
Chart Champions – Part 1 –Lvls nPOC VWAPS
This indicator is broken down into:
• Levels
• VWAPS
• Naked Point of Control
Levels
It displays the levels to the right of the price Axis to enable the user to have a cleaner chart.
The below levels will automatically appear:
dOpen – pdHigh – pdLow – pdEQ – pwEQ
Optional Levels include:
mOpen – pmOpen – pdOpen – dbyOpen – wOpen – pwOpen
VWAPs
Optional VWAPs
Daily (including pdVWAP close) – Weekly – Monthly
Naked Points of Control (nPOC)
To view the nPOC move the chart back in time to pick up the nPOCs.
Chart Champions – Part 2 – CCV IBs POC
This indicator is broken down into:
• Chart Champions Value
• Initial Balance
• Points of Control
Chart Champions Value (CCV)
CCV is based on the 80% rule of the dOpen opening outside of the pdVAH/pdVAL. Please do you own research to fully understand how this trading strategy works (readily avaliable online).
Initial Balance (IB)
IB is based on the first 60 minutes of the market opening. It captures the highest and lowest points within that 60 minutes. Please do you own research to fully understand how this trading strategy works (readily avaliable online).
Points of Control (POCs)
POC are the price levels where the most volume was traded.
Developing POC (dPOC) will constantly move with volume/price action through out the day.
Optional POCs
Previous Day POC (pdPOC) – Day Before Yesterday POC (dbyPOC)
Chart Champions – Part 3 – Sessions - Manual Input
This indicator is broken down into:
• Manual Inputs (daily, weekly, monthly)
• IGOR SessionsTtimes
• Pre + Market Openings
Manual Input
Daily x3
Weekly x 3
Monthly x 3
This allows the trader to put in specific levels.
IGOR Session Times
This is a user specific requirement to highlight cetain times during the day, displayed at the bottom of the chart in the colour strip.
Pre + Market Openings
This allows the user to see when pre market trading has started and with the live maket has started, displayed at the top of the chart in colours.
A huge thank you goes out to:
Stackoverflow users AnyDozer and Bjorn.
TV user ahancock for allow me use of this code.
Disclaimer the lower the timeframe the more information it processes.
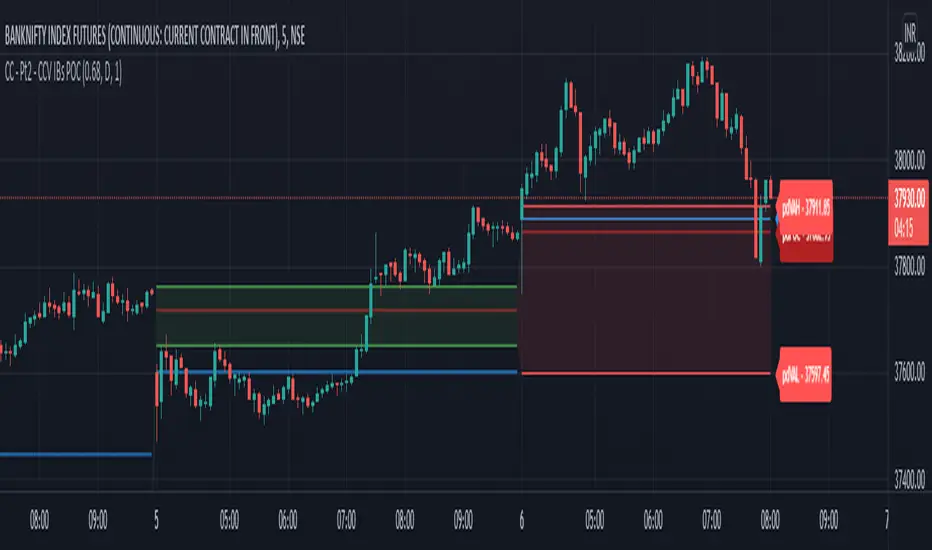
Chart Champions - Part 1 - nPOC - Levels - VWAPsThank you for sparing you time to read my indicator.
This indicator has been created as a suite of 3. This was to ensure that those with only the Free Trading View account could benefit (with their restriction to 3 indicators). Please ensure you install each indicator and read each indicator write up to fully understand what has tried to achieved.
Chart Champions – Part 1 –Lvls nPOC VWAPS
This indicator is broken down into:
• Levels
• VWAPS
• Naked Point of Control
Levels
It displays the levels to the right of the price Axis to enable the user to have a cleaner chart.
The below levels will automatically appear:
dOpen – pdHigh – pdLow – pdEQ – pwEQ
Optional Levels include:
mOpen – pmOpen – pdOpen – dbyOpen – wOpen – pwOpen
VWAPs
Optional VWAPs
Daily (including pdVWAP close) – Weekly – Monthly
Naked Points of Control (nPOC)
To view the nPOC move the chart back in time to pick up the nPOCs.
Chart Champions – Part 2 – CCV IBs POC
This indicator is broken down into:
• Chart Champions Value
• Initial Balance
• Points of Control
Chart Champions Value (CCV)
CCV is based on the 80% rule of the dOpen opening outside of the pdVAH/pdVAL. Please do you own research to fully understand how this trading strategy works (readily avaliable online).
Initial Balance (IB)
IB is based on the first 60 minutes of the market opening. It captures the highest and lowest points within that 60 minutes. Please do you own research to fully understand how this trading strategy works (readily avaliable online).
Points of Control (POCs)
POC are the price levels where the most volume was traded.
Developing POC (dPOC) will constantly move with volume/price action through out the day.
Optional POCs
Previous Day POC (pdPOC) – Day Before Yesterday POC (dbyPOC)
Chart Champions – Part 3 – Sessions - Manual Input
This indicator is broken down into:
• Manual Inputs (daily, weekly, monthly)
• IGOR SessionsTtimes
• Pre + Market Openings
Manual Input
Daily x3
Weekly x 3
Monthly x 3
This allows the trader to put in specific levels.
IGOR Session Times
This is a user specific requirement to highlight cetain times during the day, displayed at the bottom of the chart in the colour strip.
Pre + Market Openings
This allows the user to see when pre market trading has started and with the live maket has started, displayed at the top of the chart in colours.
A huge thank you goes out to:
Stackoverflow users AnyDozer and Bjorn.
TV user ahancock for allow me use of this code.
Disclaimer the lower the timeframe the more information it processes.

Trading Ideas - Chart Champions Value - Points of Interest Trading Ideas is based on having visual Points of Interest.
The indicator displays:
- dOpen : Daily Open
- dPOC: Developing Point of Control
- pdPOC : Previous Day Point of Control
- dbyPOC : Day Before Yesterday Point of Control
Initial Balance (High, low, mid points for the first hour (UTC 0000)
- IB High : Initial Balance High
- IB Mid : Initial Balance Middle
- IB Low : Initial Balance Low
Chart Champions Value ( CCV ) is based on Daniel - Chart Champions theory explained in his educational videos.
That if the previous day is a range day and price action (PA) closes:
Above the previous days Value Area High (pdVAH) then there is an 80% chance of it retracing back to previous days Value Area Low (pdVAL)
Below the previous days Value Area Low (pdVAL) then there is an 80% chance of it going back up to the previous days Value Area High (pdVAH)
The CCV check can be ticked on and off for a quick visual to see if the setup could potentially be in play (if green then CCV could be play for that day).
Settings/Configuration
The calculated Value Area (VA) can be amended.
It is recommend to change the resolution to that of your symbol. For example BTC resolution 1, XRP resolution 0.00001.
As seen below having key Points of Interest can make you think twice before going into a trade:
My thanks go to:
ahancock for allowing usage of his script.
AnyDozer and Bjorn Mistiaen on Stack Overflow for all their assistance.
Any feedback will be gratefully received.

Volume Profile Free Ultra SLI (100 Levels Value Area VWAP) - RRBVolume Profile Free Ultra SLI by RagingRocketBull 2019
Version 1.0
This indicator calculates Volume Profile for a given range and shows it as a histogram consisting of 100 horizontal bars.
This is basically the MAX SLI version with +50 more Pinescript v4 line objects added as levels.
It can also show Point of Control (POC), Developing POC, Value Area/VWAP StdDev High/Low as dynamically moving levels.
Free accounts can't access Standard TradingView Volume Profile, hence this indicator.
There are several versions: Free Pro, Free MAX SLI, Free Ultra SLI, Free History. This is the Free Ultra SLI version. The Differences are listed below:
- Free Pro: 25 levels, +Developing POC, Value Area/VWAP High/Low Levels, Above/Below Area Dimming
- Free MAX SLI: 50 levels, 2x SLI modes for Buy/Sell or even higher res 150 levels
- Free Ultra SLI: 100 levels, packed to the limit, 2x SLI modes for Buy/Sell or even higher res 300 levels
- Free History: auto highest/lowest, historic poc/va levels for each session
Features:
- High-Res Volume Profile with up to 100 levels (line implementation)
- 2x SLI modes for even higher res: 300 levels with 3x vertical SLI, 100 buy/sell levels with 2x horiz SLI
- Calculate Volume Profile on full history
- POC, Developing POC Levels
- Buy/Sell/Total volume modes
- Side Cover
- Value Area, VAH/VAL dynamic levels
- VWAP High/Low dynamic levels with Source, Length, StdDev as params
- Show/Hide all levels
- Dim Non Value Area Zones
- Custom Range with Highlighting
- 3 Anchor points for Volume Profile
- Flip Levels Horizontally
- Adjustable width, offset and spacing of levels
- Custom Color for POC/VA/VWAP levels, Transparency for buy/sell levels
WARNING:
- Compilation Time: 1 min 20 sec
Usage:
- specify max_level/min_level/spacing (required)
- select range (start_bar, range length), confirm with range highlighting
- select volume type: Buy/Sell/Total
- select mode Value Area/VWAP to show corresponding levels
- flip/select anchor point to position the buy/sell levels
- use Horiz Buy/Sell SLI mode with 100 or Vertical SLI with 300 levels if needed
- use POC/Developing POC/VA/VWAP High/Low as S/R levels. Usually daily values from 1-3 days back are used as levels for the current day.
SLI:
use SLI modes to extend the functionality of the indicator:
- Horiz Buy/Sell 2x SLI lets you view 100 Buy/Sell Levels at the same time
- Vertical Max_Vol 3x SLI lets you increase the resolution to 300 levels
- you need at least 2 instances of the indicator attached to the same chart for SLI to work
1) Enable Horiz SLI:
- attach 2 indicator instances to the chart
- make sure all instances have the same min_level/max_level/range/spacing settings
- select volume type for each instance: you can have a buy/sell or buy/total or sell/total SLI. Make sure your buy volume instance is the last attached to be displayed on top of sell/total instances without overlapping.
- set buy_sell_sli_mode to true for indicator instances with volume_type = buy/sell, for type total this is optional.
- this basically tells the script to calculate % lengths based on total volume instead of individual buy/sell volumes and use ext offset for sell levels
- Sell Offset is calculated relative to Buy Offset to stack/extend sell after buy. Buy Offset = Zero - Buy Length. Sell Offset = Buy Offset - Sell Length = Zero - Buy Length - Sell Length
- there are no master/slave instances in this mode, all indicators are equal, poc/va levels are not affected and can work independently, i.e. one instance can show va levels, another - vwap.
2) Enable Vertical SLI:
- attach the first instance and evaluate the full range to roughly determine where is the highest max_vol/poc level i.e. 0..20000, poc is in the bottom half (third, middle etc) or
- add more instances and split the full vertical range between them, i.e. set min_level/max_level of each corresponding instance to 0..10000, 10000..20000 etc
- make sure all instances have the same range/spacing settings
- an instance with a subrange containing the poc level of the full range is now your master instance (bottom half). All other instances are slaves, their levels will be calculated based on the max_vol/poc of the master instance instead of local values
- set show_max_vol_sli to true for the master instance. for slave instances this is optional and can be used to check if master/slave max_vol values match and slave can read the master's value. This simply plots the max_vol value
- you can also attach all instances and set show_max_vol_sli to true in all of them - the instance with the largest max_vol should become the master
Auto/Manual Ext Max_Vol Modes:
- for auto vertical max_vol SLI mode set max_vol_sli_src in all slave instances to the max_vol of the master indicator: "VolumeProfileFree_MAX_RRB: Max Volume for Vertical SLI Mode". It can be tricky with 2+ instances
- in case auto SLI mode doesn't work - assign max_vol_sli_ext in all slave instances the max_vol value of the master indicator manually and repeat on each change
- manual override max_vol_sli_ext has higher priority than auto max_vol_sli_src when both values are assigned, when they are 0 and close respectively - SLI is disabled
- master/slave max_vol values must match on each bar at all times to maintain proper level scale, otherwise slave's levels will look larger than they should relative to the master's levels.
- Max_vol (red) is the last param in the long list of indicator outputs
- the only true max_vol/poc in this SLI mode is the master's max_vol/poc. All poc/va levels in slaves will be irrelevant and are disabled automatically. Slaves can only show VWAP levels.
- VA Levels of the master instance in this SLI mode are calculated based on the subrange, not the whole range and may be inaccurate. Cross check with the full range.
WARNING!
- auto mode max_vol_sli_src is experimental and may not work as expected
- you can only assign auto mode max_vol_sli_src = max_vol once due to some bug with unhandled exception/buffer overflow in Tradingview. Seems that you can clear the value only by removing the indicator instance
- sometimes you may see a "study in error state" error when attempting to set it back to close. Remove indicator/Reload chart and start from scratch
- volume profile may not finish to redraw and freeze in an ugly shape after an UI parameter change when max_vol_sli_src is assigned a max_vol value. Assign it to close - VP should redraw properly, but it may not clear the assigned max_vol value
- you can't seem to be able to assign a proper auto max_vol value to the 3rd slave instance
- 2x Vertical SLI works and tested in both auto/manual, 3x SLI - only manual seems to work (you can have a mixed mode: 2nd instance - auto, 3rd - manual)
Notes:
- This code uses Pinescript v3 compatibility framework
- This code is 20x-30x faster (main for cycle is removed) especially on lower tfs with long history - only 4-5 sec load/redraw time vs 30-60 sec of the old Pro versions
- Instead of repeatedly calculating the total sum of volumes for the whole range on each bar, vol sums are now increased on each bar and passed to the next in the range making it a per range vs per bar calculation that reduces time dramatically
- 100 levels consist of 50 main plot levels and 50 line objects used as alternate levels, differences are:
- line objects are always shown on top of other objects, such as plot levels, zero line and side cover, it's not possible to cover/move them below.
- all line objects have variable lengths, use actual x,y coords and don't need side cover, while all plot levels have a fixed length of 100 bars, use offset and require cover.
- all key properties of line objects, such as x,y coords, color can be modified, objects can be moved/deleted, while this is not possible for static plot levels.
- large width values cause line objects to expand only up/down from center while their length remains the same and stays within the level's start/end points similar to an area style.
- large width values make plot levels expand in all directions (both h/v), beyond level start/end points, sometimes overlapping zero line, making them an inaccurate % length representation, as opposed to line objects/plot levels with area style.
- large width values translate into different widths on screen for line objects and plot levels.
- you can't compensate for this unwanted horiz width expansion of plot levels because width uses its own units, that don't translate into bars/pixels.
- line objects are visible only when num_levels > 50, plot levels are used otherwise
- Since line objects are lines, plot levels also use style line because other style implementations will break the symmetry/spacing between levels.
- if you don't see a volume profile check range settings: min_level/max_level and spacing, set spacing to 0 (or adjust accordingly based on the symbol's precision, i.e. 0.00001)
- you can view either of Buy/Sell/Total volumes, but you can't display Buy/Sell levels at the same time using a single instance (this would 2x reduce the number of levels). Use 2 indicator instances in horiz buy/sell sli mode for that.
- Volume Profile/Value Area are calculated for a given range and updated on each bar. Each level has a fixed length. Offsets control visible level parts. Side Cover hides the invisible parts.
- Custom Color for POC/VA/VWAP levels - UI Style color/transparency can only change shape's color and doesn't affect textcolor, hence this additional option
- Custom Width - UI Style supports only width <= 4, hence this additional option
- POC is visible in both modes. In VWAP mode Developing POC becomes VWAP, VA High and Low => VWAP High and Low correspondingly to minimize the number of plot outputs
- You can't change buy/sell level colors from input (only transparency) - this requires 2x plot outputs => 2x reduces the number of levels to fit the max 64 limit. That's why 2 additional plots are used to dim the non Value Area zones
- You can change level transparency of line objects. Due to Pinescript limitations, only discrete values are supported.
- Inverse transp correlation creates the necessary illusion of "covered" line objects, although they are shown on top of the cover all the time
- If custom lines_transp is set the illusion will break because transp range can't be skewed easily (i.e. transp 0..100 is always mapped to 100..0 and can't be mapped to 50..0)
- transparency can applied to lines dynamically but nva top zone can't be completely removed because plot/mixed type of levels are still used when num_levels < 50 and require cover
- transparency can't be applied to plot levels dynamically from script this can be done only once from UI, and you can't change plot color for the past length bars
- All buy/sell volume lengths are calculated as % of a fixed base width = 100 bars (100%). You can't set show_last from input to change it
- Range selection/Anchoring is not accurate on charts with time gaps since you can only anchor from a point in the future and measure distance in time periods, not actual bars, and there's no way of knowing the number of future gaps in advance.
- Adjust Width for Log Scale mode now also works on high precision charts with small prices (i.e. 0.00001)
- in Adjust Width for Log Scale mode Level1 width extremes can be capped using max deviation (when level1 = 0, shift = 0 width becomes infinite)
- There's no such thing as buy/sell volume, there's just volume, but for the purposes of the Volume Profile method, assume: bull candle = buy volume, bear candle = sell volume
P.S. I am your grandfather, Luke! Now, join the Dark Side in your father's steps or be destroyed! Once more the Sith will rule the Galaxy, and we shall have peace...

Quadro Volume Profile [BigBeluga]🔵 OVERVIEW
The Quadro Volume Profile is a precision-engineered volume profiling tool that segments market activity into four distinct quadrants surrounding the current price. By separating bullish and bearish volume above and below the current price, it helps traders identify dominant forces and high-interest price zones with ease. Each quadrant includes label annotations showing total volume and its share of overall activity — delivering powerful insights into the market’s internal structure.
🔵 CONCEPTS
Four-Quadrant Volume Distribution : Volume is separated into Buy and Sell profiles both above and below the current price.
Directional Volume Logic : Bullish and bearish candle volume is allocated to specific bins, creating color-coded volume stacks.
Dynamic PoC Detection : Point of Control (PoC) levels are calculated per quadrant and optionally displayed.
Lookback-Based Anchoring : The volume histogram is anchored to a fixed lookback window, ensuring consistency and historical context.
Label-Based Analytics : Each quadrant displays a labeled breakdown of direction, total volume, and percentage weight of total activity.
🔵 FEATURES
Four separate volume profiles:
Upper Left: Bearish volume (Sell Quad above price)
Upper Right: Bullish volume (Buy Quad above price)
Lower Left: Bullish volume (Buy Quad below price)
Lower Right: Bearish volume (Sell Quad below price)
Live Labels for Each Quad:
Displays BUY or SELL direction
Shows total volume per quadrant (e.g. 607.49K)
Displays percent share of total quad volume (e.g. 18.87%)
Toggle visibility for each profile and each Point of Control (PoC) dashed PoC lines with volume annotations
Adjustable calculation period (lookBack), number of bins, and horizontal offset
Color gradient intensity represents volume strength per bin
Auto-cleaning visuals to keep the chart uncluttered
Gradient color control for Buy and Sell volumes
Clean midline split between upper and lower quadrants
🔵 HOW TO USE
Select your desired calculation period (default: 200 bars) to define the range for volume analysis.
Adjust the bins parameter for more or less resolution in volume distribution.
Toggle each quadrant on/off depending on your preference using the settings panel:
“Upper Sell Quad” – shows bearish volume above current price (left)
“Upper Buy Quad” – shows bullish volume above current price (right)
“Lower Buy Quad” – shows bullish volume below current price (left)
“Lower Sell Quad” – shows bearish volume below current price (right)
Enable or disable PoC lines for each quad to highlight where volume peaked.
Use the gradient coloring to identify volume imbalances — sharp differences between opposing quads often indicate key zones of rejection or breakout.
Monitor the midline level which splits the four quadrants — it serves as a psychological pivot zone.
🔵 CONCLUSION
The Quadro Volume Profile offers a powerful and visually intuitive way to dissect market activity around price. By splitting volume into four quadrants, traders can better interpret order flow, identify dominant volume zones, and spot potential reversals or continuation setups. Whether you're trading breakouts, liquidity sweeps, or range-bound behavior — this tool adds a structured layer of volume context to your charting workflow.

Composite Time ProfileComposite Time Profile Overlay (CTPO) - Market Profile Compositing Tool
Automatically composite multiple time periods to identify key areas of balance and market structure
What is the Composite Time Profile Overlay?
The Composite Time Profile Overlay (CTPO) is a Pine Script indicator that automatically composites multiple time periods to identify key areas of balance and market structure. It's designed for traders who use market profile concepts and need to quickly identify where price is likely to find support or resistance.
The indicator analyzes TPO (Time Price Opportunity) data across different timeframes and merges overlapping profiles to create composite levels that represent the most significant areas of balance. This helps you spot where institutional traders are likely to make decisions based on accumulated price action.
Why Use CTPO for Market Profile Trading?
Eliminate Manual Compositing Work
Instead of manually drawing and compositing profiles across different timeframes, CTPO does this automatically. You get instant access to composite levels without spending time analyzing each individual period.
Spot Areas of Balance Quickly
The indicator highlights the most significant areas of balance by compositing overlapping profiles. These areas often act as support and resistance levels because they represent where the most trading activity occurred across multiple time periods.
Focus on What Matters
Rather than getting lost in individual session profiles, CTPO shows you the composite levels that have been validated across multiple timeframes. This helps you focus on the levels that are most likely to hold.
How CTPO Works for Market Profile Traders
Automatic Profile Compositing
CTPO uses a proprietary algorithm that:
- Identifies period boundaries based on your selected timeframe (sessions, daily, weekly, monthly, or auto-detection)
- Calculates TPO profiles for each period using the C2M (Composite 2 Method) row sizing calculation
- Merges overlapping profiles using configurable overlap thresholds (default 50% overlap required)
- Updates composite levels as new price action develops in real-time
Key Levels for Market Profile Analysis
The indicator displays:
- Value Area High (VAH) and Value Area Low (VAL) levels calculated from composite TPO data
- Point of Control (POC) levels where most trading occurred across all composited periods
- Composite zones representing areas of balance with configurable transparency
- 1.618 Fibonacci extensions for breakout targets based on composite range
Multiple Timeframe Support
- Sessions: For intraday market profile analysis
- Daily: For swing trading with daily profiles
- Weekly: For position trading with weekly structure
- Monthly: For long-term market profile analysis
- Auto: Automatically selects timeframe based on your chart
Trading Applications for Market Profile Users
Support and Resistance Trading
Use composite levels as dynamic support and resistance zones. These levels often hold because they represent areas where significant trading decisions were made across multiple timeframes.
Breakout Trading
When composite levels break, they often lead to significant moves. The indicator calculates 1.618 Fibonacci extensions to give you clear targets for breakout trades.
Mean Reversion Strategies
Value Area levels represent the price range where most trading activity occurred. These levels often act as magnets, drawing price back when it moves too far from the mean.
Institutional Level Analysis
Composite levels represent areas where institutional traders have made significant decisions. These levels often hold more weight than traditional technical analysis levels because they're based on actual trading activity.
Key Features for Market Profile Traders
Smart Compositing Logic
- Automatic overlap detection using price range intersection algorithms
- Configurable overlap thresholds (minimum 50% overlap required for merging)
- Dead composite identification (profiles that become engulfed by newer composites)
- Real-time updates as new price action develops using barstate.islast optimization
Visual Customization
- Customizable colors for active, broken, and dead composites
- Adjustable transparency levels for each composite state
- Premium/Discount zone highlighting based on current price vs composite range
- TPO aggression coloring using TPO distribution analysis to identify buying/selling pressure
- Fibonacci level extensions with 1.618 target calculations based on composite range
Clean Chart Presentation
- Only shows the most relevant composite levels (maximum 10 active composites)
- Eliminates clutter from individual session profiles
- Focuses on areas of balance that matter most to current price action
Real-World Trading Examples
Day Trading with Session Composites
Use session-based composites to identify intraday areas of balance. The VAH and VAL levels often act as natural profit targets and stop-loss levels for scalping strategies.
Swing Trading with Daily Composites
Daily composites provide excellent swing trading levels. Look for price reactions at composite zones and use the 1.618 extensions for profit targets.
Position Trading with Weekly Composites
Weekly composites help identify major trend changes and long-term areas of balance. These levels often hold for months or even years.
Risk Management
Composite levels provide natural stop-loss levels. If a composite level breaks, it often signals a significant shift in market sentiment, making it an ideal place to exit losing positions.
Why Composite Levels Work
Composite levels work because they represent areas where significant trading decisions were made across multiple timeframes. When price returns to these levels, traders often remember the previous price action and make similar decisions, creating self-fulfilling prophecies.
The compositing process uses a proprietary algorithm that ensures only levels validated across multiple time periods are displayed. This means you're looking at levels that have proven their significance through actual market behavior, not just random technical levels.
Technical Foundation
The indicator uses TPO (Time Price Opportunity) data combined with price action analysis to identify areas of balance. The C2M row sizing method ensures accurate profile calculations, while the overlap detection algorithm (minimum 50% price range intersection) ensures only truly significant composites are displayed. The algorithm calculates row size based on ATR (Average True Range) divided by 10, then converts to tick size for precise level calculations.
How the Code Actually Works
1. Period Detection and ATR Calculation
The code first determines the appropriate timeframe based on your chart:
- 1m-5m charts: Session-based profiles
- 15m-2h charts: Daily profiles
- 4h charts: Weekly profiles
- 1D charts: Monthly profiles
For each period type, it calculates the number of bars needed for ATR calculation:
- Sessions: 540 minutes divided by chart timeframe
- Daily: 1440 minutes divided by chart timeframe
- Weekly: 7 days worth of minutes divided by chart timeframe
- Monthly: 30 days worth of minutes divided by chart timeframe
2. C2M Row Size Calculation
The code calculates True Range for each bar in the determined period:
- True Range = max(high-low, |high-prevClose|, |low-prevClose|)
- Averages all True Range values to get ATR
- Row Size = (ATR / 10) converted to tick size
- This ensures each TPO row represents a meaningful price movement
3. TPO Profile Generation
For each period, the code:
- Creates price levels from lowest to highest price in the range
- Each level is separated by the calculated row size
- Counts how many bars touch each price level (TPO count)
- Finds the level with highest count = Point of Control (POC)
- Calculates Value Area by expanding from POC until 68.27% of total TPO blocks are included
4. Overlap Detection Algorithm
When a new profile is created, the code checks if it overlaps with existing composites:
- Calculates overlap range = min(currentVAH, prevVAH) - max(currentVAL, prevVAL)
- Calculates current profile range = currentVAH - currentVAL
- Overlap percentage = (overlap range / current profile range) * 100
- If overlap >= 50%, profiles are merged into a composite
5. Composite Merging Logic
When profiles overlap, the code creates a new composite by:
- Taking the earliest start bar and latest end bar
- Using the wider VAH/VAL range (max of both profiles)
- Keeping the POC from the profile with more TPO blocks
- Marking the composite as "active" until price breaks through
6. Real-Time Updates
The code uses barstate.islast to optimize performance:
- Only recalculates on the last bar of each period
- Updates active composite with live price action if enabled
- Cleans up old composites to prevent memory issues
- Redraws all visual elements from scratch each bar
7. Visual Rendering System
The code uses arrays to manage drawing objects:
- Clears all lines/boxes arrays on every bar
- Iterates through composites array to redraw everything
- Uses different colors for active, broken, and dead composites
- Calculates 1.618 Fibonacci extensions for broken composites
Getting Started with CTPO
Step 1: Choose Your Timeframe
Select the period type that matches your trading style:
- Use "Sessions" for day trading
- Use "Daily" for swing trading
- Use "Weekly" for position trading
- Use "Auto" to let the indicator choose based on your chart timeframe
Step 2: Customize the Display
Adjust colors, transparency, and display options to match your charting preferences. The indicator offers extensive customization options to ensure it fits seamlessly into your existing analysis.
Step 3: Identify Key Levels
Look for:
- Composite zones (blue boxes) - major areas of balance
- VAH/VAL lines - value area boundaries
- POC lines - areas of highest trading activity
- 1.618 extension lines - breakout targets
Step 4: Develop Your Strategy
Use these levels to:
- Set entry points near composite zones
- Place stop losses beyond composite levels
- Take profits at 1.618 extension levels
- Identify trend changes when major composites break
Perfect for Market Profile Traders
If you're already using market profile concepts in your trading, CTPO eliminates the manual work of compositing profiles across different timeframes. Instead of spending time analyzing each individual period, you get instant access to the composite levels that matter most.
The indicator's automated compositing process ensures you're always looking at the most relevant areas of balance, while its real-time updates keep you informed of changes as they happen. Whether you're a day trader looking for intraday levels or a position trader analyzing long-term structure, CTPO provides the market profile intelligence you need to succeed.
Streamline Your Market Profile Analysis
Stop wasting time on manual compositing. Let CTPO do the heavy lifting while you focus on executing profitable trades based on areas of balance that actually matter.
Ready to Streamline Your Market Profile Trading?
Add the Composite Time Profile Overlay to your charts today and experience the difference that automated profile compositing can make in your trading performance.

Volume Profile AnalysisThe Volume Profile Dashboard is a professional-grade analysis tool built for TradingView. It focuses on displaying a comprehensive volume profile breakdown within a dashboard format directly on the chart. The purpose of this tool is to help traders quickly assess buy versus sell volume dynamics, momentum, and sentiment in order to support informed trading decisions.
Instead of plotting simple bars, this indicator uses a detailed table and visual progress bar to summarize live and historical market activity. By condensing key metrics into a structured format, traders can analyse market behaviour without manually calculating or switching between multiple indicators.
________________________________________
How the Script Works
1. Data Gathering
The script uses lower-timeframe price and volume data to calculate buy volume, sell volume, and total traded volume for the current and previous candles.
2. Volume Allocation
Buy and sell volumes are estimated by looking at the candle’s range (high to low) and how the closing price aligns within that range. The closer the close is to the high, the stronger the buying pressure. The closer the close is to the low, the stronger the selling pressure.
3. Delta and Momentum
o Delta measures the difference between buy and sell volume.
o Volume momentum compares the current candle’s activity to the previous one, showing if interest is rising or fading.
4. Point of Control (POC)
An average of high, low, and close is calculated to give an approximate “point of control” level—an area of balance where buyers and sellers previously agreed on price.
5. Dashboard Visualization
All these calculations are displayed inside a clean dashboard table with separate rows for the current candle, previous candle, and a summary row. Icons, colors, and progress bars make it visually intuitive.
6. On-Chart Progress Indicator
A dynamic horizontal progress bar is plotted on the chart above price, showing the balance between buy and sell volume for the latest activity.
7. Alerts
Built-in alerts trigger when strong buying or selling pressure is detected or when there is a significant spike in total traded volume.
________________________________________
How This Tool Can Be Used
• Intraday Trading: Quickly gauge whether buyers or sellers are in control of the market at any moment.
• Swing Trading: Compare momentum shifts between candles to identify early trend reversals.
• Risk Management: Use delta and sentiment signals to confirm whether to hold or reduce exposure.
• Confirmation: Align the volume profile dashboard with other indicators (such as RSI, MACD, or trendlines) for stronger trading conviction.
________________________________________
Using Mixed Indicators for Decisions
This dashboard alone provides volume insights, but better decisions come when it is combined with other tools:
• Pairing it with an RSI can show whether heavy buying is happening in overbought conditions.
• Combining with a SuperTrend or moving averages can confirm if volume momentum aligns with the price trend.
• Overlaying support/resistance levels can identify whether strong buy/sell signals occur at critical levels.
Mixed indicators prevent relying on one signal alone, reducing false trades.
________________________________________
Importance of This Tool
• Clarity: Condenses complex volume data into a simple, visual format.
• Speed: Traders can react faster with pre-calculated buy/sell percentages.
• Precision: Highlights hidden imbalances that are not obvious from candles alone.
• Professional-grade dashboard: Offers an institutional-style view of market behavior directly within TradingView.
________________________________________
Parameters in the Dashboard Table
• Period: Shows whether the row is for the current or previous candle, along with trend arrows.
• Price Range: The high–low range of the candle.
• Total Volume: The sum of buy and sell activity.
• Buy Volume / Sell Volume: Separated distribution of transactions leaning bullish or bearish.
• Delta: The net difference between buy and sell volumes, highlighting pressure imbalance.
• Buy % / Sell %: The percentage contribution of each side to total volume.
• POC: An average reference level where market consensus was strongest.
• Progress: A graphical bar showing buy vs sell dominance.
• Signal: Simplified output like Strong Buy, Buy, Strong Sell, Sell, Neutral.
• Summary Row: Compares changes between the current and previous candles and gives overall market sentiment.
________________________________________
Stock Market Disclaimer
This tool is for educational and informational purposes only. It does not constitute financial advice, investment advice, or trading recommendations. The stock market and cryptocurrency markets involve high risk. Traders and investors should do their own research and consult licensed financial advisors before making investment decisions. Past performance is not indicative of future results.
________________________________________
Misuse Disclaimer
This script has been developed as per TradingView’s rules and is intended for responsible trading analysis only. Any misuse, redistribution, or modification outside of TradingView’s policies is discouraged. The author and platform are not responsible for financial losses, misinterpretation of signals, or misuse of the code.
________________________________________
Disclaimer
Training & Educational Only — This material and the indicator are provided for educational purposes only. Nothing here is investment advice or a solicitation to buy or sell financial instruments. Past simulated or historical performance does not predict future results. Always perform full back testing and risk management, and consider seeking advice from a qualified financial professional before trading with real capital.
________________________________________

Volume Profile + Pivot Levels [ChartPrime]⯁ OVERVIEW
Volume Profile + Pivot Levels combines a rolling volume profile with price pivots to surface the most meaningful levels in your selected lookback window. It builds a left-side profile from traded volume, highlights the session’s Point of Control (PoC) , and then filters pivot highs/lows so only those aligned with significant profile volume are promoted to chart levels. Each promoted level extends forward until price retests it—so your chart stays focused on levels that actually matter.
⯁ KEY FEATURES
Rolling Volume Profile (Period & Resolution)
Calculates a profile over the last Period bars (default 200). The profile is discretized into Volume Profile Resolution bins (default 50) between the highest high and lowest low inside the window. Each bin accumulates traded volume and is drawn as a smooth left-side polyline for compact, lightweight rendering.
HL = array.new()
// collect highs/lows over 'start' bars to define profile range
for i = 0 to start - 1
HL.push(high ), HL.push(low )
H = HL.max(), L = HL.min()
bin_size = (H - L) / bins
// accumulate per-bin volume
for i = 0 to bins - 1
for j = 0 to start - 1
if close >= (L + bin_sizei) - bin_size and close < (L + bin_size*(i+1)) + bin_size
Bins += volume
Delta-Aware Coloring
The script tracks up-minus-down volume across all period to compute a net Delta . The profile, PoC line, and PoC label adopt a teal tone when net positive, and maroon when net negative—an immediate read on buyer/seller dominance inside the window.
Point of Control (PoC) + Volume Label
Automatically marks the highest-volume bin as the PoC . A horizontal PoC line extends to the last bar, and a label shows the absolute volume at the PoC. Toggle visibility via PoC input.
Pivot Detection with Volume Filter
Identifies raw pivots using Length (default 10) on both sides of the bar. Each candidate pivot is then validated against the profile: only pivots that land within their bin and meet or exceed the Filter % threshold (percentage of PoC volume) are promoted to chart levels. This removes weak, low-participation pivots.
// pivot promotion when volume% >= pivotFilter
if abs(mid - p.value) <= bin_size and volPercent >= pivotFilter
// draw labeled pivot level
line.new(p.index - pivotLength, p.value, p.index + pivotLength, p.value, width = 2)
Forward-Extending, Self-Stopping Levels
Promoted pivot levels extend forward as dotted rays. As soon as price intersects a level (high/low straddles it), that level stops extending—so your chart doesn’t clutter with stale zones.
Concise Level Labels (Volume + %)
Each promoted pivot prints a compact label at the pivot bar with its bin’s absolute volume and percentage of PoC volume (ordering flips for highs vs. lows for quick read).
Lightweight Visuals
The volume profile is rendered as a smooth polyline rather than dozens of boxes, keeping charts responsive even at higher resolutions.
⯁ SETTINGS
Volume Profile → Period : Lookback window used to compute the profile (max 500).
Volume Profile → Resolution : Number of bins; higher = finer structure.
Volume Profile → PoC : Toggle PoC line and volume label.
Pivots → Display : Show/hide volume-validated pivot levels.
Pivots → Length : Pivot detection left/right bars.
Pivots → Filter % 0–100 : Minimum bin strength (as % of PoC) required to promote a pivot level.
⯁ USAGE
Read PoC direction/color for a quick net-flow bias within your window.
Prioritize promoted pivot levels —they’re backed by meaningful participation.
Watch for first retests of promoted levels; the line will stop extending once tested.
Adjust Period / Resolution to match your timeframe (scalps → higher resolution, shorter period; swings → lower resolution, longer period).
Tighten or loosen Filter % to control how selective the level promotion is.
⯁ WHY IT’S UNIQUE
Instead of plotting every pivot or every profile bar, this tool cross-checks pivots against the profile’s internal volume weighting . You only see levels where price structure and liquidity overlap—clean, data-driven levels that self-retire after interaction, so you can focus on what the market actually defends.

VPOC Harmonics - Liquidity-Weighted Price / Time RatiosVPOC Harmonics - Liquidity-Weighted Price / Time Ratios
Summary
This indicator transforms a swing’s price range, duration, and liquidity profile into a structured set of price-per-bar ratios. By anchoring two points and manually entering the swing’s VPOC (highest-volume price), it generates candidate compression values that unify price, time, and liquidity structure. These values can be applied to chart scaling, harmonic testing, and liquidity-aware market geometry.
________________________________________
Overview
Most swing analysis tools only consider price (ΔP) and time (N bars). This script goes further by incorporating the VPOC (Point of Control) — the price with the highest traded volume — directly into swing geometry.
• Anchors define the swing’s Low (L), High (H), and bar count (N).
• The user manually enters the VPOC (highest-volume price).
• The indicator then computes a suite of ratios that integrate range, duration, and liquidity placement.
The output is a table of liquidity-weighted price-per-bar candidates, designed for compression testing and harmonic analysis across swings and instruments.
________________________________________
How to Use
1. Select a Swing
- Place Anchor A and Anchor B to define the swing’s Low, High, and bar count.
2. Find the VPOC
- Apply TradingView’s Fixed Range Volume Profile tool over the same swing.
- Identify the Point of Control (POC) — the price level with the highest traded volume.
3. Enter the VPOC
- Manually input the POC into the indicator settings.
4. Review Outputs
- The table will display candidate ratios expressed mainly as price-per-bar values.
5. Apply in Practice
- Use the ratios as chart compression inputs or as benchmarks for testing harmonic alignments across swings.
________________________________________
Outputs
Swing & Inputs
• Bars (N): total bar count of the swing.
• Low (L): swing low price.
• High (H): swing high price.
• ΔP = H − L: price range.
• Mid = (L + H) ÷ 2: midpoint price.
• VPOC (V): user-entered highest-volume price.
• Base slope s0 = ΔP ÷ N: average change per bar.
• π-adjusted slope sπ = (π × ΔP) ÷ (2 × N): slope adjusted for half-cycle arc geometry.
________________________________________
VPOC Harmony Ratios (L, H, V, N)
• λ = (V − L) ÷ ΔP: normalized VPOC position within the range.
• R = (V − L) ÷ (H − V): symmetry ratio comparing lower vs. upper segment.
• s1 = (V − L) ÷ N: slope from Low → VPOC.
• s2 = (H − V) ÷ N: slope from VPOC → High.
________________________________________
Blended Means (s1, s2)
These combine the two segment slopes in different ways:
• HM(s1,s2) = 2 ÷ (1/s1 + 1/s2): Harmonic mean, emphasizes the smaller slope.
• GM(s1,s2) = sqrt(s1 × s2): Geometric mean, balances both slopes proportionally.
• RMS(s1,s2) = sqrt((s1² + s2²) ÷ 2): Root-mean-square, emphasizes the larger slope.
• L2 = sqrt(s1² + s2²): Euclidean norm, the vector length of both slopes combined.
________________________________________
Slope Blends
• Quadratic weighting: s_quad = s0 × ((V−L)² + (H−V)²) ÷ (ΔP²)
• Tilted slope: s_tilt = s0 × (0.5 + λ)
• Entropy-scaled slope: s_ent = s0 × H2(λ), with H2(λ) = −
________________________________________
Curvature & Liquidity Extensions
• π-arc × λ: s_arc = sπ × λ
• Liquidity-π: s_piV = sπ × (V ÷ Mid)
________________________________________
Scale-Normalized Families
With k = sqrt(H ÷ L):
• k (scale factor) = sqrt(H ÷ L)
• s_comp = s0 ÷ k: compressed slope candidate
• s_exp = s0 × k: expanded slope candidate
• Exponentiated blends:
- s_kλ = s0 × k^(2λ−1)
- s_φλ = s0 × φ^(2λ−1), with φ = golden ratio ≈ 1.618
- s_√2λ = s0 × (√2)^(2λ−1)
________________________________________
Practical Application
All formulas generate liquidity-weighted price-per-bar ratios that integrate range, time, and VPOC placement.
These values are designed for:
• Chart compression settings
• Testing harmonic alignments across swings
• Liquidity-aware scaling experiments
________________________________________

Volume Profile Grid [Alpha Extract]A sophisticated volume distribution analysis system that transforms market activity into institutional-grade visual profiles, revealing hidden support/resistance zones and market participant behavior. Utilizing advanced price level segmentation, bullish/bearish volume separation, and dynamic range analysis, the Volume Profile Grid delivers comprehensive market structure insights with Point of Control (POC) identification, Value Area boundaries, and volume delta analysis. The system features intelligent visualization modes, real-time sentiment analysis, and flexible range selection to provide traders with clear, actionable volume-based market context.
🔶 Dynamic Range Analysis Engine
Implements dual-mode range selection with visible chart analysis and fixed period lookback, automatically adjusting to current market view or analyzing specified historical periods. The system intelligently calculates optimal bar counts while maintaining performance through configurable maximum limits, ensuring responsive profile generation across all timeframes with institutional-grade precision.
// Dynamic period calculation with intelligent caching
get_analysis_period() =>
if i_use_visible_range
chart_start_time = chart.left_visible_bar_time
current_time = last_bar_time
time_span = current_time - chart_start_time
tf_seconds = timeframe.in_seconds()
estimated_bars = time_span / (tf_seconds * 1000)
range_bars = math.floor(estimated_bars)
final_bars = math.min(range_bars, i_max_visible_bars)
math.max(final_bars, 50) // Minimum threshold
else
math.max(i_periods, 50)
🔶 Advanced Bull/Bear Volume Separation
Employs sophisticated candle classification algorithms to separate bullish and bearish volume at each price level, with weighted distribution based on bar intersection ratios. The system analyzes open/close relationships to determine volume direction, applying proportional allocation for doji patterns and ensuring accurate representation of buying versus selling pressure across the entire price spectrum.
🔶 Multi-Mode Volume Visualization
Features three distinct display modes for bull/bear volume representation: Split mode creates mirrored profiles from a central axis, Side by Side mode displays sequential bull/bear segments, and Stacked mode separates volumes vertically. Each mode offers unique insights into market participant behavior with customizable width, thickness, and color parameters for optimal visual clarity.
// Bull/Bear volume calculation with weighted distribution
for bar_offset = 0 to actual_periods - 1
bar_high = high
bar_low = low
bar_volume = volume
// Calculate intersection weight
weight = math.min(bar_high, next_level) - math.max(bar_low, current_level)
weight := weight / (bar_high - bar_low)
weighted_volume = bar_volume * weight
// Classify volume direction
if bar_close > bar_open
level_bull_volume += weighted_volume
else if bar_close < bar_open
level_bear_volume += weighted_volume
else // Doji handling
level_bull_volume += weighted_volume * 0.5
level_bear_volume += weighted_volume * 0.5
🔶 Point of Control & Value Area Detection
Implements institutional-standard POC identification by locating the price level with maximum volume accumulation, providing critical support/resistance zones. The Value Area calculation uses sophisticated sorting algorithms to identify the price range containing 70% of trading volume, revealing the market's accepted value zone where institutional participants concentrate their activity.
🔶 Volume Delta Analysis System
Incorporates real-time volume delta calculation with configurable dominance thresholds to identify significant bull/bear imbalances. The system visually highlights price levels where buying or selling pressure exceeds threshold percentages, providing immediate insight into directional volume flow and potential reversal zones through color-coded delta indicators.
// Value Area calculation using 70% volume accumulation
total_volume_sum = array.sum(total_volumes)
target_volume = total_volume_sum * 0.70
// Sort volumes to find highest activity zones
for i = 0 to array.size(sorted_volumes) - 2
for j = i + 1 to array.size(sorted_volumes) - 1
if array.get(sorted_volumes, j) > array.get(sorted_volumes, i)
// Swap and track indices for value area boundaries
// Accumulate until 70% threshold reached
for i = 0 to array.size(sorted_indices) - 1
accumulated_volume += vol
array.push(va_levels, array.get(volume_levels, idx))
if accumulated_volume >= target_volume
break
❓How It Works
🔶 Weighted Volume Distribution
Implements proportional volume allocation based on the percentage of each bar that intersects with price levels. When a bar spans multiple levels, volume is distributed proportionally based on the intersection ratio, ensuring precise representation of trading activity across the entire price spectrum without double-counting or volume loss.
🔶 Real-Time Profile Generation
Profiles regenerate on each bar close when in visible range mode, automatically adapting to chart zoom and scroll actions. The system maintains optimal performance through intelligent caching mechanisms and selective line updates, ensuring smooth operation even with maximum resolution settings and extended analysis periods.
🔶 Market Sentiment Analysis
Features comprehensive volume analysis table displaying total volume metrics, bullish/bearish percentages, and overall market sentiment classification. The system calculates volume dominance ratios in real-time, providing immediate insight into whether buyers or sellers control the current price structure with percentage-based sentiment thresholds.
🔶 Visual Profile Mapping
Provides multi-layered visual feedback through colored volume bars, POC line highlighting, Value Area boundaries, and optional delta indicators. The system supports profile mirroring for alternative perspectives, line extension for future reference, and customizable label positioning with detailed price information at critical levels.
Why Choose Volume Profile Grid
The Volume Profile Grid represents the evolution of volume analysis tools, combining traditional volume profile concepts with modern visualization techniques and intelligent analysis algorithms. By integrating dynamic range selection, sophisticated bull/bear separation, and multi-mode visualization with POC/Value Area detection, it provides traders with institutional-quality market structure analysis that adapts to any trading style. The comprehensive delta analysis and sentiment monitoring system eliminates guesswork while the flexible visualization options ensure optimal clarity across all market conditions, making it an essential tool for traders seeking to understand true market dynamics through volume-based price discovery.

Dynamic Support and Resistance V2 | AnonycryptousThe Dynamic Support and Resistance V2 indicator, an easy tool to identify key support, resistance, trendline levels, pivot points and volume data.
Pivot Points.
Calculates support, resistance and trendline levels using pivot points, which are derived from the high, low, and close prices of previous trading periods.
Customize the pivot calculation by using Close' or 'High/Low' and adjusting the lookback periods for both the left and right sides of the pivot calculation.
Pivot points are crucial for forecasting potential market turning points, so it allows traders to adapt the indicator to different market conditions and timeframes.
By using pivot points, traders can spot reversal and consolidation levels or trendlines early on, allowing them to react to them in time.
Volume Levels.
This option focuses on identifying support and resistance levels based on volume data, specifically the Point of Control.
The POC is the highest traded volume price level during a time period.
This POC calculation, allow traders to areas of significant trading levels as support or resistance zones.
Volume-based levels gives insights into market sentiment and showes strong support and resistance based on trading volume.
Traders can choose between pivot-based and volume-based levels or use both simultaneously, depending on their analysis.
The indicator offers custom colors, so the trader can customize their visual analysis to their own style.
It calculates the importance of each level based on the number of touches and the duration it holds.
This indicator is intended for educational and informational purposes only and should not be considered financial advice.
Trading involves significant risk, and you should consult with a financial advisor before making any trading decisions.
The performance of this indicator is not guaranteed, and past results do not predict future performance.
Use at your own risk.

VP-Period with Previous Day Levels & Historical POC# Volume Profile with Previous Day Levels & Historical POCs
## Description
Comprehensive indicator combining Volume Profile analysis, previous day levels, and historical POC (Point of Control) levels for advanced technical analysis.
## Key Features
### Volume Profile
- **Customizable period**: 3 to 500 days
- **Calculation resolution**: 400 to 700 points
- **Current VPOC**: Point of Control line for current period
- **Volume bars**: graphical display of volume profile distribution
### Historical POCs
- **POC history**: up to 20 previous days
- **Time labels**: shows how many days ago for each POC
- **Dashed lines**: easy identification of historical levels
### Previous Day Levels (last 5 days)
- **High/Low**: daily highs and lows
- **Midpoint**: 50% level (High+Low)/2
- **Open/Close**: opening and closing prices
- **Progressive thickness**: day 1 thicker, decreasing for previous days
## Customization
- Fully configurable colors for each element
- Toggle on/off switches for every component
- Different line styles (solid, dashed, dotted)
## Usage
Perfect for traders using volume analysis and support/resistance based on previous daily levels. Ideal for identifying key zones and significant breakout points.
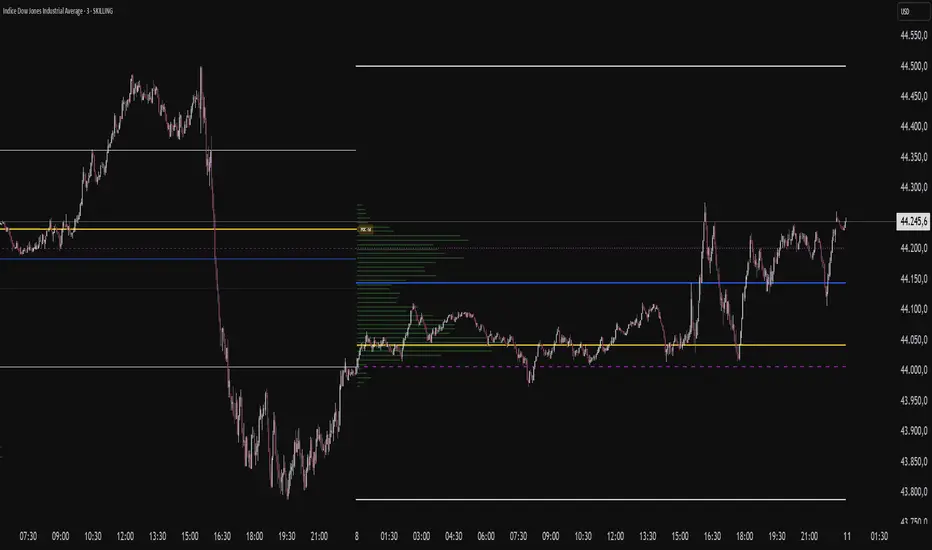
Multy Dynamic POCThis script displays up to 4 independent Point of Control (POC) levels based on volume profile logic.
📌 Each POC can be configured individually:
Period options: Daily (D), Weekly (W), Monthly (M), or BARS (rolling bar window).
Dynamic recalculation when the period changes (e.g., new day/week/month or custom bar count).
Price-anchored lines for each POC level that scale correctly with the chart.
Customizable line color and thickness.
🔍 How it works:
For each active POC line, the script builds a simple volume distribution based on the candle’s average price (hl2) and volume.
The price range is split into 100 buckets. The one with the highest accumulated volume is selected as the Point of Control (POC).
In BARS mode, POC is recalculated every N bars. In D/W/M modes, it resets exactly at the beginning of a new period (according to TradingView’s time() function).
✅ Useful for:
Traders applying volume profile analysis without needing the full built-in volume profile tool.
Spotting dynamic high-volume zones in trends or ranges.
Strategy development or confirmation around high-interest price levels.
_______________________________________________________________________________
Данный индикатор отображает до 4 независимых уровней Point of Control (POC), рассчитанных по объёмам.
📌 Каждый POC можно настраивать отдельно:
Периоды: День (D), Неделя (W), Месяц (M) или BARS (скользящее окно по количеству баров).
Автоматический пересчёт при смене периода (например, новый день, неделя или месяц).
Линии POC привязаны к цене и масштабируются вместе с графиком.
Настраиваемый цвет и толщина линий.
🔍 Как работает:
Для каждой активной линии POC создаётся объёмное распределение: берется средняя цена свечи (hl2) и объем.
Диапазон цен делится на 100 уровней. Тот, где накоплено больше всего объёма, и есть POC.
В режиме BARS уровень пересчитывается каждые N баров. В режимах D/W/M — строго в начале нового периода.
✅ Подходит для:
Трейдеров, использующих объёмный анализ, но не имеющих платной подписки на Volume Profile.
Поиска уровней интереса и подтверждения сигналов.
Разработки стратегий с опорой на объём.

IDKFAIDKFA - Advanced Order Blocks & Volume Profile with Market Structure Analysis
Why IDKFA?
Named after the legendary DOOM cheat code that gives players "all weapons and full ammo," IDKFA provides traders with a comprehensive arsenal of market analysis tools. Just as the cheat code arms players with everything needed for combat, this indicator equips traders with essential market structure tools: Order Blocks, Volume Profile, LVN/HVN areas, Fibonacci retracements, and intelligent buy/sell signals - all in one unified system.
Core Features
Order Blocks Detection
Automatically identifies institutional order blocks using pivot high/low analysis
Extends blocks dynamically until price interaction occurs
Bullish blocks (demand zones) and bearish blocks (supply zones)
Customizable opacity and extend functionality
Advanced Volume Profile
Real-time volume profile calculation for multiple session types
Point of Control (POC), Value Area High (VAH), and Value Area Low (VAL)
Mode 1: Side-by-side bull/bear volume display
Mode 2: Overlapped volume display with percentage analysis
Shows buying vs selling pressure at each price level
LVN/HVN Area Detection
Low Volume Nodes (LVN): Areas below VAL where price moves quickly
High Volume Nodes (HVN): Areas above VAH with strong resistance
NPOC (Naked Point of Control): Single print areas within Value Area
Volume-based gradient coloring shows relative activity levels
Smart Fibonacci Retracements
Auto-detects trend direction for proper fibonacci orientation
Dynamic color coding: Red levels in uptrends, Gold in downtrends
Special 88.6% level turns lime green in downtrends
Key levels: 23.6%, 38.2%, 50%, 61.8%, 65%, 78.6%, 88.6%
Intelligent Signal System
Works best on higher timeframes
Identifies high-probability reversal setups at key levels
Buy signals: Large bearish rejection followed by bullish reclaim
Sell signals: Large bullish rejection followed by bearish breakdown
Signals only trigger near significant support/resistance areas
Signal Analysis & Usage Guidelines
Buy Signal Mechanics
The buy signal triggers when:
Previous candle shows significant bearish movement (minimum ATR multiplier)
Current candle reclaims a configurable percentage of the previous candle's range
Price is near a key support level (order blocks, fibonacci, volume levels)
Sell Signal Mechanics
The sell signal triggers when:
Previous candle shows significant bullish movement (minimum ATR multiplier)
Current candle rejects below a configurable percentage of the previous candle's range
Price is near a key resistance level (order blocks, fibonacci, volume levels)
When to TAKE Signals
High Probability Buy Signals:
Signal appears AT or BELOW the VAL (Value Area Low)
Signal occurs at bullish order block confluence
Price is in LVN area below VAL (momentum acceleration zone)
Signal aligns with fibonacci 61.8% or 78.6% support
Multiple session POC levels provide support confluence
Previous session's VAL acting as current support
High Probability Sell Signals:
Signal appears AT or ABOVE the VAH (Value Area High)
Signal occurs at bearish order block confluence
Price is in HVN area above VAH (heavy resistance zone)
Signal aligns with fibonacci 61.8% or 78.6% resistance
Multiple session POC levels provide resistance confluence
Previous session's VAH acting as current resistance
When to AVOID Signals
Avoid Buy Signals When:
Signal appears ABOVE the VAH (buying into resistance)
Price is in HVN red zones (high volume resistance areas)
No clear support structure below current price
Volume profile shows heavy selling pressure (high bear percentages)
Signal occurs during low-volume periods between major sessions
Multiple bearish order blocks exist below current price
Avoid Sell Signals When:
Signal appears BELOW the VAL (selling into support)
Price is in LVN green zones (momentum could continue)
No clear resistance structure above current price
Volume profile shows heavy buying pressure (high bull percentages)
Signal occurs during Asian session ranges without clear direction
Multiple bullish order blocks exist above current price
Volume Profile Context for Signals
Understanding Bull/Bear Percentages:
70%+ Bull dominance at a level = Strong support expected
70%+ Bear dominance at a level = Strong resistance expected
50/50 Split = Neutral zone, less predictable
Use percentages to gauge conviction behind moves
POC (Point of Control) Interactions:
Signals above POC in uptrend = Higher probability
Signals below POC in downtrend = Higher probability
Signals against POC bias require extra confirmation
POC often acts as magnetic level for price return
Trading Strategies
Strategy 1: VAL/VAH Bounce Strategy
Wait for price to approach VAL (support) or VAH (resistance)
Look for signal confirmation at these critical levels
Enter with tight stops beyond the Value Area
Target opposite boundary or next session's levels
Strategy 2: Order Block + Volume Confluence
Identify order block alignment with VAL/VAH
Wait for signal within the confluence zone
Enter on signal with stop beyond order block
Use LVN areas as acceleration zones for targets
Strategy 3: LVN/HVN Strategy
LVN (Green) Areas: "Go Zones" - expect quick price movement through low volume
HVN (Red) Areas: "Stop Zones" - expect resistance and potential reversals
NPOC Areas: "Fill Zones" - price often returns to fill single print gaps
Strategy 4: Multi-Session Analysis
Use Daily/Weekly for major structure context
Use 4H for intermediate levels
Use 1H for precise entry timing
Ensure all timeframes align before taking signals
Strategy 5: Fibonacci + Volume Profile
Buy signals at 61.8% or 78.6% fibonacci near VAL
Sell signals at 61.8% or 78.6% fibonacci near VAH
Use 88.6% level as final support/resistance before major moves
50% level often aligns with POC for confluence
Signal Quality Assessment
Grade A Signals (Highest Probability):
Signal at VAL/VAH with order block confluence
Fibonacci level alignment (61.8%, 78.6%)
Volume profile shows 70%+ dominance in signal direction
Multiple timeframe structure alignment
Signal occurs during high-volume sessions (London/NY)
Grade B Signals (Moderate Probability):
Signal near POC with some confluence
Fibonacci 50% or 38.2% alignment
Mixed volume profile readings (50-70% dominance)
Some timeframe alignment present
Signal during overlap sessions
Grade C Signals (Lower Probability):
Signal with minimal confluence
Weak fibonacci alignment or none
Volume profile neutral or against signal
Conflicting timeframe signals
Signal during low-volume periods
Risk Management Guidelines
Position Sizing Based on Signal Quality:
Grade A: Standard position size
Grade B: Reduced position size (50-75%)
Grade C: Minimal position size (25%) or skip entirely
Stop Loss Placement:
Beyond order block boundaries
Outside Value Area (VAL/VAH)
Below/above fibonacci confluence levels
Account for session volatility ranges
Profit Targets:
First target: Opposite VAL/VAH boundary
Second target: Next session's key levels
Final target: Major order blocks or fibonacci extensions
Credits & Attribution
Original components derived from:
Market Sessions & Volume Profile by © Leviathan (Mozilla Public License 2.0)
Volume Profile elements inspired by @LonesomeTheBlue's volume profile script
Pivot Order Blocks by TradingWolf / © MensaTrader (Mozilla Public License 2.0)
Auto Fibonacci Retracement code (public domain)
Significant enhancements and modifications include:
Advanced LVN/HVN detection and visualization
Bull/Bear percentage analysis for Mode 2/3
Comprehensive alert system with market context
Integrated buy/sell signals at key levels
Performance optimizations and extended session support
Enhanced Mode 2/3 with percentage pressure analysis
Important Disclaimers
This indicator is a technical analysis tool designed for educational purposes. It does not provide financial advice, investment recommendations, or trading signals that guarantee profits. All trading involves substantial risk of loss, and past performance does not guarantee future results. Users should conduct their own research, understand the risks involved, and consider consulting with qualified financial advisors before making trading decisions. The signals and analysis provided are based on historical price patterns and volume data, which may not predict future market movements accurately.
Best Practices
Never trade signals blindly - always consider volume profile context
Wait for confluence between multiple tools before entering
Respect the Value Area - avoid buying above VAH or selling below VAL
Use session context - Asian ranges vs London/NY breakouts
Practice proper risk management - position size based on signal quality
Understand the bigger picture - use multiple timeframes for context
Remember: Like the IDKFA cheat code, having all the tools doesn't guarantee success. The key is learning to use them together effectively and understanding when NOT to take a signal is often more important than knowing when to take one.
