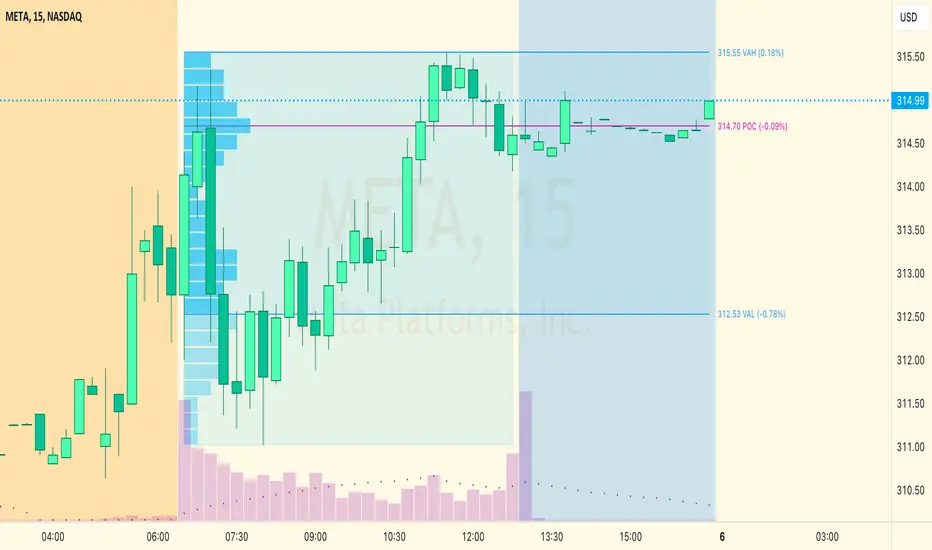
Support Resistance UltimateThe "Support Resistance ULTIMATE" indicator is a comprehensive tool for traders on the TradingView platform, designed to identify key support and resistance levels using two primary techniques: pivot points and volume data. This indicator provides flexibility and customization, allowing traders to adapt it to their specific trading strategies.
KEY FEATURES
Pivot-Based Levels:
This feature calculates support and resistance levels using pivot points, which are derived from the high, low, and close prices of previous trading periods. Pivot points are crucial for forecasting potential market turning points.
Users can customize the pivot calculation by selecting the source type (either 'Close' or 'High/Low') and adjusting the lookback periods for both the left and right sides of the pivot calculation. This flexibility allows traders to adapt the indicator to different market conditions and timeframes.
Volume-Based Levels:
This option focuses on identifying support and resistance levels based on volume data, specifically the Point of Control (POC). The POC represents the price level with the highest traded volume during a specific time period, reflecting a consensus value among market participants.
The indicator includes a rolling POC calculation, allowing traders to dynamically assess areas of significant trading interest that may serve as support or resistance zones.
ADVANTAGES
Customization and Flexibility:
Traders can choose between pivot-based and volume-based levels or use both simultaneously, depending on their analysis needs. This dual approach provides a comprehensive view of market dynamics, accommodating various trading styles.
The indicator offers customizable color settings for support and resistance lines, enhancing chart readability and allowing traders to personalize their visual analysis.
Enhanced Market Insights:
By utilizing pivot points, traders can identify potential reversal or consolidation points, aiding in the prediction of market trends and the establishment of strategic entry and exit points.
Volume-based levels provide insights into market sentiment and participation, highlighting areas of strong support or resistance based on trading volume. This can improve risk management and trade execution by identifying high-probability trading zones.
Importance Scoring:
The indicator calculates the importance of each level based on the number of touches and the duration it holds. This scoring system helps traders assess the strength of support and resistance levels, with thicker lines indicating more significant levels.
This indicator is intended for educational and informational purposes only and should not be considered financial advice. Trading involves significant risk, and you should consult with a financial advisor before making any trading decisions. The performance of this indicator is not guaranteed, and past results do not predict future performance. Use at your own risk.
在腳本中搜尋"point of control"

Overlay-ChartOverlay-Chart Indicator
The Overlay-Chart Indicator is an advanced script designed for scalpers and day traders, providing comprehensive insights into daily, weekly, monthly, and previous period price levels. This indicator helps traders visualize critical price levels and make informed decisions based on historical and current data.
Key Features:
Drawing Future Lines with Labels:
The script uses the drawFutureLine function to plot future price levels with customizable labels. This helps traders anticipate and react to key price points.
Daily Levels:
Displays the open, low, high, close, and equilibrium (EQ) prices for the current day. This provides a quick reference for daily trading ranges and significant price points.
Weekly Levels:
Shows the open, low, high, close, and equilibrium prices for the current week, offering a broader view of market trends and key weekly price levels.
Monthly Levels:
Illustrates the open, low, high, close, and equilibrium prices for the current month, enabling traders to understand long-term trends and significant monthly price points.
Previous Day, Week, and Month Levels:
Historical data from previous periods (day, week, month) is displayed, allowing traders to compare past and present price levels to identify patterns and potential support/resistance levels.
Customizable Colors:
Traders can choose colors for daily, weekly, monthly, and previous day levels to enhance chart readability and personalization.
Flexible Display Options:
Users can select which price levels (Open, Low, High, Close, EQ) to display for each period (daily, weekly, monthly, previous day, week, month).
How It Works:
The script fetches historical and current price data using the request.security function. It then uses these data points to draw lines on the chart representing significant price levels. These lines are drawn into the future to help traders visualize where these levels will be in upcoming bars. Labels are added to these lines for easy identification.
How to Use:
Configure Inputs:
Enable or disable the display of daily, weekly, monthly, and previous period levels using the input options.
Customize colors for different levels to match your charting preferences.
Analyze Key Levels:
Observe the plotted lines and labels to understand critical price points for the current and past periods.
Use this information to identify potential entry and exit points, support and resistance levels, and overall market trends.
Future Planned Features:
The script includes several features that are currently commented out but planned for future updates:
Volume Weighted Average Price (VWAP):
Display VWAP for daily, weekly, and monthly periods to provide an average price based on volume.
Point of Control (POC):
Show the price level with the highest trading volume for daily, weekly, and monthly periods.
Value Area High (VAH) and Low (VAL):
Display the upper and lower boundaries of the value area where most trading activity occurs for daily, weekly, and monthly periods.
These enhancements will offer additional insights into volume distribution and market sentiment, further improving the utility of the Overlay-Chart Indicator for traders.
This script is specifically designed to cater to the needs of scalpers and day traders who require precise, visually intuitive data for their trading strategies. The planned features will further enhance its effectiveness, providing a comprehensive tool for market analysis.

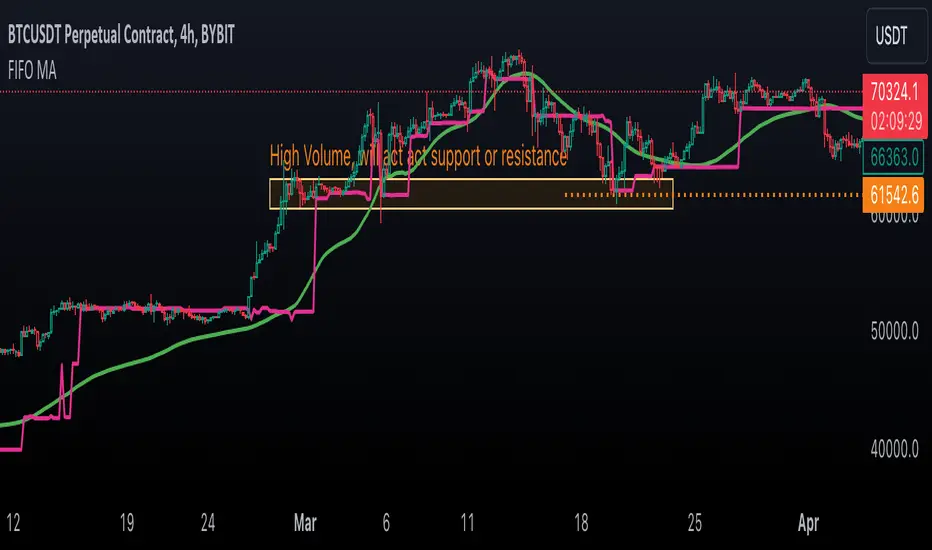
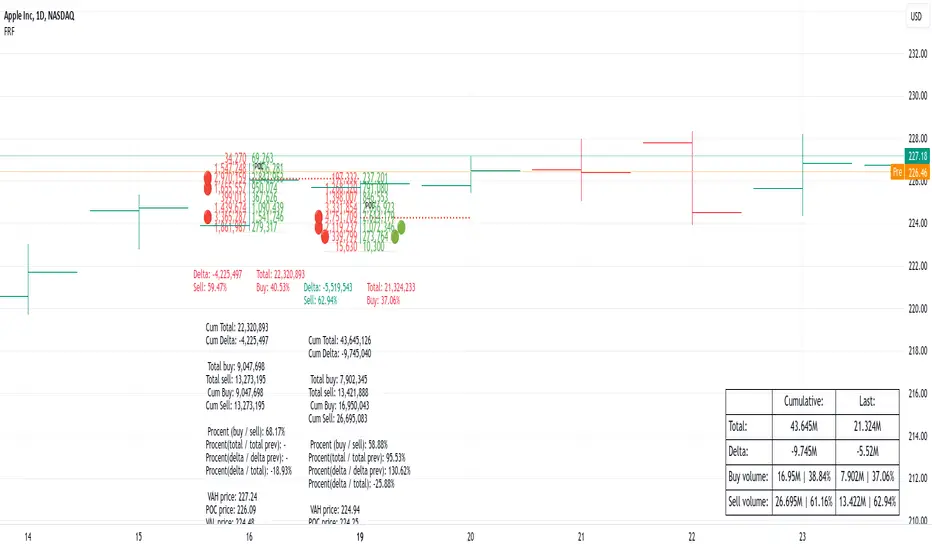
First In, First Out Moving AverageThis script is a tool designed to calculate a First In, First Out (FIFO) Moving Average (MA) using traded prices and volumes. Additionally, it computes the Point of Control (PoC) from, which identifies the price levels (developing POC) with the maximum volume. The script is built to provide traders with a comprehensive analysis of price movements and volume dynamics, enhancing their understanding of market trends and potential entry/exit points.
Understanding the Mechanics:
The script maintains arrays for prices and volumes, where hypothetical trades are added.
For long trades (identified by red candles/bars), traded prices and volumes are appended to the respective arrays.
Short trades (identified by green candles/bars) trigger the removal of volumes from the arrays following the FIFO principle.
This process ensures the adjustment of partial or complete removal of oldest entries based on traded volume.
Analyzing Profit and Loss (PnL):
The script also tracks a hypothetical Profit and Loss (PnL) to understand whether the outcome is in red (negative) or green (positive) - color of the FIFO MA.
Interpreting the Results:
Once the script is applied to the chart, traders can observe the FIFO Moving Average (MA) and Point of Control (PoC) lines plotted.
By analyzing these lines and the associated colors (indicating positive or negative PnL), traders can make informed decisions regarding market trends, support/resistance levels and potential trading opportunities.
Money Flow Profile [LuxAlgo]The Money Flow Profile is a charting tool that measures the traded volume or the money flow at all price levels on the market over a specified time period and highlights the relationship between the price of a given asset and the willingness of traders to either buy or sell it, allowing traders to reveal dominant and/or significant price levels and to analyze the trading activity of a particular user-selected range.
This tool combines a volume/money flow profile, a sentiment profile, and price levels, where the right side of the profile highlights the distribution of the traded activity/money flow at different price levels, the left side of the profile highlights the market sentiment at those price levels, and in the middle the price levels.
🔶 USAGE
A volume/money flow profile is an advanced charting tool that displays the traded volume/money flow at different price levels over a specific period. It helps traders visualize where the majority of trading activity/money flow has occurred.
A sentiment profile is a difference between buy and sell volume/money flow aiming to highlight the sentiment/dominance at specific price levels.
Each row of the profile presents figures on volume and money flow specific to price levels.
High volume/money flow nodes indicate areas of high activity and are likely to act as support or resistance in the future. They attract price and try to hold it there. Conversely, low-volume nodes are areas with low trading activity, that are less subject to get revisited by the price. The market often bounces right over these levels, not staying for long. The "Profile Heatmap" option of the script helps to better emphasize the trading activity within each areas.
By measuring the traded activity at each price level the script presents an ability to highlight the consolidation zones, in other words, highlights accumulation and distribution zones. When the price moves toward one end of the consolidation and volume pick up, it can foreshadow a potential breakout.
Level of Significance, Point of Control, Highest Sentiment Zone, and Profile Price levels are some of the other profile-related options available with the script.
🔶 SETTINGS
The script takes into account user-defined parameters and plots the profiles, where detailed usage for each user-defined input parameter in indicator settings is provided with the related input's tooltip.
🔹 Profile Generic Settings
Lookback Length / Fixed Range: Sets the lookback length.
Profile Source: Sets the profile source, Volume, or Money Flow.
🔹 Profile Presentation Settings
Volume/Money Flow Profile: Toggles the visibility of the Volume/Money Flow Profile.
High Traded Nodes: Threshold and Color option for high traded nodes.
Average Traded Nodes: Color option for average traded nodes.
Low Traded Nodes: Threshold and Color option for low traded nodes.
🔹 Sentiment Profile Settings
Sentiment Profile: Toggles the visibility of the Sentiment Profile.
Sentiment Polarity Method: Sets the method used to calculate the up/down volume/money flow.
Bullish Nodes: Color option for Bullish Nodes.
Bearish Nodes: Color option for Bearish Nodes.
🔹 Profile Heatmap Settings
Profile Heatmap: Toggles the visibility of the profile heatmap.
Heatmap Source: Sets the source of the profile heatmap, Volume/Money Flow Profile, or Sentiment Profile.
Heatmap Transparency: Control the transparency of the profile heatmap.
🔹 Other Presentation Settings
Level of Significance: Toggles the visibility of the level of significance line/zone.
Consolidation Zones: Toggles the visibility of the consolidation zones.
Consolidation Threshold, Color: Sets the threshold value and zone color.
Highest Sentiment Zone: Toggles the visibility of the highest bullish or bearish sentiment zone.
Profile Price Levels, Color, Size: Toggles the visibility of the profile price levels, and sets the color and the size of the level labels.
Profile Range Background Fill: Toggles the visibility of the profiles range.
🔹 Other Settings
Number of Rows: Specify how many rows each profile histogram will have.
Profile Width %: Alters the width of the rows in the histogram, relative to the profile length
Profile Text Size: Alters the size of the text. Setting to Auto will keep the text within the box limits.
Profile Horizontal Offset: Enables to move profile in the horizontal axis.
🔶 RELATED SCRIPTS
Liquidity-Sentiment-Profile
Swing-Volume-Profiles
For more and other conceptual scripts you are kindly invited to visit LuxAlgo-Scripts .

Volume Footprint Voids [BigBeluga]Volume Footprint Voids is a unique tool that uses lower timeframe calculation to plot different styles of single candle POC.
This indicator is very powerful for scalping and finding very precise entry and exits, spotting potential trapped traders, and more.
Unlike many other volume profiles, this aims to plot single candle profiles as well as their own footprints.
🔶 FEATURES
The script includes the following settings:
Windows: Plotting style and calculations
Coloring modes
Display modes
lower-timeframe calculations
🔶 CALCULATION
In the image above we can see how the script calculates each level position that will serve as a calculation process to see how much volume/closes there are within the levels.
In the image above, we can have a more clear example of how we count each candle close.
We use the prior screenshot as an example, after setting each level we will use the lower-timeframe input to measure the amount of closes within the ranges.
Depending on the lot size, the box will be larger or smaller, usually the POC will always have the highest box size.
NOTE: Size is the starting point, always from the low of the candle.
To find more voids, select a closer LTF to the current one you're using.
To find fewer voids, select a timeframe away from your current one.
Due to Pine Script limitations, we are only able to plot a certain amount of footprints, and we can't plot the whole history chart.
POC will be the largest block displayed, indicating the time point of control
Gray areas are closes above the average
Black are Void or imbalance that price will fill in the future, like FVG
The image above shows an incorrect size input that will lead to bad calculations, while on the other side, a correct size input that will lead to a clear vision and better calculation.
🔶 WINDOWS
The "▲▼" Mode will display delta buyers and delta sellers coloring with voids as black.
It also offers a gradient mode for a beautier visualization
The "Total Volume" mode will display the net volume within the lot size (closes within the levels).
This is useful to spot possible highest net volume within the same highest lot size.
The "POC + Gaps" will show both POC and Gaps as the highest block while all the rest will be considered as the smaller block.
This is useful to see where the highest lot were and if there are higher or lower imbalances within the candle
The last option "Gaps" will simply display the gaps as the highest block, while the POC as the lowest block.
This is useful to have a better view of the gaps areas
🔶 EXAMPLE
This is one of the most basic examples of how this script can be used. POC at the bottom creating a strong support area as price holds and creates higher voids gap that price fills while rising.
🔶 SETTINGS
Users have full control over the script, from colors to choosing the lower-timeframe inputs to disabling the lot size.

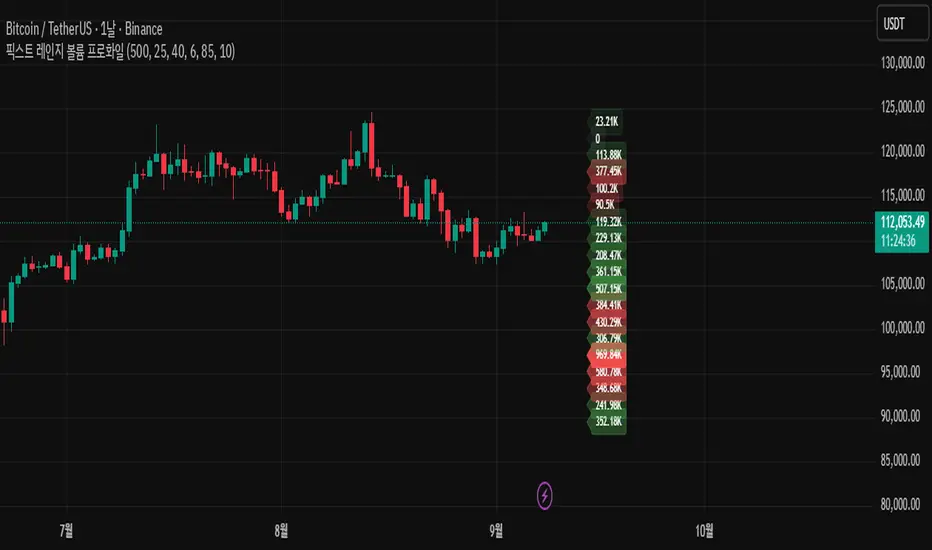
Price Range Volume Profile [Pt]█ Introduction
The Price Range Volume Profile (PRVP) is a revolutionary indicator. This tool stands out from its peers due to its unique ability to capture the entire price chart history, thus providing a comprehensive volume profile of the entire asset's trading history, as available on TradingView chart. It's worth noting that I believe this tool is the first of its kind to accomplish such a feat. A much recommended tool if you are a volume profile trader.
█ Main Features
► Historical Lookback: This feature dives deep into the past, grasping all the historical data of an asset. It's equipped to handle up to 20,000 bars, although users without a premium TradingView account are advised to keep it at a maximum of 10,000 bars, or just use the "Full Historical Lookback" feature.
► Volume Profile / POC: Displays the distribution of volume across price levels for the selected price range. The Point of Control (POC), which is the price level with the highest traded volume, is also highlighted.
► Customization: Users have the flexibility to adjust the profile's appearance, including profile width, horizontal offset, and the option to fill the background of the profile range.
► Time Weighting: This feature allows users to give more weight to recent trading activity, which can be especially useful for intraday traders or during times of high volatility. Note that this feature will impact the volume profile and POC level.
► Settings Table: A settings table is displayed on the chart for users to quickly reference their input parameters.
█ Input Parameters
► Lookback Timeframe: Determines the period for which the volume profile is generated.
► Price Range: The percentage distance to consider for the profile, adjusted above and below the current closing price.
► Profile Step size: The granularity of the volume profile. Users can opt for automatic step size based on a predefined calculation or set their preferred tick step size.
► Historical Bars Lookback: Determines the number of bars to include in the volume profile calculation.
► Profile Visuals: Adjust the appearance and layout of the volume profile on the chart.
► Extra: Additional settings including the display of a settings table and its location.
█ Basic Understanding of Volume Profile - How to use PRVP?
Volume Profile is a valuable tool for traders who want insights into where the majority of trading activity has occurred. Here are some tips to make the most of it:
► Understand the Basics: Before using the Volume Profile, ensure you understand the difference between it and the standard volume histogram. While both represent volume, the former displays it against price while the latter shows it against time.
► Identify High Volume Nodes (HVN) and Low Volume Nodes (LVN):
◊ HVN: Areas where there's a lot of trading activity and where the price has spent a lot of time. These areas can act as strong support or resistance.
◊ LVN: Areas where there's a lack of trading activity. Prices might move quickly through these areas, and they can act as potential breakpoints or accelerators for price movement.
► Locate the Point of Control (POC): This is the price level with the highest traded volume for a specified period. It often acts as a magnet for price, and it can serve as a pivot or reference point.
► Trend Confirmation: A shift in the volume profile from one price level to another can confirm a trend. For instance, if higher volume starts to build at higher price levels, it may indicate a strong uptrend.
► Watch for Volume Gaps: If there's a significant gap in the volume profile, prices may move quickly through these levels as there's little historical trading activity to act as support or resistance.
█ Other Usage Tips
◊ For optimal performance, ensure that the chosen timeframe aligns closely with the chart timeframe. Differences in timeframes may lead to minor discrepancies in the volume profile.
◊ To address any errors arising from too many levels displayed on the volume profile, consider increasing the Profile Step size or reducing the Price Range.

[potatoshop] Volume Profile lower timeframeThis script is a volume profile that displays the volume of transactions in price blocks over a recent period of time.
For a more detailed representation, OHCLV values on the time frame lower than the time zone on the chart were called and expressed.
Low time frames are adjustable.
You can adjust the number of blocks and the most recent time period that you want to view.
Although it cannot be compared to the volume indicators provided for paid users of Trading-View, it has functioned by displaying transactions that are difficult to find on open source.
Displays the amount traded in each block and the percentage of the total over a given period.
POC represents the middle value of the block with the highest transaction volume as a line.
TPOC represents the block that stayed the longest regardless of the volume of transaction.
The reversal line appears when you determine the trading advantage of the rising and falling closing on a block basis and then have a different value from the neighboring blocks.
(I didn't mean it much, but I just put it in for fun.)
It represents the total volume of transactions traded in each block, and there are also check boxes in the settings window that represent the volume of transactions that closed higher and closed lower.
You can specify the color of each block.
The highest and lowest values for the set period and the total sum of each block are displayed at the bottom of the box.
Because it was made using a lot of arrays, the total transaction volume was marked separately to check the value.
When expressing the price block according to the trading volume percentage, it was a pity that the minimum pixel was 1 bar, so it could not be expressed delicately.
Although set to bar_time in Box properties xloc, 1 bar was actually the minimum unit of the X-axis value.
The logic used to place the transaction volume for each block is as follows.
1. Divide the difference between the high and low values of 1 LTF bar by the transaction volume .
2. Find the percentage of this LTF bar within each block.
3. Multiply the ratio by the transaction volume again.
4. Store the value in each block cell.
Below are the codes of the people I referred to this time.
1. ‘Time & volume point of control (TPOC & VPOC)’ by quantifytools
2. ‘Volume Profile ’ by LuxAlgo
3. ‘Volume Profile and Volume Indicator by DGT’ by dgtrd
The script is for informational and educational purposes only.
이 스크립트는 최근 일정 기간동안의 거래량을 가격 블록단위로 표시해 주는 볼륨 프로화일입니다.
좀 더 자세한 표현을 위해 차트상의 시간대보다 낮은 시간 프레임상의 OHCLV 값들을 호출하여 표현하였습니다.
낮은 시간 프레임은 조절 가능합니다..
보고 싶은 최근 일정 기간과 블럭 갯수를 조절할 수 있습니다.
트뷰 유료 사용자들을 위해 제공하는 지표와는 비교할 수는 없지만, 오픈 소스상에서는 찾기 힘든 거래량을 표시해 기능을 넣었습니다.
각 블럭에서 거래되었던 양 과 주어진 기간 동안의 총량 대비 퍼센트를 표시해 줍니다.
POC는 거래량이 가장 많았던 블럭의 중간값을 라인으로 표현해 줍니다.
TPOC는 거래량에 상관없이 가장 오랜 시간 머물렸던 블럭을 표현해 줍니다.
반전선은 블럭 단위로 상승 마감과 하락 마감의 거래량 우세를 결정한 뒤, 이웃 블럭들하고 다른 값을 가질 때 나타납니다.
(어떤 뜻을 갖고 만든 건 아니고 그냥 재미로 넣어 보았습니다.)
각 블럭에서 거래되었던 총거래량을 표현해 주며, 또한 설정창에서 상승 마감한 거래량과 하락 마감한 거래량을 표현하는 체크 박스가 있습니다.
각 블럭의 색깔을 지정하실 수 있습니다.
설정된 기간 동안의 최고값과 최저값, 각 블럭을 합친 총량을 박스 하단에 표시해 두었습니다.
어레이를 많이 사용하여 만들었기 때문에 값의 확인을 위해 전체 거래량을 따로 표시하였습니다.
가격 블럭을 거래량 퍼센트에 따라 표현할 때, 최소 픽셀이 1bar 이어서 섬세하게 표현 할 수 없어 안타까웠습니다.
박스 속성을 xloc.bar_time 로 설정하였지만 실제로는 1 bar가 X축 값의 최소 단위였습니다.
각 블록 별로 거래량을 배치 할 때 쓰인 로직은 다음과 같습니다.
1. 1 LTF bar의 하이 와 로우 값의 차이를 거래량으로 나누어 줍니다.
2. 각 블록 안에서 이 LTF bar가 차지 하는 비율을 구합니다.
3. 그 비율에 다시 거래량을 곱해 줍니다.
4. 그 값을 각 블록 셀에 저장해 줍니다.
밑에 제가 이번에 참고한 분들의 코드들입니다.
1. ‘Time & volume point of control (TPOC & VPOC)’ by quantifytools
2. ‘Volume Profile ’ by LuxAlgo
3. ‘Volume Profile and Volume Indicator by DGT’ by dgtrd

Volume Profile [LuxAlgo]Displays the estimate of a volume profile, with the option to show a rolling POC (point of control). Users can change the lookback, row size, and various visual aspects of the volume profile.
Settings
Basic:
Lookback: Number of most recent bars to use for the calculation of the volume profile
Row Size: Determines the number of rows used for the calculation of the volume profile
Show Rolling POC: Determines whether to display the rolling POC of the volume profile
Style:
Width (% of the box): Determines the length of the bars relative to the Lookback value
Bar Width: Width of each bar
Flip Histogram: Flips the histogram, when enabled, the histogram base will be located at the most recent candle
Gradient: Allows to color the volume profile bars with a gradient, with a color intensity determined by the length of each bar
Rows Solid Color: Color of each bar when 'Gradient' is disabled
POC Solid Color: Color of the POC when 'Gradient' is disabled
Usage
It is very common to display volume over time in order to visualize the trading activity made over a specific candle, however this is not the only way to display volume and it can be interesting to put it in relation with the price, which is what volume profiles do.
Volume profiles are displayed as price relative histograms showing the accumulated volume within certain price areas, the number of areas are determined by the row size of the volume profile. Knowing which price's area accumulated the most volume allow highlighting areas of interest to market participants.
Most accumulated volume will be encountered in zones of equilibrium between buyers and sellers; that is zones of local price stationarity. These zones are highlighted by high volume nodes in the volume profile. Imbalance between buyers and sellers are highlighted by thinner zones of the volume profile.
The price level with the most accumulated volume is highlighted by the "point of control" (POC), displayed by the dotted line in the indicator.
The POC is often considered an important level, commonly used as support/resistance by traders. One can verify the accuracy of this use case by using the rolling POC (assuming one would use the POC over time as SR).
Indicator Limitations
Volume profiles are calculated using tick data, which is not the case of this estimate, as such you won't have an accurate representation of an actual volume profile.
The rolling POC can introduce time outs in the script computation, use lower lookback and row size value to display it.

Volume Profile [Makit0]VOLUME PROFILE INDICATOR v0.5 beta
Volume Profile is suitable for day and swing trading on stock and futures markets, is a volume based indicator that gives you 6 key values for each session: POC, VAH, VAL, profile HIGH, LOW and MID levels. This project was born on the idea of plotting the RTH sessions Value Areas for /ES in an automated way, but you can select between 3 different sessions: RTH, GLOBEX and FULL sessions.
Some basic concepts:
- Volume Profile calculates the total volume for the session at each price level and give us market generated information about what price and range of prices are the most traded (where the value is)
- Value Area (VA): range of prices where 70% of the session volume is traded
- Value Area High (VAH): highest price within VA
- Value Area Low (VAL): lowest price within VA
- Point of Control (POC): the most traded price of the session (with the most volume)
- Session HIGH, LOW and MID levels are also important
There are a huge amount of things to know of Market Profile and Auction Theory like types of days, types of openings, relationships between value areas and openings... for those interested Jim Dalton's work is the way to come
I'm in my 2nd trading year and my goal for this year is learning to daytrade the futures markets thru the lens of Market Profile
For info on Volume Profile: TV Volume Profile wiki page at www.tradingview.com
For info on Market Profile and Market Auction Theory: Jim Dalton's book Mind over markets (this is a MUST)
BE AWARE: this indicator is based on the current chart's time interval and it only plots on 1, 2, 3, 5, 10, 15 and 30 minutes charts.
This is the correlation table TV uses in the Volume Profile Session Volume indicator (from the wiki above)
Chart Indicator
1 - 5 1
6 - 15 5
16 - 30 10
31 - 60 15
61 - 120 30
121 - 1D 60
This indicator doesn't follow that correlation, it doesn't get the volume data from a lower timeframe, it gets the data from the current chart resolution.
FEATURES
- 6 key values for each session: POC (solid yellow), VAH (solid red), VAL (solid green), profile HIGH (dashed silver), LOW (dashed silver) and MID (dotted silver) levels
- 3 sessions to choose for: RTH, GLOBEX and FULL
- select the numbers of sessions to plot by adding 12 hours periods back in time
- show/hide POC
- show/hide VAH & VAL
- show/hide session HIGH, LOW & MID levels
- highlight the periods of time out of the session (silver)
- extend the plotted lines all the way to the right, be careful this can turn the chart unreadable if there are a lot of sessions and lines plotted
SETTINGS
- Session: select between RTH (8:30 to 15:15 CT), GLOBEX (17:00 to 8:30 CT) and FULL (17:00 to 15:15 CT) sessions. RTH by default
- Last 12 hour periods to show: select the deph of the study by adding periods, for example, 60 periods are 30 natural days and around 22 trading days. 1 period by default
- Show POC (Point of Control): show/hide POC line. true by default
- Show VA (Value Area High & Low): show/hide VAH & VAL lines. true by default
- Show Range (Session High, Low & Mid): show/hide session HIGH, LOW & MID lines. true by default
- Highlight out of session: show/hide a silver shadow over the non session periods. true by default
- Extension: Extend all the plotted lines to the right. false by default
HOW TO SETUP
BE AWARE THIS INDICATOR PLOTS ONLY IN THE FOLLOWING CHART RESOLUTIONS: 1, 2, 3, 5, 10, 15 AND 30 MINUTES CHARTS. YOU MUST SELECT ONE OF THIS RESOLUTIONS TO THE INDICATOR BE ABLE TO PLOT
- By default this indicator plots all the levels for the last RTH session within the last 12 hours, if there is no plot try to adjust the 12 hours periods until the seesion and the periods match
- For Globex/Full sessions just select what you want from the dropdown menu and adjust the periods to plot the values
- Show or hide the levels you want with the 3 groups: POC line, VA lines and Session Range lines
- The highlight and extension options are for a better visibility of the levels as POC or VAH/VAL
THANKS TO
@watsonexchange for all the help, ideas and insights on this and the last two indicators (Market Delta & Market Internals) I'm working on my way to a 'clean chart' but for me it's not an easy path
@PineCoders for all the amazing stuff they do and all the help and tools they provide, in special the Script-Stopwatch at that was key in lowering this indicator's execution time
All the TV and Pine community, open source and shared knowledge are indeed the best way to help each other
IF YOU REALLY LIKE THIS WORK, please send me a comment or a private message and TELL ME WHAT you trade, HOW you trade it and your FAVOURITE SETUP for pulling out money from the market in a consistent basis, I'm learning to trade (this is my 2nd year) and I need all the help I can get
GOOD LUCK AND HAPPY TRADING

DeltaFlow Volume Profile [BigBeluga]🔵 OVERVIEW
The DeltaFlow Volume Profile builds a compact volume profile next to price and enriches every bin with flow context : bullish vs. bearish participation (%), a per-bin Delta % , an optional Delta Heat Map , and a PoC band with the bin’s absolute volume. This lets you see not just where volume clustered, but who (buyers or sellers) dominated inside each price slice.
🔵 CONCEPTS
Binned Volume Profile : Price range over a user-defined LookBack is split into Bins ; each bin aggregates traded volume.
Bull/Bear Split : Within every bin, volume is separated by candle direction into Bull Volume and Bear Volume , then normalized to % of the bin’s displayed size.
Delta % : The difference between Bull % and Bear % for the bin. Positive = buyer dominance; negative = seller dominance.
Delta Heat Map : Bin background shading that scales with both total volume strength and delta bias.
PoC (Point of Control) : The most significant bin gets a PoC band and a label with its absolute volume.
🔵 FEATURES
Profile with Flow : A clean horizontal volume bar per bin plus stacked Bull % and Bear % .
Per-Bin Delta Label : A readable “Δ xx%” tag at the start of each bin shows dominance at a glance.
Delta Heat Map : Optional gradient that intensifies with higher volume and stronger delta.
PoC Highlight : Optional PoC band colored separately, labeled with absolute volume (e.g., “1.23M”).
Configurable Inputs : LookBack, number of Bins (10–100), toggles for Delta, Heat Map, Volume Bars, and PoC color.
Readable Colors : Separate inputs for bullish (volume +) and bearish (volume –) hues.
🔵 HOW TO USE
Set the window : Choose LookBack and Bins to balance detail vs. performance (more bins = finer resolution).
Enable “Volume Bars” to display the bull/bear split as two stacked percent bars inside each bin.
High Bull % near support → constructive demand.
High Bear % near resistance → active supply.
Use Δ labels (toggle “Delta”) to quickly spot bins with clear buyer/seller control; combine with price position for confluence.
Turn on Delta Heat Map to prioritize areas with both large volume and strong imbalance.
Watch the PoC : The PoC band marks the most traded (and often magnet) level; its label shows absolute size for context.
Trade ideas :
Breakout continuation when Δ stays positive across consecutive upper bins.
Reversion risk when price enters a large bearish-Δ cluster below.
Manage risk around the PoC; reactions there can be sharp.
🔵 CONCLUSION
DeltaFlow Volume Profile upgrades a classic profile with flow intelligence. The bull/bear split, explicit Δ %, heat-weighted backdrop, and PoC volume label make dominant participation and key price shelves obvious. Use it to filter levels, time entries with imbalance, and validate breakouts or fades with objective volume-flow evidence.

Fixed Range Volume Profile"Distribution of transaction volume by price group (transaction volume by price block)"
Instructions for use (Professional Manual)
1. a basic concept
By vertical axis (price), shows the cumulative trading volume traded in the segment.
The longer the block, the more transactions took place in that price range.
Colors distinguish between buying/selling strength (green = buying advantage, red = selling advantage).
2. Key components
POC (Point of Control)
→ Longest block (most traded price segment, "key selling point").
VAH / VAL (Value Area High/Low)
→ Top/bottom segments where approximately 70% of the total volume is formed.
→ Role of "Major Support/Resistance".
High Capacity Node (HVN)
→ Significantly higher trading volumes → strong support/resistance.
Low Volume Node (LVN)
→ Low volume section → areas where prices are easily passed.
3. practical application
Find Support/Resistance
The thickest block (POC) is used as a place where prices often rebound/resist.
a trading entry/liquidation strategy
Buy if the price is supported near HVN,
When breaking through the LVN, fast movement (gap movement) can be expected.
break/goal setting
Finger = Under the LVN,
Target = Next HVN.
Judgment of trends
When the block distribution is concentrated above, "Increase to Collection Section"
If you're driven below, you're "in a downtrend to a variance section."
4. Precautions
The volume distribution is "past data based" and is not an indicator of the future.
Rather than using it alone, it is more effective to combine with Fibonacci, trend lines, and candle patterns.
In particular, in the volatile market, the LVN breakthrough → may signal a surge/fall.
In summary, this block indicator is "a map showing the most market participants at any price point".
In other words, it is useful for finding support/resistance as a tool for analyzing sales and establishing the basis for trading strategies.
Value Matrix – Previous Day VAValue Matrix – Previous Day Volume Profile Indicator
Description:
The Value Matrix – Previous Day VA indicator plots the previous trading session’s Volume Profile key levels directly on your chart, providing clear reference points for intraday trading. This indicator calculates the Value Area High (VAH), Value Area Low (VAL), and Point of Control (POC) from the prior session and projects them across the current trading day, helping traders identify potential support, resistance, and high-volume zones.
Features:
Calculates previous day VAH, VAL, and POC based on a user-defined session (default 09:30–16:00).
Uses Volume Profile bins for precise distribution calculation.
Fully customizable line colors for VAH, VAL, and POC.
Lines extend across the current session for easy intraday reference.
Works on any timeframe, optimized for 1-minute charts for precision.
Optional toggles to show/hide VAH, VAL, and POC individually.
Inputs:
Session Time: Define the trading session for which the volume profile is calculated.
Profile Bins: Number of price intervals used to divide the session range.
Value Area %: Percentage of volume to include in the value area (default 70%).
Show POC / VAH & VAL: Toggle visibility of each level.
Line Colors: Customize VAH, VAL, and POC colors.
Use Cases:
Identify previous session support and resistance levels for intraday trading.
Gauge areas of high liquidity and potential market reaction zones.
Combine with other indicators or price action strategies for improved entries and exits.
Recommended Timeframe:
Works on all timeframes; best used on 1-minute or 5-minute charts for precise intraday analysis.

Piman2077: Previous Day Volume Profile levelsPrevious Day Volume Profile Indicator
Description:
Previous Day Volume Profile Indicator plots the previous trading session’s Volume Profile key levels directly on your chart, providing clear reference points for intraday trading. This indicator calculates the Value Area High (VAH), Value Area Low (VAL), and Point of Control (POC) from the prior session and projects them across the current trading day, helping traders identify potential support, resistance, and high-volume zones.
Features:
Calculates previous day VAH, VAL, and POC based on a user-defined session (default 09:30–16:00).
Uses Volume Profile bins for precise distribution calculation.
Fully customizable line colors for VAH, VAL, and POC.
Lines extend across the current session for easy intraday reference.
Works on any timeframe, optimized for 1-minute charts for precision.
Optional toggles to show/hide VAH, VAL, and POC individually.
Inputs:
Session Time: Define the trading session for which the volume profile is calculated.
Profile Bins: Number of price intervals used to divide the session range.
Value Area %: Percentage of volume to include in the value area (default 68%).
Show POC / VAH & VAL: Toggle visibility of each level.
Line Colors: Customize VAH, VAL, and POC colors.
Use Cases:
Identify previous session support and resistance levels for intraday trading.
Gauge areas of high liquidity and potential market reaction zones.
Combine with other indicators or price action strategies for improved entries and exits.
Recommended Timeframe:
Works on all timeframes; best used on 1-minute or 5-minute charts for precise intraday analysis.

Zero Lag Liquidity [AlgoAlpha]🟠 OVERVIEW
This script plots liquidity zones with zero lag using lower-timeframe wick profiles and high-volume wicks to mark key price reactions. It’s called Zero Lag Liquidity because it captures significant liquidity imbalances in real time by processing lower-TF price-volume distributions directly inside the wick of abnormal candles. The tool builds a volume histogram inside long upper/lower wicks, then calculates a local Point of Control (POC) to mark the price where most volume occurred. These levels act as visual liquidity zones, which can trigger labels, break signals, and trend detection depending on price interaction.
🟠 CONCEPTS
The core concept relies on identifying high-volume candles with unusually long wicks—often a sign of opposing liquidity. When a large upper or lower wick appears with a strong volume spike, the script builds a histogram of lower-timeframe closes and volumes inside that wick. It bins the wick into segments, sums volume per bin, and finds the POC. This POC becomes the liquidity level. The script then dynamically tracks whether price breaks above or rejects off these levels, adjusts the active trend regime accordingly, and highlights bars to help users spot continuation or reversal behavior. The logic avoids repainting or subjective interpretation by using fixed thresholds and lower-TF price action.
🟠 FEATURES
Dynamic liquidity levels rendered at POC of significant wicks, colored by bullish/bearish direction.
Break detection that removes levels once price decisively crosses them twice in the same direction.
Rejection detection that plots ▲/▼ markers when price bounces off levels intrabar.
Volume labels for each level, shown either as raw volume or percentage of total level volume.
Candle coloring based on trend direction (break-dominant).
🟠 USAGE
Use this indicator to track where liquidity has most likely entered the market via abnormal wick events. When a long wick forms with high volume, the script looks inside it (using your chosen lower timeframe) and marks the most traded price within it. These levels can serve as expected reversal or breakout zones. Rejections are marked with small arrows, while breaks trigger trend shifts and remove the level. You can toggle trend coloring to see directional bias after a breakout. Use the wick multiplier to control how selective the detector is (higher = stricter). Alerts and label modes help customize the signal for different asset types and chart styles.

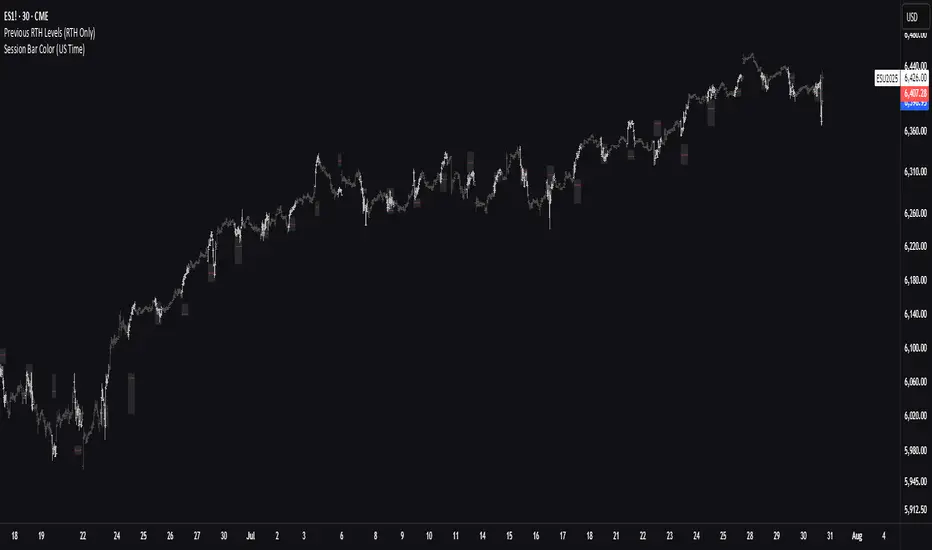
Previous RTH Levels (RTH Only)Previous RTH Levels on current session (RTH Only)
This indicator calculates key volume profile levels from the previous Regular Trading Hours (RTH) session and projects them onto the current RTH session. It is designed to provide traders with significant historical price levels—Point of Control (POC), Value Area High (VAH), and Value Area Low (VAL)—to use as potential support, resistance, and pivot points for intraday trading.
Instead of just plotting lines, this script highlights the entire Value Area (VA) between the VAH and VAL, offering a clear visual reference for the prior day's zone of price agreement.
Impulse Profile Zones [BigBeluga]🔵 OVERVIEW
Impulse Profile Zones is a volume-based tool designed to highlight high-impact candles and visualize hidden liquidity zones inside them using microstructure data. It’s ideal for identifying volume concentration and potential reaction points during impulsive market moves.
Whenever a candle exceeds a specified size threshold, this indicator captures its structure and overlays a detailed intrabar volume profile (from a 10x lower timeframe), allowing traders to analyze the distribution of interest within powerful market impulses.
🔵 CONCEPTS
Filters candles that exceed a user-defined threshold by size.
For qualifying candles, retrieves lower timeframe price and volume data.
Divides the candle’s body into 10 volume bins and calculates the volume per zone. Highlights the bin with the highest volume as the Point of Control (POC) .
Each POC line extends forward until a new impulse is detected.
🔵 FEATURES
Impulse Candle Detection:
Triggers only when a candle’s body size is larger than the defined threshold.
Lower Timeframe Profiling:
Aggregates 10-bin volume data from a lower timeframe (typically 1/10 of current TF).
Volume Distribution Bars:
Each bin displays a stylized bar using unicode block characters (e.g., ▇▇▇, ▇▇ or ▇--).
The bar size reflects the relative volume intensity.
POC Zone Mapping:
The bin with the highest volume is marked with a bold horizontal line.
Its value is labeled and extended until the next valid impulse.
🔵 HOW TO USE
Use large candle profiles to assess which price levels inside a move were most actively traded.
Watch the POC line as a magnet for future price interaction (support/resistance or reaction).
Combine with market structure or order block indicators to identify confluence levels.
Adjust the “Filter Large Candles” input to detect more or fewer events based on volatility.
🔵 CONCLUSION
Impulse Profile Zones is a hybrid microstructure tool that bridges lower timeframe volume with higher timeframe impulse candles. By revealing where most of the volume occurred inside large moves, traders gain a deeper view into hidden liquidity, enabling smarter trade entries and more confident profit-taking zones.

Volume Profile + Price Action Strategy (POC-based)This indicator combines volume dynamics, price action patterns, and a simplified Point of Control (POC) to highlight potential high-probability trade zones.
🔍 Key Features
POC-Based Logic
Plots the POC from the most recent closed 10-minute candle as a horizontal level for intraday structure.
Volume Spike Detection
Highlights unusual activity based on volume compared to the average of the last N candles.
Effort vs. Result Analysis
Based on Wyckoff-inspired logic:
Absorption: Large volume, small body → possible buyer/seller absorption
False Move: Small volume, large body → potential fakeout
Price Action Recognition Detects:
Inside Bars
Pin Bars
Engulfing Candles
Signal Highlights
🔺 Absorption Signals (below bar, teal triangle)
🔻 False Move Signals (above bar, orange triangle)
🔷 POC Line
⚙️ Customizable Inputs
You can control signal sensitivity with these inputs:
Volume Spike Multiplier
Raise to filter only extreme volume spikes
→ Recommended: 2.0 to 3.0 for cleaner setups
Absorption Body Ratio
Lower to detect only very small bodies (tight candles)
→ Try 0.3 to 0.4 for stricter absorption logic
False Move Body Ratio
Raise to catch only large candles on low volume
→ Use 2.0+ to filter weak moves
🧠 How to Use
Use in confluence with:
Support/Resistance
VWAP or moving averages
Session opens/closes
Best on 10-minute charts, but adjustable
✅ Signal Tuning Tips
Want fewer but cleaner signals?
Increase Volume Spike Multiplier: 2.5+
Decrease Absorption Body Ratio: 0.3
Increase False Move Ratio: 2.0+
Want more frequent signals?
Lower Volume Multiplier: 1.2–1.5
Raise Absorption Ratio: 0.6+
Lower False Move Ratio: 1.2–1.4
📊 Recommended Timeframe
Optimized for 10-minute charts
Works intraday, especially around session opens and POC re-tests
⚠️ Disclaimer
This script is for educational and informational purposes only. It does not constitute financial advice or a recommendation to buy or sell any asset. Past performance is not indicative of future results. Always do your own research and consult a licensed financial advisor before making trading decisions.
Use at your own risk.

RSI Support & Resistance Breakouts with OrderblocksThis tool is an overly simplified method of finding market squeeze and breakout completely based on a dynamic RSI calculation. It is designed to draw out areas of price levels where the market is pushing back against price action leaving behind instances of short term support and resistance levels you otherwise wouldn't see with the common RSI.
It uses the changes in market momentum to determine support and resistance levels in real time while offering price zone where order blocks exist in the short term.
In ranging markets we need to know a couple things.
1. External Zone - It's important to know where the highs and lows were left behind as they hold liquidity. Here you will have later price swings and more false breakouts.
2. Internal Zone - It's important to know where the highest and lowest closing values were so we can see the limitations of that squeeze. Here you will find the stronger cluster of orders often seen as orderblocks.
In this tool I've added a 200 period Smoothed Moving Average as a trend filter which causes the RSI calculation to change dynamically.
Regular Zones - without extending
The Zones draw out automatically but are often too small to work with.
To solve this problem, you can extend the zones into the future up to 40 bars.
This allows for more visibility against future price action.
--------------------------------------------
Two Types of Zones
External Zones - These zones give you positioning of the highest and lowest price traded within the ranging market. This is where liquidity will be swept and often is an ultimate breaking point for new price swings.
How to use them :
External Zones - External zones form at the top of a pullback. After this price should move back into its impulsive wave.
During the next corrective way, if price breaches the top of the previous External Zone, this is a sign of trend weakness. Expect a divergence and trend reversal.
Internal Zones - (OrderBlocks) Current price will move in relation to previous internal zones. The internal zone is where a majority of price action and trading took place. It's a stronger SQUEEZE area. Current price action will often have a hard time closing beyond the previous Internal Zones high or low. You can expect these zones to show you where the market will flip over. In these same internal zones you'll find large rejection candles.
**Important Note** Size Doesn't Matter
The size of the internal zone does not matter. It can be very small and still very powerful.
Once an internal zone has been hit a few times, its often not relevant any longer.
Order Block Zone Examples
In this image you can see the Internal Zone that was untouched had a STRONG price reaction later on.
Internal Zones that were touched multiple times had weak reactions later as price respected them less over time.
Zone Overlay Breakdown
The Zones form and update in real time until momentum has picked up and price begins to trend. However it leaves behind the elements of the inducement area and all the key levels you need to know about for future price action.
Resistance Fakeout : Later on after the zone has formed, price will return to this upper zone of price levels and cause fakeouts. A close above this zone implies the market moves long again.
Midline Equilibrium : This is simply the center of the strongest traded area. We can call this the Point of Control within the orderblock. If price expands through both extremes of this zone multiple times in the future, it eliminates the orderblock.
Support Fakeout : Just like its opposing brother, price will wick through this zone and rip back causing inducement to trap traders. You would need a clear close below this zone to be in a bearish trend.
BARCOLOR or Candle Color: (Optional)
Bars are colored under three conditions
Bullish Color = A confirmed bullish breakout of the range.
Bearish Color = A confirmed bearish breakout of the range.
Squeeze Color = Even if no box is formed a candle or candles can have a squeeze color. This means the ranging market happened within the high and low of that singular candle.

Liquidity Sweep Filter Strategy [AlgoAlpha X PineIndicators]This strategy is based on the Liquidity Sweep Filter developed by AlgoAlpha. Full credit for the concept and original indicator goes to AlgoAlpha.
The Liquidity Sweep Filter Strategy is a non-repainting trading system designed to identify liquidity sweeps, trend shifts, and high-impact price levels. It incorporates volume-based liquidation analysis, trend confirmation, and dynamic support/resistance detection to optimize trade entries and exits.
This strategy helps traders:
Detect liquidity sweeps where major market participants trigger stop losses and liquidations.
Identify trend shifts using a volatility-based moving average system.
Analyze volume distribution with a built-in volume profile visualization.
Filter noise by differentiating between major and minor liquidity sweeps.
How the Liquidity Sweep Filter Strategy Works
1. Trend Detection Using Volatility-Based Filtering
The strategy applies a volatility-adjusted moving average system to determine trend direction:
A central trend line is calculated using an EMA smoothed over a user-defined length.
Upper and lower deviation bands are created based on the average price deviation over multiple periods.
If price closes above the upper band, the strategy signals an uptrend.
If price closes below the lower band, the strategy signals a downtrend.
This approach ensures that trend shifts are confirmed only when price significantly moves beyond normal market fluctuations.
2. Liquidity Sweep Detection
Liquidity sweeps occur when price temporarily breaks key levels, triggering stop-loss liquidations or margin call events. The strategy tracks swing highs and lows, marking potential liquidity grabs:
Bearish Liquidity Sweeps – Price breaks a recent high, then reverses downward.
Bullish Liquidity Sweeps – Price breaks a recent low, then reverses upward.
Volume Integration – The strategy analyzes trading volume at each sweep to differentiate between major and minor sweeps.
Key levels where liquidity sweeps occur are plotted as color-coded horizontal lines:
Red lines indicate bearish liquidity sweeps.
Green lines indicate bullish liquidity sweeps.
Labels are displayed at each sweep, showing the volume of liquidated positions at that level.
3. Volume Profile Analysis
The strategy includes an optional volume profile visualization, displaying how trading volume is distributed across different price levels.
Features of the volume profile:
Point of Control (POC) – The price level with the highest traded volume is marked as a key area of interest.
Bounding Box – The profile is enclosed within a transparent box, helping traders visualize the price range of high trading activity.
Customizable Resolution & Scale – Traders can adjust the granularity of the profile to match their preferred time frame.
The volume profile helps identify zones of strong support and resistance, making it easier to anticipate price reactions at key levels.
Trade Entry & Exit Conditions
The strategy allows traders to configure trade direction:
Long Only – Only takes long trades.
Short Only – Only takes short trades.
Long & Short – Trades in both directions.
Entry Conditions
Long Entry:
A bullish trend shift is confirmed.
A bullish liquidity sweep occurs (price sweeps below a key level and reverses).
The trade direction setting allows long trades.
Short Entry:
A bearish trend shift is confirmed.
A bearish liquidity sweep occurs (price sweeps above a key level and reverses).
The trade direction setting allows short trades.
Exit Conditions
Closing a Long Position:
A bearish trend shift occurs.
The position is liquidated at a predefined liquidity sweep level.
Closing a Short Position:
A bullish trend shift occurs.
The position is liquidated at a predefined liquidity sweep level.
Customization Options
The strategy offers multiple adjustable settings:
Trade Mode: Choose between Long Only, Short Only, or Long & Short.
Trend Calculation Length & Multiplier: Adjust how trend signals are calculated.
Liquidity Sweep Sensitivity: Customize how aggressively the strategy identifies sweeps.
Volume Profile Display: Enable or disable the volume profile visualization.
Bounding Box & Scaling: Control the size and position of the volume profile.
Color Customization: Adjust colors for bullish and bearish signals.
Considerations & Limitations
Liquidity sweeps do not always result in reversals. Some price sweeps may continue in the same direction.
Works best in volatile markets. In low-volatility environments, liquidity sweeps may be less reliable.
Trend confirmation adds a slight delay. The strategy ensures valid signals, but this may result in slightly later entries.
Large volume imbalances may distort the volume profile. Adjusting the scale settings can help improve visualization.
Conclusion
The Liquidity Sweep Filter Strategy is a volume-integrated trading system that combines liquidity sweeps, trend analysis, and volume profile data to optimize trade execution.
By identifying key price levels where liquidations occur, this strategy provides valuable insight into market behavior, helping traders make better-informed trading decisions.
Key use cases for this strategy:
Liquidity-Based Trading – Capturing moves triggered by stop hunts and liquidations.
Volume Analysis – Using volume profile data to confirm high-activity price zones.
Trend Following – Entering trades based on confirmed trend shifts.
Support & Resistance Trading – Using liquidity sweep levels as dynamic price zones.
This strategy is fully customizable, allowing traders to adapt it to different market conditions, timeframes, and risk preferences.
Full credit for the original concept and indicator goes to AlgoAlpha.

Fibonacci Volume Profiles [AlgoAlpha]Unlock a deeper understanding of price action with the Fibonacci Volume Profiles indicator by AlgoAlpha! This powerful tool blends Fibonacci retracement levels with customizable volume profiles, helping traders identify high-probability areas of support, resistance, and accumulation. Designed for both continuous dynamic levels and custom time periods, this indicator is a must-have for traders seeking confluence in market structure analysis.
🔑 Key Features
📈 Dual Mode Selection : Choose between Continuous Fibonacci levels, which adapt dynamically to pivots, or a Custom Period mode, where you set your own start and end points.
📊 Integrated Volume Profile : Visualize volume distributions at key Fibonacci retracement levels, revealing areas of strong buying/selling interest.
🎨 Customizable Colors & Transparency : Adjust Fibonacci level colors, fill zones, and profile transparency for a visually clear experience.
🔍 Profile Resolution & Scaling : Control the number of price levels and width of the volume profile for detailed market insights.
🛠 Extendable Levels : Optionally extend Fibonacci levels to the right of the chart for better visualization of future price interaction.
📌 How to Use
Add the Indicator: Click on the star icon to add it to your favorites and apply it to your TradingView chart.
Analyze The Market: Observe how price interacts with Fibonacci levels alongside the volume profile to confirm support/resistance zones. Switch between custom range or continuous mode to align the tool with your trading style.
⚙️ How It Works
The indicator calculates pivot highs/lows dynamically (or uses user-defined time periods) to plot Fibonacci retracement levels. It then builds a volume profile by analyzing historical volume data, grouping it into price bins to highlight volume-heavy zones. The Point of Control (PoC) is identified as the level with the highest traded volume, acting as a key price magnet. The color-coded Fibonacci levels help traders spot retracement zones, while the volume profile confirms strength or weakness in those areas.

Market DirectionThe "Market Direction" indicator combines four advanced sub-indicators to provide a comprehensive and multi-dimensional analysis of market trends, momentum, and potential reversals. This innovative approach leverages different aspects of price action, volume, and market sentiment, offering traders an in-depth view of market conditions.
1. Fractal Indicator: Multi-Scale Price Action Analysis
The Fractal Indicator identifies significant highs and lows over six different pivot lengths, offering a nuanced view of price action across multiple timeframes. By comparing distances from current closing prices to these key fractal points, the indicator determines potential trend reversals and market direction. This approach enables traders to adapt their strategies to various market conditions, capturing both short-term fluctuations and long-term trends.
2. Volume MACD Indicator: Enhanced Market Momentum
The Volume MACD Indicator goes beyond traditional MACD analysis by incorporating volume-weighted movement and the structural attributes of candlesticks (such as body length and wicks). This hybrid model offers a more comprehensive understanding of market momentum by integrating both price action and trading volume. The use of Smoothed Moving Averages (SMMA) reduces noise and ensures more stable signals, helping traders focus on sustainable trends and longer-term investment opportunities.
3. Cumulative Volume Momentum Indicator: Volume Dynamics Insight
The Cumulative Volume Momentum Indicator evaluates the momentum of cumulative buying and selling volumes, offering a clear picture of market strength and potential reversals. By comparing the relationship between open, close, high, and low prices, and applying a MACD approach to these volume dynamics, this indicator helps traders identify momentum shifts that often precede price movements. The visualization through histograms adds clarity to bullish and bearish volume momentum, enhancing decision-making in volatile markets.
4. POC-Price Momentum Indicator: Market Depth and Sentiment
The POC-Price Momentum Indicator assesses the difference between the Point of Control (POC) and closing prices, providing insights into underlying market sentiment. Positive differences indicate a buildup of upward momentum, while negative differences suggest a bearish tilt. By calculating moving averages of these differences, the indicator highlights the strength and sustainability of ongoing trends, helping traders align their strategies with the broader market direction.
Unified Rating for Confirming Market Direction
The "Market Direction" indicator consolidates the outputs of these four sub-indicators into a single, aggregated sentiment score. This score helps traders confirm the prevailing market trend by weighing the combined insights from fractal analysis, volume momentum, price action, and POC dynamics. A positive score suggests a bullish market, while a negative score indicates bearish conditions.

Fixed Range FootprintFixed Range Footprint allows you to analyze the Footprint over a specified time period. By enabling the "Extend Right" option, the Footprint transforms into a classic mode, extending from the starting point to the most recent bar in real-time.
Input Options:
Group: Coordinates
"Start range": Defines the starting coordinate for the Footprint period.
"End range": Defines the ending coordinate for the Footprint period.
Group: Row Size
"Ticks Per Row": Directly sets the price step, calculated by multiplying the input value by syminfo.mintick.
"Auto": Activates automatic mode for selecting the "Ticks Per Row" value.
"Max row": Relevant in auto mode; it limits the number of rows within a bar. The automatic calculation for "Ticks Per Row" is based on the first available bar and applied to subsequent bars.
Group: Imbalance
"Imbalance Percent": Sets a percentage-based coefficient to determine price level Imbalance by comparing the diagonal buy price to the previous sell price.
"Stacked levels": Defines the minimum number of consecutive Imbalance levels required to draw extended lines.
Group: Support
"Show Footprint Info": Toggles the display of Footprint information.
Group: Value Area
"Value Area": Sets the percentage for the Value Area.
"POC": Toggles the Point of Control (POC).
"VAH": Toggles the Value Area High (VAH).
"VAL": Toggles the Value Area Low (VAL).
"Show Volume Profile": Displays buy/sell volume at each level.
Group: Alerts
"Alert on New Imbalance": Enables alerts for the creation of new Imbalance levels.
"Alert on New Imbalance Line": Enables alerts for the creation of new Imbalance lines.
"Alert on Stop Past Imbalance Line": Enables alerts when price stops past an Imbalance line.
SessionVolumeProfileLibrary "SessionVolumeProfile"
Analyzes price & volume during regular trading hours to provide a session volume profile analysis. The primary goal of this library is to provide the developer with three values: the value area high, low and the point of control. The library also provides methods for rendering the value areas and histograms. To learn more about this library and how you can use it, click on the website link in my profile where you will find a blog post with detailed information.
debug(vp, position)
Helper function to write some information about the supplied SVP object to the screen in a table.
Parameters:
vp (Object) : The SVP object to debug
position (string) : The position.* to place the table. Defaults to position.bottom_center
getLowerTimeframe()
Depending on the timeframe of the chart, determines a lower timeframe to grab volume data from for the analysis
Returns: The timeframe string to fetch volume for
get(volumeProfile, lowerTimeframeHigh, lowerTimeframeLow, lowerTimeframeVolume)
Populated the provided SessionVolumeProfile object with vp data on the session.
Parameters:
volumeProfile (Object) : The SessionVolumeProfile object to populate
lowerTimeframeHigh (float ) : The lower timeframe high values
lowerTimeframeLow (float ) : The lower timeframe low values
lowerTimeframeVolume (float ) : The lower timeframe volume values
drawPriorValueAreas(todaySessionVolumeProfile, extendYesterdayOverToday, showLabels, labelSize, pocColor, pocStyle, pocWidth, vahlColor, vahlStyle, vahlWidth, vaColor)
Given a SessionVolumeProfile Object, will render the historical value areas for that object.
Parameters:
todaySessionVolumeProfile (Object) : The SessionVolumeProfile Object to draw
extendYesterdayOverToday (bool) : Defaults to true
showLabels (bool) : Defaults to true
labelSize (string) : Defaults to size.small
pocColor (color) : Defaults to #e500a4
pocStyle (string) : Defaults to line.style_solid
pocWidth (int) : Defaults to 1
vahlColor (color) : The color of the value area high/low lines. Defaults to #1592e6
vahlStyle (string) : The style of the value area high/low lines. Defaults to line.style_solid
vahlWidth (int) : The width of the value area high/low lines. Defaults to 1
vaColor (color) : The color of the value area background. Defaults to #00bbf911)
drawHistogram(volumeProfile, bgColor, showVolumeOnHistogram)
Given a SessionVolumeProfile object, will render the histogram for that object.
Parameters:
volumeProfile (Object) : The SessionVolumeProfile object to draw
bgColor (color) : The baseline color to use for the histogram. Defaults to #00bbf9
showVolumeOnHistogram (bool) : Show the volume amount on the histogram bars. Defaults to false.
Object
Fields:
numberOfRows (series__integer)
valueAreaCoverage (series__integer)
trackDevelopingVa (series__bool)
valueAreaHigh (series__float)
pointOfControl (series__float)
valueAreaLow (series__float)
startTime (series__integer)
endTime (series__integer)
dayHigh (series__float)
dayLow (series__float)
step (series__float)
pointOfControlLevel (series__integer)
valueAreaHighLevel (series__integer)
valueAreaLowLevel (series__integer)
volumeRows (array__float)
priceLevelRows (array__float)
ltfSessionHighs (array__float)
ltfSessionLows (array__float)
ltfSessionVols (array__float)