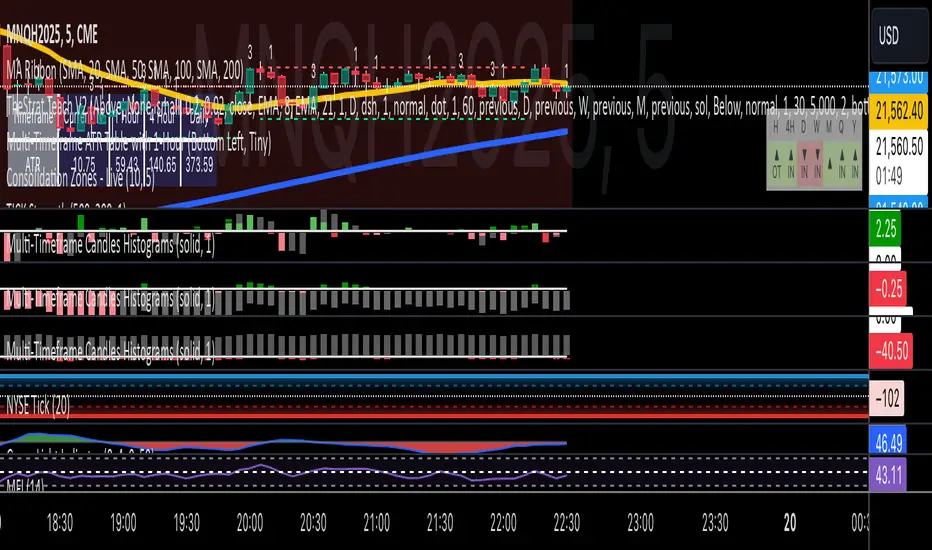
Multi-Timeframe Candles HistogramsAt some community members' requests, I have built on the original code to make it a single indicator with the option for users to check off which timeframes they want to be shown. Choices are 1-hour, daily, weekly, and monthly.
I couldn't figure out how to separate each timeframe into its own histogram, so this is the best I can offer at the moment. If any community member wants to take a crack at it, be my guest.
Colors are customizable.
If you have a paid TW account, you can lay it down twice and put the hour and daily on one and the weekly and monthly on the other.
That said, I hope you enjoy this version of this indicator.
R.I.P. Rob Smith, creator of TheStrat.
---
Key Features and Benefits
1. Custom Timeframe Selection:
- Choose from an array of timeframes ranging from minutes to months, giving you complete flexibility in your market analysis.
- Quickly switch between different timeframes (e.g., 1-hour, daily, or weekly) to track continuity across varying levels.
2. Visual Representation of High/Low Markers:
- Enable or disable the display of high and low points to better understand price ranges and reversals.
- These markers allow you to spot key turning points on different timeframes, facilitating better entry or exit decisions.
3. Enhanced Candle Visualization:
- Displays candles with precise price levels aligned to your chosen timeframe, giving a clearer view of price trends.
- Candles are color-coded to reflect price movement, which is customizable by the user.
---
How to Use This Indicator
Monitor Multiple Timeframes Simultaneously:
- Place the indicator on your chart and choose the timeframes you want to follow (e.g., hourly, daily, weekly, monthly).
- For each instance, checkmark the desired timeframes in the menu to ensure that you’re tracking the right period.
Achieve Timeframe Continuity:
- By aligning lower timeframes with higher ones, this tool helps you confirm trends, detect reversals, and avoid trades that go against the broader market movement.
---
Why This Indicator is Valuable for Traders
This tool simplifies a core principle of TheStrat—full timeframe continuity—by visually representing price action across multiple timeframes in a clear and actionable way. It removes the guesswork and helps traders stay in sync with market momentum, regardless of the timeframe they are analyzing.
This solution offers flexibility, clarity, and speed, enabling traders to quickly grasp critical movements and improve decision-making. Whether you are a scalper focusing on intraday moves or a swing trader watching weekly trends, this tool empowers you to maintain alignment with the overall market structure.
In essence, it brings the power of TheStrat to your fingertips by offering precise and easy-to-read visual aids, allowing you to seamlessly apply Rob Smith’s philosophy to your trading.
在腳本中搜尋"price action"
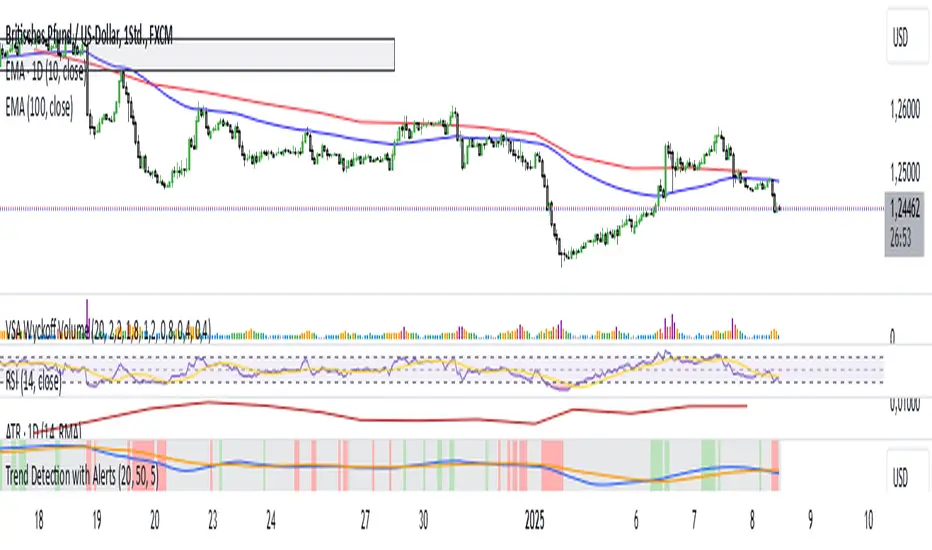
Trend Detection with AlertsPurpose of the Script
The script identifies trends on a chart (uptrend, downtrend, or sideways trend) and provides both visual cues and alerts when a trend changes. It uses two methods for trend detection:
Moving Averages (MA): It compares a short-term moving average (fast) with a long-term moving average (slow).
An uptrend occurs when the short-term MA is above the long-term MA.
A downtrend occurs when the short-term MA is below the long-term MA.
Price Action:
Higher highs (HH) indicate bullish momentum.
Lower lows (LL) indicate bearish momentum.
When these methods align, the script determines the trend and notifies the user of any trend changes.
Key Features
Moving Average Calculation:
A short-term moving average and a long-term moving average are calculated to determine the overall trend direction.
Trend Determination:
An uptrend is detected when the short-term MA is above the long-term MA and higher highs are present.
A downtrend is detected when the short-term MA is below the long-term MA and lower lows are present.
Otherwise, the trend is classified as sideways.
Alerts for Trend Changes:
Alerts are triggered when the trend changes from one state to another (e.g., sideways to uptrend).
Custom messages indicate the type of trend detected.
Background Colors:
The script changes the chart’s background color based on the current trend:
Green for uptrends.
Red for downtrends.
Gray for sideways trends.
Visualization of Moving Averages:
The moving averages are plotted on the chart for visual reference.
How It Works
Inputs for Flexibility:
The user can configure the lengths of the short-term and long-term moving averages.
A lookback period is used to determine higher highs or lower lows for additional confirmation.
Trend Logic:
The script checks the relationship between the moving averages to identify general trends.
It also evaluates price action to confirm trend strength (e.g., whether a higher high or lower low occurred).
Alert System:
When the detected trend changes (e.g., from sideways to uptrend), an alert is triggered. This ensures the user is notified of important market movements.
Dynamic Background Coloring:
The background color of the chart changes to reflect the current trend, making it easy to interpret the trend visually.
Use Cases
Trend Identification: Helps traders quickly identify market trends for decision-making.
Alerts for Trend Changes: Notifies traders when a new trend begins, ensuring they don’t miss key opportunities.
Visual Assistance: Makes it easier to interpret trends through color-coded backgrounds and moving average overlays.
Customization Options
Adjust Moving Average Lengths: Users can modify the short-term and long-term moving averages to suit their trading strategies.
Change Lookback Period: The sensitivity of higher highs and lower lows can be adjusted.
Personalized Alerts: Alerts can be customized for different trading scenarios.
Summary
This script provides an intuitive way to detect and visualize market trends while offering real-time alerts for trend changes. It’s an excellent tool for traders who want to stay informed about market conditions and make data-driven decisions.
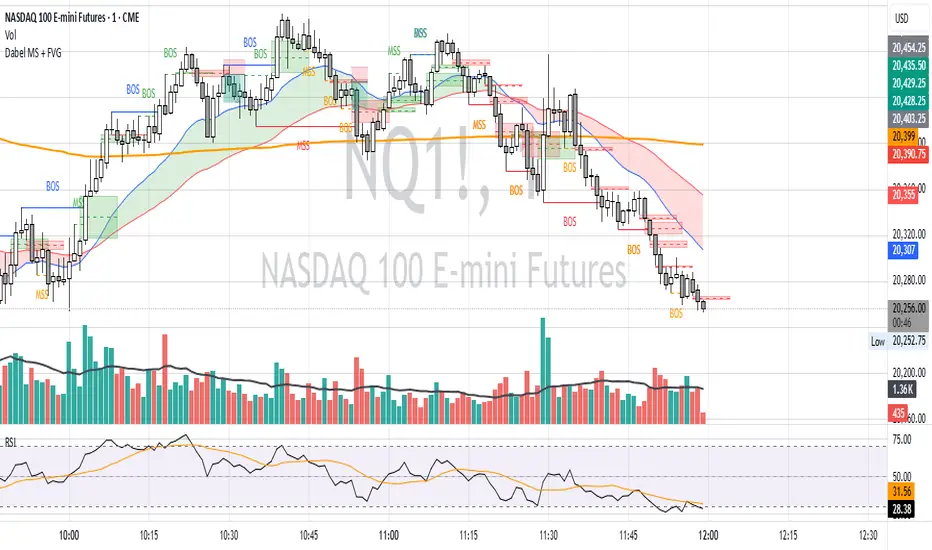
Dabel MS + FVGThis script is designed to assist traders by identifying market structures, imbalances, and potential trade opportunities using Break of Structure (BOS) and Market Structure Shifts (MSS). It visually highlights imbalances in price action, key pivots, and market structure changes, providing actionable information for making trading decisions.
Key features:
Imbalances Detection: Highlights bullish and bearish price gaps (Fair Value Gaps) using colored boxes. Users can choose the line style (solid, dashed, or dotted) for imbalance midlines.
Market Structure Analysis: Tracks pivot highs and lows to identify BOS and MSS in two separate market structures with adjustable pivot strengths.
Customizable Visualization: Allows users to choose line styles, colors, and display options for both imbalances and market structures.
Alerts: Alerts traders when BOS or MSS occur, helping to monitor the market effectively.
Trading Strategy
Imbalance Trading:
Imbalances (gaps) represent areas where supply or demand was left unfilled. These gaps often act as magnet zones where the price revisits to fill.
Bullish Imbalance: Look for buying opportunities when price enters a green imbalance zone.
Bearish Imbalance: Look for selling opportunities when price enters a red imbalance zone.
Use the midline of the imbalance box as a key reference point for potential reversals.
Break of Structure (BOS) and Market Structure Shift (MSS):
BOS: Indicates a continuation of the existing trend. For example:
Bullish BOS: Look for continuation in the uptrend after a high is broken.
Bearish BOS: Look for continuation in the downtrend after a low is broken.
MSS: Suggests a potential reversal in market structure. For example:
Bullish MSS: Indicates a possible shift from a bearish to bullish market.
Bearish MSS: Indicates a potential shift from a bullish to bearish market.
Multiple Market Structures:
This script provide two sets of market structures, allowing traders to compare short-term and long-term trends.
Adjust the pivot strength to suit your trading style (lower for intraday trading, higher for swing or positional trading).
Entry and Exit:
Entry: Look for entries near imbalances or after confirmed BOS/MSS in line with the overall trend.
Exit: Place stop-loss below/above recent pivots and take profit at nearby support/resistance or imbalance zones.
For New Traders
Focus on Basics: Understand what BOS and MSS mean and how they signal trend direction or reversals.
Use Alerts: Rely on the script's alert system to catch important moments without staring at charts all day.
Start Small: Test this strategy on a demo account before using it live. You can understand it more with practice.
Dynamic Display for Max/Min MA Types with Fake-Out FilterDynamic Moving Average Max/Min Indicator with Step Line Break
**** select the setting to STEP LINE BREAK****
This indicator provides a powerful way to identify dynamic entry and stop-loss levels for both long and short trades. It calculates the maximum and minimum values of a selected moving average (MA) over a specified lookback period, adapting dynamically to market conditions. It features options for various MA types, including SMA, EMA, HMA, RMA, and DEMA, to suit different trading strategies and styles.
How It Works
1. Moving Average Selection: Choose the type of moving average (SMA, EMA, HMA, RMA, or DEMA) and its period (e.g., HMA 13).
2. Max/Min Calculation: The indicator calculates the highest and lowest values of the selected moving average over a specified lookback period (e.g., 5 candles).
3. Dynamic Plotting:
• Bullish Market: When the price breaks the Max MA level, the Min level is plotted, trailing upward as a potential stop-loss for long trades.
• Bearish Market: When the price breaks the Min MA level, the Max level is plotted, trailing downward as a potential stop-loss for short trades.
4. Fake-Out Filter: If a candle breaks the Max/Min level but closes within the range (indicating a fake-out), the plots do not switch. This can cause repainting during volatile conditions, so use caution in high-wick markets.
Features
• Customizable Inputs: Adjust MA type, period, lookback, and timeframe to suit your trading strategy.
• Multi-Timeframe Flexibility: Works on all timeframes, from micro-scalping on the 1-minute chart to swing trading on higher timeframes.
• Trend Confirmation: Provides clear indications of when to enter or exit based on dynamic levels.
• Risk Management: Highlights stop-loss levels that trail the trend, helping to lock in profits or limit losses.
Advantages
1. Clear Entry/Exit Points: Provides actionable signals for both long and short trades, with defined stop-loss locations.
2. Customizable for Any Style: Tailor the indicator to your product, timeframe, and trading approach (scalping or swing trading).
3. Trend-Focused Guidance: Helps avoid counter-trend trades by showing the dominant trend direction.
4. Adaptive to Market Conditions: The dynamic nature of the indicator allows it to respond to both trending and consolidating markets.
Limitations
1. Repainting During Fake-Outs: The indicator can repaint during volatile periods with long wicks, as it filters for fake-out candles. This may create noise in certain market conditions.
2. Optimization Required: The ideal settings for MA type, period, and lookback are dependent on the market profile and need to be fine-tuned by the trader.
3. Less Effective in Consolidation: In sideways or choppy markets, the indicator may produce less reliable signals unless adjusted for lower sensitivity.
Trading Tips
• Use this indicator to focus on trending markets, avoiding trades against the prevailing trend. For example, during an uptrend, only take long trades and avoid shorts.
• Consider having two configurations: one for trending markets and one for consolidating markets, switching between them as needed.
• Pair this indicator with volume analysis, price action, or other complementary tools to increase accuracy and reduce noise.
This indicator is designed to be both an entry and risk management tool, enabling traders to make informed decisions while keeping risks in check.

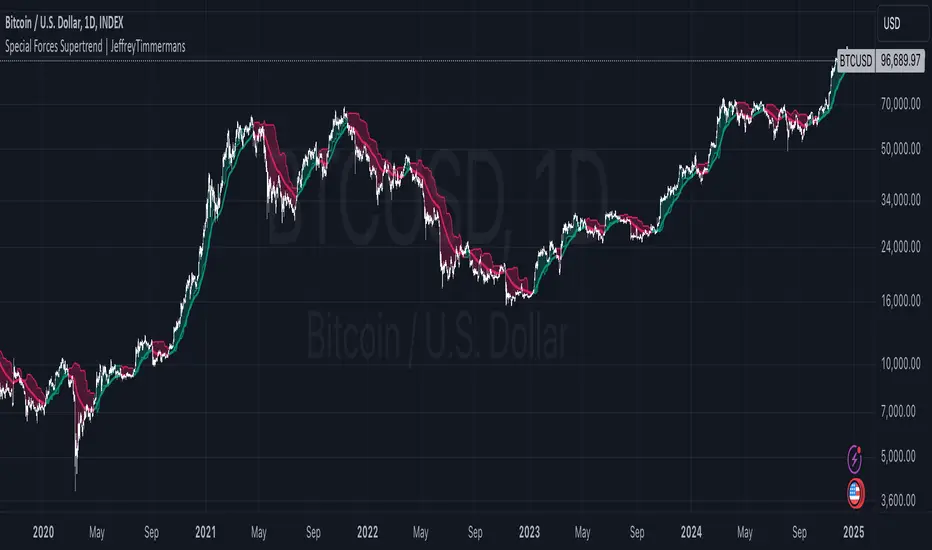
Special Forces Supertrend | JeffreyTimmermansSpecial Forces Supertrend Indicator
The "Special Forces Supertrend" is a cutting-edge trading indicator designed by Jeffrey Timmermans to provide traders with actionable insights into market trends. It combines advanced moving averages with dynamic range calculations to adapt to changing market conditions, ensuring clear and reliable trend identification.
Core Features
Trend Identification:
Integrates a customizable moving average (MA) with multiple types such as SMA, EMA, SMMA, WMA, VWMA, TEMA, DEMA, LSMA, HMA, or ALMA.
Employs a dynamic range calculation using the highest high over a user-defined period, modified by adjustable multipliers.
Offers the option to switch between average range and specific lookback periods for increased adaptability.
Signal Generation:
Scores are calculated based on price action relative to the moving average and dynamic range.
Generates bullish (long) and bearish (short) crossover signals using these scores.
Alerts for long and short conditions are integrated, ensuring traders never miss an opportunity.
Visual Indicators:
Candlestick Coloring: Trends are visually distinguished—greenish hues for bullish conditions and purplish hues for bearish conditions.
Moving Average Line: A semi-transparent, color-coded line dynamically adjusts to match the trend direction for improved clarity.
Range Visualization: A semi-transparent shaded area indicates potential support or resistance levels based on the average range calculation.
Customization Options
Range Settings:
Length: Determines the period for calculating the highest high.
Lookback Alpha & Beta: Enables varied lookback periods for range computation.
Multiplier Alpha & Beta: Fine-tune the range sensitivity using these multipliers.
Use Average Range: Toggle between average range or specific lookback periods for signal generation.
Source Input: Select a data source (e.g., close price) to adapt the range calculation for highly volatile assets.
Moving Average Settings:
Type MA: Choose from multiple moving average methods to suit different trading styles.
Length: Define the length for the moving average calculation.
Source: Specify the price source (default is close price).
Color Customization: Choose personalized colors for bullish and bearish trends to align with your trading environment.
Alerts:
Supertrend Long Alert: Notifies when a bullish crossover is detected.
Supertrend Short Alert: Notifies when a bearish crossover is detected.
How to Use
The Special Forces Supertrend indicator is a versatile tool that excels in identifying and confirming trends.
For optimal performance:
Use it in combination with other indicators or analysis methods to validate signals.
Adjust its parameters to align with specific market instruments or your trading strategy.
This indicator is tailored to meet the needs of both novice and experienced traders, providing flexibility, reliability, and clear visual cues for navigating complex market dynamics.
-Jeffrey
Support Resistance Major/Minor [TradingFinder] Market Structure🔵 Introduction
Support and resistance levels are key concepts in technical analysis, serving as critical points where prices pause or reverse due to the interaction of supply and demand. These foundational elements in price action and classical technical analysis assist traders in understanding market behavior and making better trading decisions.
Support levels are zones where demand is strong enough to prevent further price declines, while resistance levels act as barriers that hinder price increases.
Support and resistance levels are divided into two main types: static and dynamic. Static levels are fixed horizontal lines on charts, formed based on historical price points, and are crucial due to repeated price reactions in these areas.
Dynamic levels, on the other hand, move with market trends and are often identified using tools like moving averages and trendlines. These levels are particularly useful for analyzing dynamic trends and identifying potential reversal points in financial markets.
The importance of support and resistance in technical analysis lies in their ability to pinpoint price reversal or continuation points. Professional traders use these levels to determine optimal entry and exit points and combine them with tools such as Fibonacci retracements or moving averages for precise strategies.
Detailed analysis of price behavior at these levels provides insights into trend strength and the likelihood of price breaks or reversals. By understanding these concepts, technical analysts can forecast future price movements and optimize their trading decisions using tools such as indicators and price action. Support and resistance levels, as a cornerstone of technical analysis, form the foundation for many trading strategies.
🔵 How to Use
The Static Support and Resistance Indicator is a vital tool for identifying significant price zones in financial markets. It automatically detects major and minor support and resistance levels in both short-term and long-term intervals, enabling traders to analyze price behavior accurately and develop optimal entry and exit strategies.
🟣 Major Long-Term Support and Resistance
Major Long-Term Support : The lowest price points recorded over long-term intervals that prevent further declines.
Major Long-Term Resistance : The highest price points in long-term intervals that limit further price increases.
🟣 Minor Long-Term Support and Resistance
Minor Long-Term Support : Temporary halts in price decline within a downtrend over long-term intervals.
Minor Long-Term Resistance : Short-term zones within long-term intervals where prices react negatively in an uptrend.
🟣 Major Short-Term Support and Resistance
Major Short-Term Support : The lowest price points in short-term intervals that act as barriers against sharp price drops.
Major Short-Term Resistance : The highest points in short-term intervals that prevent further price surges.
🟣 Minor Short-Term Support and Resistance
Minor Short-Term Support : Temporary halts in price decline within short-term downtrends.
Minor Short-Term Resistance : Zones where price reacts quickly and reverses in short-term uptrends.
🔵 Settings
Long Term S&R Pivot Period : Defines the interval for identifying long-term support and resistance levels (default: 21).
Short Term S&R Pivot Period : Defines the interval for identifying short-term support and resistance levels (default: 5).
🟣 Long-Term Lines
Major Line Display : Enable/disable major long-term lines.
Minor Line Display : Enable/disable minor long-term lines.
Major Line Colors : Green for support, red for resistance (long-term major levels).
Minor Line Colors : Light green for support, light red for resistance (long-term minor levels).
Major Line Style : Choose between solid, dotted, or dashed lines for major long-term levels.
Minor Line Style : Choose between solid, dotted, or dashed lines for minor long-term levels.
Major Line Width : Adjust the thickness of major long-term lines.
Minor Line Width : Adjust the thickness of minor long-term lines.
🟣 Short-Term Lines
Major Line Display : Enable/disable major short-term lines.
Minor Line Display : Enable/disable minor short-term lines.
Major Line Colors : Gray-green for support, gray-red for resistance (short-term major levels).
Minor Line Colors : Dark green for support, dark red for resistance (short-term minor levels).
Major Line Style : Choose between solid, dotted, or dashed lines for major short-term levels.
Minor Line Style : Choose between solid, dotted, or dashed lines for minor short-term levels.
Major Line Width : Adjust the thickness of major short-term lines.
Minor Line Width : Adjust the thickness of minor short-term lines.
🔵 Conclusion
Static support and resistance levels are among the most critical tools in technical analysis, helping traders identify key reversal or continuation points.
This indicator simplifies and enhances the analysis process by automatically detecting major and minor levels in both short-term and long-term intervals. It allows traders to customize settings to suit their trading strategies and analyze different market levels effectively.
Using this indicator improves price action analysis, enhances market understanding, and identifies trading opportunities. Applicable to all trading styles, from day trading to long-term investing, it is an essential tool for technical analysis.
Combining this indicator with other tools like trendlines, Fibonacci retracements, and moving averages enables comprehensive analysis and allows traders to navigate financial markets with greater confidence.

Dual Bayesian For Loop [QuantAlgo]Discover the power of probabilistic investing and trading with Dual Bayesian For Loop by QuantAlgo , a cutting-edge technical indicator that brings statistical rigor to trend analysis. By merging advanced Bayesian statistics with adaptive market scanning, this tool transforms complex probability calculations into clear, actionable signals—perfect for both data-driven traders seeking statistical edge and investors who value probability-based confirmation!
🟢 Core Architecture
At its heart, this indicator employs an adaptive dual-timeframe Bayesian framework with flexible scanning capabilities. It utilizes a configurable loop start parameter that lets you fine-tune how recent price action influences probability calculations. By combining adaptive scanning with short-term and long-term Bayesian probabilities, the indicator creates a sophisticated yet clear framework for trend identification that dynamically adjusts to market conditions.
🟢 Technical Foundation
The indicator builds on three innovative components:
Adaptive Loop Scanner: Dynamically evaluates price relationships with adjustable start points for precise control over historical analysis
Bayesian Probability Engine: Transforms market movements into probability scores through statistical modeling
Dual Timeframe Integration: Merges immediate market reactions with broader probability trends through custom smoothing
🟢 Key Features & Signals
The Adaptive Dual Bayesian For Loop transforms complex calculations into clear visual signals:
Binary probability signal displaying definitive trend direction
Dynamic color-coding system for instant trend recognition
Strategic L/S markers at key probability reversals
Customizable bar coloring based on probability trends
Comprehensive alert system for probability-based shifts
🟢 Practical Usage Tips
Here's how you can get the most out of the Dual Bayesian For Loop :
1/ Setup:
Add the indicator to your TradingView chart by clicking on the star icon to add it to your favorites ⭐️
Start with default source for balanced price representation
Use standard length for probability calculations
Begin with Loop Start at 1 for complete price analysis
Start with default Loop Lookback at 70 for reliable sampling size
2/ Signal Interpretation:
Monitor probability transitions across the 50% threshold (0 line)
Watch for convergence of short and long-term probabilities
Use L/S markers for potential trade signals
Monitor bar colors for additional trend confirmation
Configure alerts for significant trend crossovers and reversals, ensuring you can act on market movements promptly, even when you’re not actively monitoring the charts
🟢 Pro Tips
Fine-tune loop parameters for optimal sensitivity:
→ Lower Loop Start (1-5) for more reactive analysis
→ Higher Loop Start (5-10) to filter out noise
Adjust probability calculation period:
→ Shorter lengths (5-10) for aggressive signals
→ Longer lengths (15-30) for trend confirmation
Strategy Enhancement:
→ Compare signals across multiple timeframes
→ Combine with volume for trade validation
→ Use with support/resistance levels for entry timing
→ Integrate other technical tools for even more comprehensive analysis

Supports and Resistances Multi Timeframe - VK TradingThe Supports and Resistances Multi Timeframe - VK Trading indicator is designed to help traders identify key support and resistance levels across multiple timeframes. It integrates real-time market data with smooth, customizable visual markers, allowing traders to quickly spot potential entry and exit points. This tool is particularly valuable for trend-following traders who want to see the most critical levels of price action on various timeframes.
Features:
Multi-Timeframe Support: Display support and resistance levels for the current, first, and second timeframes, helping traders identify price points across different market cycles.
Customizable Appearance: Choose from various colors for levels and bands, as well as transparency settings to match your chart's design.
ATR-based Bands: Uses the Average True Range (ATR) to dynamically adjust the width of support and resistance bands, offering more accurate price movement insights.
Pivot Points: Identifies pivot highs and lows, offering precise support and resistance levels based on the price action.
Smoothing Options: Customize the ATR smoothing method with options like RMA, SMA, EMA, and WMA for better alignment with your trading strategy.
Functionalities:
Quick Level Detection: The indicator highlights the most recent high and low levels on the current timeframe, ensuring you’re always aware of nearby price barriers.
Support and Resistance Visualization: Easily visualize the major support and resistance levels on multiple timeframes, improving decision-making and trade management.
Dynamic Band Widths: Customize the ATR multiplier for each timeframe, adapting the support and resistance bands based on the volatility of the market.
Multi-Timeframe Integration: View price action levels from a broader perspective with support and resistance data from the current, first, and second timeframes all in one chart.
Flexible Timeframe Selection: Choose your preferred timeframes for support and resistance levels, from daily, weekly, to monthly, for broader or narrower market views.
How it Helps Traders:
This indicator is ideal for traders who rely on multi-timeframe analysis to make well-informed trading decisions. By visualizing key support and resistance levels across several timeframes, traders can improve the precision of their entries and exits, better manage risk, and enhance their market timing. The tool provides a comprehensive view of price action, allowing traders to spot potential reversals and breakouts, making it easier to execute strategies effectively.
Disclaimer:
This script is an educational and analytical tool. It does not guarantee specific results or eliminate trading risk. Trading in the financial markets involves significant risks; use this script at your own risk.

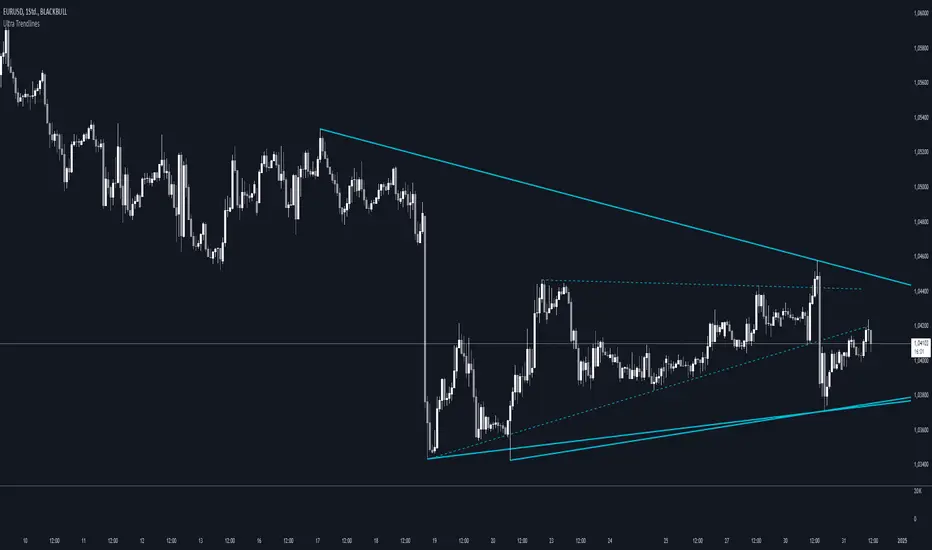
Ultra TrendlinesThis indicator automatically draws trendlines based on every pivot point, helping traders visualize key support and resistance levels. It dynamically adjusts as new pivots are detected and validates the trendlines against price movement.
Introduction
The Ultra Trendlines indicator is designed to help traders identify and track significant trendlines on their charts. By automatically detecting pivot points (both highs and lows), it draws trendlines that highlight key market movements. These trendlines are valuable for understanding the broader trend and for making informed trading decisions.
Detailed Description
The indicator analyzes price data to find pivot points highs and lows over a user-defined lookback period. Once a pivot is detected, it draws trendlines between the pivot points.
.........
Accuracy
To ensure accuracy, the indicator only keeps trendlines that are confirmed by price action. It checks if the price crosses the trendline and deletes invalid lines.
Additionally, it checks if the trendlines stay within predefined price thresholds, filtering out irrelevant lines that are too far from current price action.
The indicator also has an option to only show "rising lows" and "falling highs" trendlines, offering further precision in trend direction.
As new pivots are detected, older trendlines that fall outside the lookback period are removed, ensuring the chart remains clean.
.....
Style
The trendlines can extend forward (infinite and userdefined), backward, both or none. The lines are drawn with a customizable style (solid, dotted, or dashed), color, and width.
.........
Summary of Key Points
The indicator automatically detects pivot points (highs and lows) and draws trendlines based on them. It allows you to customize the style, color, and width of the trendlines. The indicator filters out invalid trendlines by checking if they are still relevant based on price action and price thresholds. Additionally, you can choose to only display rising lows and falling highs for more accurate trend analysis. It also removes outdated trendlines to keep the chart clean.
RM - Hull Moving RegressionRM - Hull Moving Regression (RM - HMR)
This indicator integrates the Enhanced Hull Moving Average (EHMA) with linear regression and RSI to provide a comprehensive view of market trends and momentum. By combining advanced smoothing techniques with dynamic visual cues, it delivers actionable insights for traders seeking clarity in price movements.
Key Features
- Enhanced Hull Moving Average (EHMA):
The indicator computes EHMA values using the open, high, low, and close prices. These are averaged to create a smooth, responsive representation of market trends.
- Linear Regression Smoothing:
The EHMA output is further refined with a linear regression model, reducing noise and highlighting directional trends.
- RSI-Tracking:
RSI is calculated on the smoothed regression output.
- Dynamic Bar Coloring:
Bars change color to reflect shifts in momentum:
- Green for increasing momentum.
- Orange for decreasing momentum.
- Customizable Parameters:
Users can adjust the RSI length, regression length, and EHMA period to suit their trading strategy.
How It Works
1. The indicator calculates EHMA values for four price sources (open, high, low, close).
2. These EHMA values are averaged to generate a smoother price action metric.
3. The averaged EHMA is processed through a linear regression model to further smooth the data.
4. RSI is then applied to the regression output.
How to Use
- Identify Market Trends:
Use the color-coded bars and moving averages to confirm overall market direction.
- Monitor Momentum Changes:
Look for shifts in bar color (e.g., green to orange) to identify potential weakening or strengthening trends.
- Combine with Other Indicators:
Integrate the RM-HMR with other trend-following or momentum tools for robust analysis and confirmation.
Example Use Cases
- Trend Following:
Utilize the smooth moving averages and bar colors to follow dominant market trends.
Disclaimer
This indicator is designed for educational and analytical purposes. It should not be used in isolation and must be paired with sound risk management practices and additional tools for comprehensive market analysis.

Multi-Timeframe Liquidity LevelsMulti-Timeframe Liquidity Levels – Overview
The Multi-Timeframe Liquidity Levels indicator automatically displays significant highs and lows from various timeframes (Daily, Weekly, Monthly, and Quarterly) on your current chart. This allows traders to quickly identify potential support and resistance zones without frequently switching between different timeframe charts. Additionally, the script offers extra lines for special reference points (e.g., the “Midnight” midpoint of the current day and the previous day’s open/close) to highlight potential liquidity zones even more clearly.
1. Core Idea and Benefits
Time-Saving: Instead of manually reviewing charts in different timeframes, the indicator fetches relevant high/low levels automatically and shows them on your active timeframe.
Clear Layout: Traders instantly see where the Daily, Weekly, Monthly, and Quarterly highs and lows lie—areas often associated with institutional orders or liquidity hunts.
Customizable: You can tailor the color scheme, line style (Solid, Dashed, Dotted), and line width, ensuring the displayed levels fit your personal charting style.
2. How It Works
Multi-Timeframe High/Low
For each timeframe (Day, Week, Month, Quarter), the indicator references the previous candle’s high and low (high , low ).
Using request.security(...), these values are plotted on the chart you’re currently viewing.
Flexible Display
You can individually enable or disable the Daily, Weekly, Monthly, and Quarterly lines, depending on which levels are most relevant to your trading.
With Line Style (Solid, Dashed, Dotted) and Line Width, you can easily emphasize certain lines you consider more important.
Additional Lines
“Midnight” Line: A theoretical midpoint between today’s high and low, which can be useful for gauging daily pivot areas.
Previous Day’s Open/Close: Many traders track these reference points to anticipate market reactions. You can show or hide these lines as desired.
Automatic Line Removal & Creation
When a particular timeframe (e.g., “Show Monthly Levels”) is disabled, the script automatically removes the existing monthly lines.
Enabling it again recreates those lines without hassle.
3. Usage and Interpretation
Identifying Support and Resistance
Highs and lows from higher timeframes are often key zones for entries, exits, or major market reactions.
A Daily level may be crucial for short-term traders, whereas Monthly or Quarterly levels can indicate long-term liquidity areas.
Spotting Market Shifts
If price decisively moves above a Higher-Timeframe line, it could signal strong momentum.
Conversely, a failed breakout (where price quickly returns under or above a level) might warn of a potential reversal.
Extra Lines as Filters
The “Midnight” Line helps visualize a rough central price for the current day, aiding in intraday directional bias.
Previous Day’s Open/Close: Common reference points for day traders, where swift approaches and rejections can indicate potential entries or partial take-profit zones.
4. Practical Tips
Use Color-Coding Wisely: Assign distinct colors (e.g., Blue for Daily, Green for Weekly, Orange for Monthly, Purple for Quarterly) so you can easily discern which timeframe you’re looking at.
Toggle On/Off As Needed: Day traders might focus on Daily and Weekly, while long-term traders may pay closer attention to Monthly and Quarterly.
Combine with Price Action: Lines alone don’t constitute a trading strategy. Use them alongside candlestick patterns, volume analysis, or other indicators for a more complete market perspective.
5. Important Notes & Recommendations
Not Financial Advice: This indicator simply reflects historical high/low data across multiple timeframes and does not constitute a buy or sell recommendation.
Trader Responsibility: Observe how the market actually behaves around these lines and adapt your risk management accordingly.

Twiggs Money FlowTwiggs Money Flow (TMF)
This indicator is an implementation of the Twiggs Money Flow (TMF), a volume-based tool designed to measure buying and selling pressure over a specified period. TMF is an enhancement of Chaikin Money Flow (CMF), utilizing more sophisticated smoothing techniques for improved accuracy and reduced noise. This version is highly customizable and includes advanced features for both new and experienced traders.
What is Twiggs Money Flow?
Twiggs Money Flow was developed by Colin Twiggs to provide a clearer picture of market momentum and the balance between buyers and sellers. It uses a combination of price action, trading volume, and range calculations to assess whether a market is under buying or selling pressure.
Unlike traditional volume indicators, TMF incorporates Weighted Moving Averages (WMA) by default but allows for other moving average types (SMA, EMA, VWMA) for added flexibility. This makes it adaptable to various trading styles and market conditions.
Features of This Script:
Customizable Moving Average Types:
Select from SMA , EMA , WMA , or VWMA to smooth volume and price-based calculations.
Tailor the indicator to align with your trading strategy or the asset's behavior.
Optional HMA Smoothing:
Apply Hull Moving Average (HMA) smoothing for a cleaner, faster-reacting TMF line.
Perfect for traders who want to reduce lag and capture trends earlier.
Dynamic Thresholds for Signal Filtering:
Set user-defined thresholds for Long (LT) and Short (ST) signals to highlight significant momentum.
Focus on actionable trends by ignoring noise around neutral levels.
Bar Coloring for Visual Clarity:
Automatically colors your chart bars based on TMF values:
Aqua for strong bullish signals (above the long threshold).
Fuchsia for strong bearish signals (below the short threshold).
Gray for neutral or undecided market conditions.
Ensures that trend direction and strength are visually intuitive.
Configurable Lookback Period:
Adjust the sensitivity of TMF by customizing the length of the lookback period to suit different timeframes and market conditions.
How It Works:
True Range Calculation: The script determines the high, low, and close range to calculate buying and selling pressure.
Adjusted Volume: Incorporates the relationship between price and volume to gauge whether trading activity is favoring buyers or sellers.
Weighted Moving Averages (WMAs): Smooths both volume and adjusted volume values to eliminate erratic fluctuations.
TMF Line: Computes the ratio of adjusted volume to total volume, representing the net buying/selling pressure as a percentage.
HMA Option (if enabled): Smooths the TMF line further to reduce lag and enhance trend identification.
Bar Coloring Logic:
Bars are colored dynamically based on TMF values, thresholds, and smoothing preferences.
Provides an at-a-glance understanding of market conditions.
Input Parameters:
Lookback Period: Defines the number of bars used to calculate TMF (default: 21).
Use HMA Smoothing: Toggle Hull Moving Average smoothing (default: true).
HMA Smoothing Length: Length of the HMA smoothing period (default: 14).
Moving Average Type: Select SMA, EMA, WMA, or VWMA (default: WMA).
Long Threshold (LT): Threshold value above which a long signal is considered (default: 0).
Short Threshold (ST): Threshold value below which a short signal is considered (default: 0).
How to Use It:
Confirm Trends: TMF can validate trends by identifying periods of sustained buying or selling pressure.
Divergence Signals: Watch for divergences between price and TMF to anticipate potential reversals.
Filter Trades: Use the thresholds to ignore weak signals and focus on strong trends.
Combine with Other Indicators: Pair TMF with trend-following or momentum indicators (e.g., RSI, Bollinger Bands) for a comprehensive trading strategy.
Example Use Cases:
Spotting breakouts when TMF crosses above the long threshold.
Identifying sell-offs when TMF dips below the short threshold.
Avoiding sideways markets by ignoring neutral (gray) bars.
Notes:
This indicator is highly customizable, making it versatile across different assets (e.g., stocks, crypto, forex).
While the default settings are robust, tweaking the lookback period, moving average type, and thresholds is recommended for different trading instruments or strategies.
Always backtest thoroughly before applying the indicator to live trading.
This version of Twiggs Money Flow goes beyond standard implementations by offering advanced smoothing, custom thresholds, and enhanced visual feedback to give traders a competitive edge.
Add it to your charts and experience the power of volume-driven analysis!

Filtered ATR with EMA OverlayFiltered ATR with EMA Overlay is an advanced volatility indicator designed to provide a more accurate representation of market conditions by smoothing the standard Average True Range (ATR). This is achieved by filtering out extreme price movements and abnormal bars that can distort traditional ATR calculations.
The indicator applies an Exponential Moving Average (EMA) to the filtered ATR, creating a dual-layered system that highlights periods of increased or decreased volatility.
Key Features:
Filtered ATR: Filters out extreme bars, reducing noise and making the ATR line more reliable.
EMA Overlay: An EMA (default period of 10) is applied to the filtered ATR, allowing traders to track average volatility trends.
Volatility Signals:
Filtered ATR > EMA(10): Indicates higher-than-average volatility. This often correlates with trend breakouts or strong price movements.
Filtered ATR < EMA(10): Suggests reduced volatility, signaling potential consolidation or sideways price action.
Parameters:
atrLength (Default: 5):
The number of bars used to calculate the ATR. A shorter period (e.g., 3-5) responds faster to price changes, while a longer period (e.g., 10-14) provides smoother results.
multiplier (Default: 1.8):
Controls the sensitivity of the filter. A lower multiplier (e.g., 1.5) filters out more bars, resulting in smoother ATR. Higher values (e.g., 2.0) allow more bars to pass through, retaining more price volatility.
maxIterations (Default: 20):
The maximum number of bars processed to detect abnormal values. Increasing this may improve accuracy at the cost of performance.
ema10Period (Default: 10):
The period for the Exponential Moving Average applied to the filtered ATR. Shorter periods provide faster signals, while longer periods give smoother, lagging signals.
Trading Strategies:
1. Breakout Strategy:
When filtered ATR crosses above EMA(10):
Enter long positions when price breaks above a key resistance level.
Higher volatility suggests strong price action and momentum.
When filtered ATR drops below EMA(10):
Exit positions or tighten stop-loss orders as volatility decreases.
Lower volatility may indicate consolidation or trend exhaustion.
2. Trend Following Strategy:
Use the filtered ATR line to track overall volatility.
If filtered ATR consistently stays above EMA: Hold positions or add to trades.
If filtered ATR remains below EMA: Reduce position size or stay out of trades.
3. Mean Reversion Strategy:
When filtered ATR spikes significantly above EMA, it may indicate market overreaction.
Look for price to revert to the mean once ATR returns below the EMA.
4. Stop-Loss Adjustment:
As volatility increases (ATR above EMA), widen stop-loss levels to avoid being stopped out by random fluctuations.
In low volatility (ATR below EMA), tighten stop-losses to minimize losses during low activity periods.
Benefits:
Reduced Noise: By filtering abnormal bars, the indicator provides cleaner signals.
Better Trend Detection: EMA smoothing highlights volatility trends.
Adaptable: The indicator can be customized for scalping, day trading, or swing trading.
Intuitive Visualization: Traders can visually see volatility shifts and adjust strategies in real-time.
Best Practices:
Timeframes: Works effectively on all timeframes, but higher timeframes (e.g., 1H, 4H, Daily) yield more reliable signals.
Markets: Suitable for forex, crypto, stocks, and commodities.
Combining Indicators: Use in combination with RSI, Moving Averages, Bollinger Bands, or price action analysis for stronger signals.
How It Works (Under the Hood):
The script calculates the Daily Range (High - Low) for each bar.
The largest and smallest bars are filtered out if their difference exceeds the multiplier (default 1.8).
The remaining bars are averaged to generate the filtered ATR.
An EMA(10) is then applied to the filtered ATR for smoother visualization.

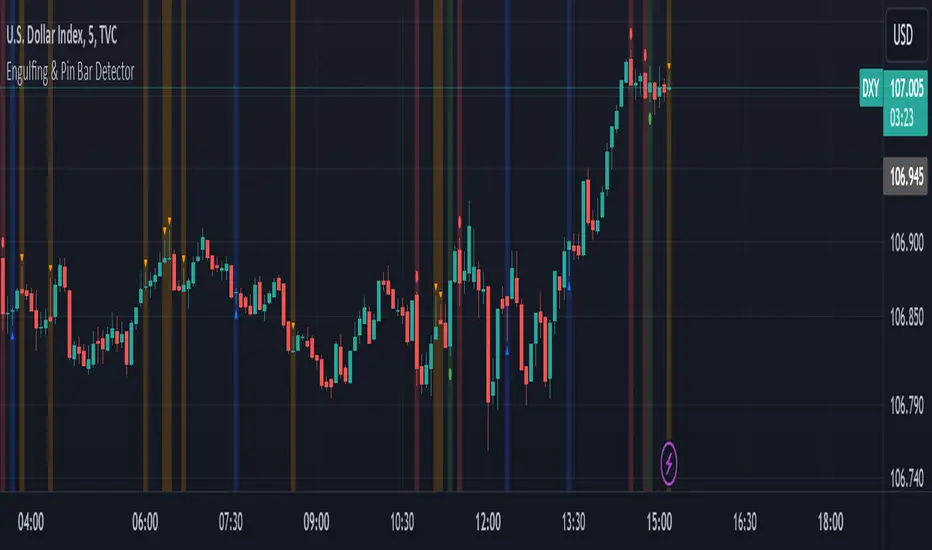
Engulfing & Pin Bar DetectorOverview
The "Engulfing & Pin Bar Detector" script identifies two important candlestick patterns: Engulfing Candles and Pin Bars. These patterns are widely used in technical analysis to signal potential reversals or continuations in the market. The script provides visual signals directly on the chart to help traders make informed decisions.
Features Bullish Engulfing:
The second candle completely engulfs the body and shadows (high and low) of the previous bearish candle.
Signals a potential reversal to the upside.
Marked with a green background and a label below the candle.
Bearish Engulfing:
The second candle completely engulfs the body and shadows (high and low) of the previous bullish candle.
Signals a potential reversal to the downside.
Marked with a red background and a label above the candle.
Bullish Pin Bar:
A candle with a long lower shadow and a small body near the top of the range.
Indicates potential upward price action.
Marked with a blue background and an upward triangle below the candle.
Bearish Pin Bar:
A candle with a long upper shadow and a small body near the bottom of the range.
Indicates potential downward price action.
Marked with an orange background and a downward triangle above the candle.
Customizable Visual Alerts:
Background highlights and shape markers for quick and easy identification of patterns.
How to Use
Add the script to your TradingView chart.
Look for:
Green background: Bullish Engulfing.
Red background: Bearish Engulfing.
Blue background: Bullish Pin Bar.
Orange background: Bearish Pin Bar.
Combine with other indicators or price action techniques for confirmation.
Adjust your entry and exit strategies based on the patterns:
For Bullish Engulfing or Bullish Pin Bar, consider entering long positions or exiting shorts.
For Bearish Engulfing or Bearish Pin Bar, consider entering short positions or exiting longs.
Example Use Cases
Identify potential reversal zones.
Use as confirmation in trend-following or counter-trend strategies.
Enhance your analysis with clear visual signals.
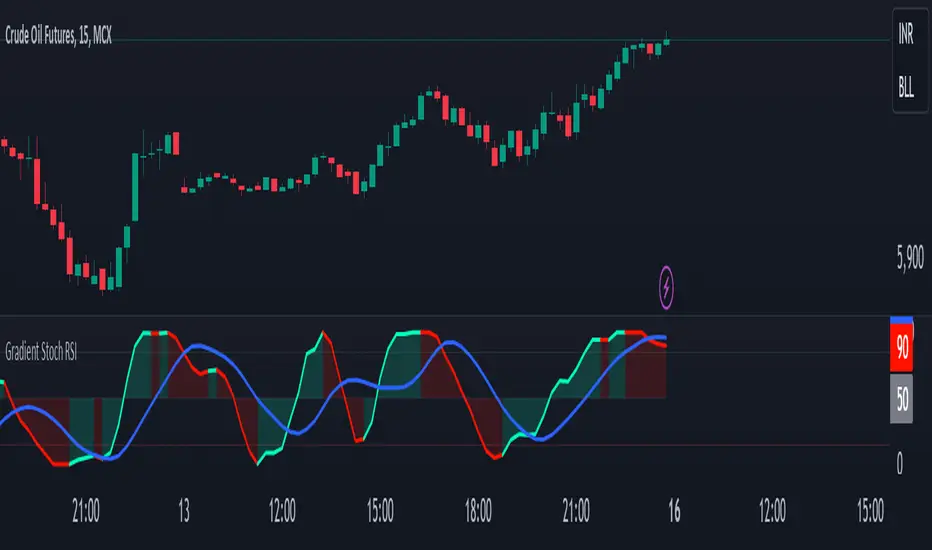
Gradient Stochastic RSI CyclesThe Gradient Stochastic RSI Cycles indicator combines several key technical concepts into one, providing a unique perspective compared to the traditional RSI (Relative Strength Index) and other indicators typically used . Here's a breakdown of the specific features that make this indicator stand out:
1. Stochastic RSI (StochRSI):
The Stochastic RSI is a momentum indicator that applies the Stochastic Oscillator formula to the RSI. While RSI alone measures overbought and oversold conditions based on the price's relative strength, StochRSI refines this by measuring the position of RSI relative to its own range over a specified period.
This approach helps identify overbought and oversold conditions more dynamically, and it can be a leading indicator compared to the traditional RSI, which may lag in certain market conditions.
2. Key Differences from Traditional RSI:
RSI (Traditional): The RSI directly compares the average gains and losses of the price over a set period (typically 14 periods). It outputs a value between 0 and 100, where values above 70 indicate overbought conditions and values below 30 suggest oversold conditions.
Stochastic RSI: Instead of being calculated from price itself, the StochRSI is derived from the RSI, which adds an additional layer of smoothness and filtering. This makes it more responsive to changes in market momentum, often producing faster signals, especially in volatile markets.
Key Advantage: The Stochastic RSI often generates more timely signals by incorporating both RSI and Stochastic Oscillator principles. This leads to clearer identification of trend reversals or continuation signals, especially in strongly trending or choppy markets.
3. Smoothing and Signal Generation:
%K and %D Smoothing: The indicator uses two key smoothing steps for generating signals: the %K line (stochastic RSI itself) and the %D line (a smoothed version of %K). These are typical of Stochastic indicators but applied to the RSI, making it more sophisticated and adaptive to market cycles.
The moving average of %K (denoted as the "MA Line") further refines the trend signals by smoothing the price action of the %K line. This allows for better trend recognition, reducing false signals in sideways markets.
Key Advantage: The added smoothing steps from the %K, %D, and MA Line help in producing less erratic signals, enabling smoother and more accurate trend-following behavior. The MA line is especially useful in filtering out noise in the Stochastic RSI.
4. Trend Direction (Bullish vs Bearish):
Bullish/Bearish Conditions: The indicator includes a clear trend identification mechanism, where the indicator is considered bullish when the %K line is above the %D line and bearish when it is below.
This distinction is visually represented with gradient colors, where the bullish condition is highlighted with a green color (often associated with upward momentum) and bearish with a red color (indicating downward pressure).
Key Advantage: By distinguishing the trend direction visually and dynamically, this feature adds a layer of market interpretation that is not present in the traditional RSI. It offers clarity in identifying bullish or bearish cycles within market movements, making it easier for traders to align their positions with prevailing market trends.
5. Gradient Colors and Visualization:
The indicator uses gradient colors to visually represent the market condition. The color changes dynamically based on whether the market is in a bullish or bearish state, providing immediate feedback to the trader on the momentum of the asset.
This color gradient approach adds a clear visual reference compared to the traditional line-based RSI indicators, where traders have to infer trend direction based on multiple readings or conditions.
Key Advantage: The color gradient not only serves as a trend indicator but also makes the signal more visually accessible and easier to interpret in real-time.
6. Threshold Levels and Overbought/Oversold Conditions:
Horizontal Lines at 15 and 85: These thresholds are used to mark oversold and overbought levels, similar to how the 30 and 70 levels function in the traditional RSI. The key difference here is that the Stochastic RSI is more sensitive to price movements, and thus these levels can be more dynamic and precise in identifying extreme market conditions.
Key Advantage: The Stochastic RSI's threshold levels offer more precise markers for overbought and oversold conditions in comparison to the RSI, providing better actionable insights during volatile market phases.
7. Gradient Fill between %K and Midline:
The indicator fills the area between the %K line and the Midline (50) based on whether the trend is bullish or bearish, with different opacities depending on the trend.
Key Advantage: This visual fill enhances the clarity of market cycles and trend phases, making it easier for traders to spot potential trend reversals or trend-following opportunities. The fill acts as a dynamic background to reinforce the current market sentiment.
Advanced Trend Following: Unlike basic RSI or Stochastic indicators, the Gradient Stochastic RSI Cycles indicator integrates trend-following principles with stochastic analysis applied to RSI, creating a powerful hybrid for capturing market momentum.
Dynamic Visual Feedback: The gradient color effect and fill based on trend direction give this indicator a unique visual aspect that makes market conditions more intuitive and easier to analyze at a glance. This is not available in traditional RSI or most common stochastic oscillators.
Enhanced Overbought/Oversold Signals: By utilizing the Stochastic RSI, this indicator offers more responsive overbought and oversold levels, often leading to earlier signals compared to the conventional RSI.
Smooth and Adaptive: The multiple smoothing steps used in the indicator (with %K, %D, and the MA line) provide a more adaptive approach to trend filtering, reducing false signals that often occur with basic indicators.
In summary, the Gradient Stochastic RSI Cycles indicator is an advanced, adaptive tool that combines RSI, Stochastic Oscillator, and moving averages to provide traders with more accurate, timely, and visually accessible market signals. Its design helps overcome many of the limitations associated with traditional RSI or stochastic-based indicators, offering a more refined analysis of price momentum.
C|M Capital (Market Structure Pro)CM Capital (Market Structure Pro)
Overview:
The CM Capital (Market Structure Pro) Indicator is a groundbreaking tool for traders seeking a comprehensive market analysis. This closed-source script merges multiple facets of market dynamics into a single, user-friendly interface, designed to enhance decision-making by providing a multi-dimensional view of market behavior. By combining advanced market structure detection, liquidity event identification, Fair Value Gap analysis, and session-specific insights, this indicator offers traders a strategic advantage in navigating the complexities of financial markets.
Key Functionalities:
Market Structure Insights:
Break of Structure (BOS) and Market Structure Shifts (MSS):
Methodology: Our approach uses fractal analysis coupled with custom algorithms to dissect price movements, identifying pivotal moments where market structure breaks or shifts. The script evaluates candle patterns, volume data, and price momentum to flag these events.
Customization: Users can choose between candle close or wick confirmations and select from various line styles for visualization, tailoring the sensitivity to match their trading strategy, whether it's scalping or swing trading.
Utility: These markers act as early signals for trend changes, allowing traders to prepare for potential reversals or continuations, especially useful in volatile markets where timely decisions are crucial.
Structure Strength:
Highs and Lows Definition: The 'Structure Strength' setting in this indicator directly influences the identification of structure highs and lows. It's not just about detecting market structure; it's about defining what constitutes a significant high or low based on your trading horizon.
Swing vs. Internal Structure:
Lower Strength: Opting for a lower strength setting will highlight more extreme, swing-type structures. This means the indicator will mark out only the most pronounced highs and lows, which are ideal for traders focusing on broader market swings or longer-term trends.
Higher Strength: Conversely, increasing the strength level plots more internal structure levels. This setting is perfect for traders who want to dive into the market's micro-movements, offering insights into potential support and resistance within ongoing trends, essentially capturing more reactive and detailed price action.
Strategic Application: This adjustable parameter allows traders to zoom in or out on the market structure, aligning with their trading style or the specific market conditions they're navigating. Whether you're looking to catch significant market turns or to finesse entries and exits within a trend, the structure strength setting provides the granularity needed for nuanced market analysis.
Liquidity Sweeps:
Detection: Beyond traditional price action analysis, our indicator incorporates a unique method to spot liquidity sweeps. By analyzing price movements against historical support/resistance zones, it highlights instances where significant orders might have been absorbed, suggesting areas of potential price reversal or continuation.
Visualization: Liquidity sweeps are visually marked with customizable colors and an 'X' label, making them instantly recognizable. This feature is particularly beneficial for traders looking to enter or exit trades based on market inefficiencies or anticipated institutional activity.
Application: Traders can use these signals to anticipate where the market might react strongly, either as support for entries or as a caution for exits, enhancing trade precision.
Fair Value Gaps (FVGs):
Identification: Our proprietary FVG detection algorithm looks for price discrepancies over recent bars, signaling where the market could aim to rebalance. This is not merely about spotting gaps but understanding their context within the market's flow.
Enhanced Visualization: Users can extend FVGs across the chart, providing a clearer view of potential mean reversion points or continuation levels, aiding in setting targets or stop-losses.
Strategic Use: FVGs serve as dynamic levels where traders might expect price action to revisit, offering opportunities for mean reversion trades or confirming trend strength.
Session Visualization:
Session Markers: By delineating Asia, London, and New York session times, the indicator helps traders recognize session-specific volatility, trends, and liquidity conditions. Each session can be customized for color and duration, aligning with various trading strategies.
Timeframe Correlation: Integrating session analysis with structural and liquidity insights allows for a strategy where trades are timed not just by price action but by when in the global market cycle they occur, potentially increasing the effectiveness of entry and exit points.
Watermark Display:
Personalization: Add a personal touch or brand identity to your charts with customizable text and color options for the watermark, enhancing both the aesthetic and functional aspects of your trading setup.
Originality:
This script's originality lies in its holistic approach to market analysis. The integration of these diverse yet synergistic components provides a unique toolset:
Confluence of Signals: Each element enhances the others, creating a confluence where structural changes, liquidity events, and time-based market conditions are analyzed in concert, offering a more complete trading signal than isolated indicators.
Customization for Diverse Trading Styles: From high-frequency scalping to long-term trend following, the script's flexibility caters to a broad spectrum of trading strategies by allowing adjustments in sensitivity, visualization, and application.
How to Use:
Setup: Add the script to your chart and explore the settings in the input panel. Customize the visual and functional aspects to align with your trading style.
Strategy Application:
Use BOS/MSS for trend confirmation, liquidity sweeps for entry/exit precision, FVGs for mean reversion opportunities, and session markers to time your trades optimally.
Consider combining signals for stronger trade validation; for instance, a BOS during the London session might be more significant if it coincides with a liquidity sweep and an FVG from the Asian session.
