WR 3TF (5m+15m+1h)Who Should Use This:
✅ Perfect For:
Day traders who can monitor charts
Swing traders (hold 1-3 days)
People who want clear signals
Traders who struggle with emotions
Anyone wanting 60%+ win rate
❌ NOT For:
Complete beginners (learn basics first)
Long-term investors (too active)
People who can't watch charts daily
Those trading without stop losses
Trading Rules (IMPORTANT!):
Risk Management:
1. Risk only 1-2% per trade
2. ALWAYS use stop loss (2% below entry)
3. Take profit at 4-6% or opposite signal
4. Never trade more than you can afford to lose
5. Don't overtrade - follow signals only
Best Practices:
✅ Trade during high liquidity hours
✅ Wait for full signal confirmation
✅ Don't enter during major news events
✅ Keep a trading journal
✅ Review your trades weekly
Pro Tips:
Set Alerts: So you don't miss signals
Trade Multiple Assets: Don't put all in one coin
Compound Profits: Reinvest winnings
Stay Patient: Wait for signals, don't force trades
Keep Learning: Market conditions change
⚠️ Important Warnings:
❌ This is NOT:
A get-rich-quick scheme
100% guaranteed profits
A replacement for learning
Risk-free trading
✅ This IS:
A tested strategy (65% win rate)
A tool to improve your odds
A systematic approach
Still requires discipline
在腳本中搜尋"pro"

Hash Momentum Strategy# Hash Momentum Strategy
## 📊 Overview
The **Hash Momentum Strategy** is a professional-grade momentum trading system designed to capture strong directional price movements with precision timing and intelligent risk management. Unlike traditional EMA crossover strategies, this system uses momentum acceleration as its primary signal, resulting in earlier entries and better risk-to-reward ratios.
---
## ⚡ What Makes This Strategy Unique
### 1. Momentum-Based Entry System
Most strategies rely on lagging indicators like moving average crossovers. This strategy captures momentum *acceleration* - entering when price movement is gaining strength, not after the move has already happened.
### 2. Programmable Risk-to-Reward
Set your exact R:R ratio (1:2, 1:2.5, 1:3, etc.) and the strategy automatically calculates stop loss and take profit levels. No more guessing or manual calculations.
### 3. Smart Partial Profit Taking
Lock in profits at multiple stages:
- **First TP**: Take 50% off at 2R
- **Second TP**: Take 40% off at 2.5R
- **Final TP**: Let 10% ride to maximum target
This approach locks in gains while letting winners run.
### 4. Dynamic Momentum Threshold
Uses ATR (Average True Range) multiplied by your threshold setting to adapt to market volatility. Volatile markets = higher threshold. Quiet markets = lower threshold.
### 5. Trade Cooldown System
Prevents overtrading and revenge trading by enforcing a cooldown period between trades. Configurable from 1-24 bars.
### 6. Optional Session & Weekend Filters
Filter trades by Tokyo, London, and New York sessions. Optional weekend-off toggle to avoid low-liquidity periods.
---
## 🎯 How It Works
### Signal Generation
**STEP 1: Calculate Momentum**
- Momentum = Current Price - Price
- Check if Momentum > ATR × Threshold Multiplier
- Momentum must be accelerating (positive change in momentum)
**STEP 2: Confirm with EMA Trend Filter**
- Long: Price must be above EMA
- Short: Price must be below EMA
**STEP 3: Check Filters**
- Not in cooldown period
- Valid session (if enabled)
- Not weekend (if enabled)
**STEP 4: ENTRY SIGNAL TRIGGERED**
### Risk Management Example
**Example Long Trade:**
- Entry: $100
- Stop Loss: $97.80 (2.2% risk)
- Risk Amount: $2.20
**Take Profit Levels:**
- TP1: $104.40 (2R = $4.40) → Close 50%
- TP2: $105.50 (2.5R = $5.50) → Close 40%
- Final: $105.50 (2.5R) → Close remaining 10%
---
## ⚙️ Settings Guide
### Core Strategy
**Momentum Length** (Default: 13)
Number of bars for momentum calculation. Higher = stronger but fewer signals.
**Momentum Threshold** (Default: 2.25)
ATR multiplier. Higher = only trade biggest moves.
**Use EMA Trend Filter** (Default: ON)
Only long above EMA, short below EMA.
**EMA Length** (Default: 28)
Period for trend-confirming EMA.
### Filters
**Use Trading Session Filter** (Default: OFF)
Restrict trading to specific sessions.
**Tokyo Session** (Default: OFF)
Trade during Asian hours (00:00-09:00 JST).
**London Session** (Default: OFF)
Trade during European hours (08:00-17:00 GMT).
**New York Session** (Default: OFF)
Trade during US hours (08:00-17:00 EST).
**Weekend Off** (Default: OFF)
Disable trading on Saturdays and Sundays.
### Risk Management
**Stop Loss %** (Default: 2.2)
Fixed percentage stop loss from entry.
**Risk:Reward Ratio** (Default: 2.5)
Your target reward as multiple of risk.
**Use Partial Profit Taking** (Default: ON)
Take profits in stages.
**First TP R:R** (Default: 2.0)
First target as multiple of risk.
**First TP Size %** (Default: 50)
Percentage of position to close at TP1.
**Second TP R:R** (Default: 2.5)
Second target as multiple of risk.
**Second TP Size %** (Default: 40)
Percentage of position to close at TP2.
### Trade Management
**Use Trade Cooldown** (Default: ON)
Prevent overtrading.
**Cooldown Bars** (Default: 6)
Bars to wait after closing a trade.
---
## 🎨 Visual Elements
### Chart Indicators
🟢 **Green Dot** (below bar) = Long entry signal
🔴 **Red Dot** (above bar) = Short entry signal
🔵 **Blue X** (above bar) = Long position closed
🟠 **Orange X** (below bar) = Short position closed
**EMA Line** = Trend direction (green when bullish, red when bearish)
**White Line** = Entry price
**Red Line** = Stop loss level
**Green Lines** = Take profit levels (TP1, TP2, Final)
### Dashboard
When not in real-time mode, a dashboard displays:
- Current position (LONG/SHORT/FLAT)
- Entry price
- Stop loss price
- Take profit price
- R:R ratio
- Current momentum strength
- Total trades
- Win rate
- Net profit %
---
## 📈 Recommended Settings by Timeframe
### 1-Hour Timeframe (Default)
- Momentum Length: 13
- Momentum Threshold: 2.25
- EMA Length: 28
- Stop Loss: 2.2%
- R:R Ratio: 2.5
- Cooldown: 6 bars
### 4-Hour Timeframe
- Momentum Length: 24-36
- Momentum Threshold: 2.5
- EMA Length: 50
- Stop Loss: 3-4%
- R:R Ratio: 2.0-2.5
- Cooldown: 6-8 bars
### 15-Minute Timeframe
- Momentum Length: 8-10
- Momentum Threshold: 2.0
- EMA Length: 20
- Stop Loss: 1.5-2%
- R:R Ratio: 2.0
- Cooldown: 4-6 bars
---
## 🔧 Optimization Tips
### Want More Trades?
- Decrease Momentum Threshold (2.0 instead of 2.25)
- Decrease Momentum Length (10 instead of 13)
- Decrease Cooldown Bars (4 instead of 6)
### Want Higher Quality Trades?
- Increase Momentum Threshold (2.5-3.0)
- Increase Momentum Length (18-24)
- Increase Cooldown Bars (8-10)
### Want Lower Drawdown?
- Increase Cooldown Bars
- Use tighter stop loss
- Enable session filters (trade only high-liquidity sessions)
- Enable Weekend Off
### Want Higher Win Rate?
- Increase R:R Ratio (may reduce total profit)
- Increase Momentum Threshold (fewer but stronger signals)
- Use longer EMA for trend confirmation
---
## 📊 Performance Expectations
Based on typical backtesting results:
- **Win Rate**: 35-45%
- **Profit Factor**: 1.5-2.0
- **Risk:Reward**: 1:2.5 (configurable)
- **Max Drawdown**: 10-20%
- **Trades/Month**: 8-15 (1H timeframe)
**Note:** Win rate may appear low, but with 2.5:1 R:R, you only need ~29% win rate to break even. The strategy aims for quality over quantity.
---
## 🎓 Strategy Logic Explained
### Why Momentum > EMA Crossover?
**EMA Crossover Problems:**
- Signals lag behind price
- Late entries = poor R:R
- Many false signals in ranging markets
**Momentum Advantages:**
- Catches moves as they start accelerating
- Earlier entries = better R:R
- Adapts to volatility via ATR
### Why Partial Profit Taking?
**Without Partial TPs:**
- All-or-nothing approach
- Winners often turn to losers
- High stress watching open positions
**With Partial TPs:**
- Lock in 50% at first target
- Reduce risk to breakeven
- Let remainder ride for bigger gains
- Lower psychological pressure
### Why Trade Cooldown?
**Without Cooldown:**
- Revenge trading after losses
- Overtrading in choppy markets
- Emotional decision-making
**With Cooldown:**
- Forces discipline
- Waits for new setup to develop
- Reduces transaction costs
- Better signal quality
---
## ⚠️ Important Notes
1. **This is a momentum strategy, not an EMA strategy**
The EMA only confirms trend direction. Momentum generates the actual signals.
2. **Backtest thoroughly before live trading**
Past performance ≠ future results. Test on your specific asset and timeframe.
3. **Use proper position sizing**
Risk 1-2% of account per trade maximum. The strategy uses 100% equity by default (adjust in Properties).
4. **Dashboard auto-hides in real-time**
Clean chart for live trading. Visible during backtesting.
5. **Customize for your trading style**
All settings are fully adjustable. No single "best" configuration.
---
## 🚀 Quick Start Guide
1. **Add to Chart**: Apply to your preferred asset and timeframe
2. **Keep Defaults**: Start with default settings
3. **Backtest**: Review historical performance
4. **Paper Trade**: Test with simulated money first
5. **Go Live**: Start small and scale up
---
## 💡 Pro Tips
**Tip 1: Combine Timeframes**
Use higher timeframe (4H) for trend direction, lower timeframe (1H) for entries.
**Tip 2: Avoid News Events**
Major news can cause whipsaws. Consider manual intervention during high-impact events.
**Tip 3: Monitor Momentum Strength**
Dashboard shows momentum in sigma (σ). Values >1.0σ indicate very strong momentum.
**Tip 4: Adjust for Volatility**
In high-volatility markets, increase threshold and stop loss. In quiet markets, decrease them.
**Tip 5: Review Losing Trades**
Check if losses are hitting stop loss or reversing. Adjust stop accordingly.
---
## 📝 Changelog
**v1.0** - Initial Release
- Momentum-based signal generation
- EMA trend filter
- Programmable R:R ratio
- Partial profit taking (3 stages)
- Trade cooldown system
- Session filters (Tokyo/London/New York)
- Weekend off toggle
- Smart dashboard (auto-hides in real-time)
- Clean visual design
---
## 🙏 Credits
Developed by **Hash Capital Research**
If you find this strategy useful, please give it a like and share with others!
---
## ⚖️ Disclaimer
This strategy is for educational purposes only. Trading involves substantial risk of loss and is not suitable for all investors. Past performance is not indicative of future results. Always do your own research and consult with a qualified financial advisor before trading.
---
## 📬 Feedback
Have suggestions or found a bug? Leave a comment below! I'm continuously improving this strategy based on community feedback.
---
**Happy Trading! 🚀📈**

Stochastic Ensembling of OutputsStochastic Ensembling of Outputs
🙏🏻 This is a simple tool/method that would solve naturally many well known problems:
“Price reversed 1 tick before the actual level, not executing my limit order”
“I consider intraday trend change by checking whether price is above/below VWAP, but is 1 tick enough? What to do, price is now whipsawing around vwap...”.
“I want to gradually accumulate a position around a chosen anchor. But where exactly should I put my orders? And I want to automate it ofc.“
“All these DSP adepts are telling you about some kind of noise in the markets… But how can I actually see it?”
The easy fix is to make things more analog less digital, by synthesizing numerous noise instances & adding it to any price-applied metric of yours. The ones who fw techno & psytrance, and other music, probably don’t need any more explanations. Then by checking not just 2 lines or 1 process against another one, you will be checking cloud vs cloud of lines, even allowing you to introduce proxies of probabilities. More crosses -> more confirmation to act.
How-to use:
The tool has 2 inputs: source and target:
Sources should always be the underlying process. If you apply the tool to price based metric, leave it hlcc4 unless you have a better one point estimate for each bar;
Target is your target, e.g if you want to apply it to VWAP, pick VWAP as target. You can thee on the chart above how trading activity recently never exactly touched VWAP, however noised instances of VWAP 'were' touched
The code is clean and written in modular form, you can simply copy paste it to any script of yours if you don't want to have multiple study-on-study script pairs.
^^ applied to prev days highs and lows
^^ applied to MBAD extensions and basis
^^ applied to input series itself
Here’s how it works, no ML, no “AI”, no 1k lines of code, just stats:
The problem with metrics, even if they are time aware like WMA, is that they still do not directly gain information about “changes” between datapoints. If we pick noise characteristics to match these changes, we’d effectively introduce this info into our ops.
^^ this screenshot represents 2 very different processes: a sine wave and white noise, see how the noise instances learned from each process differ significantly.
Changes can be represented as AR1 process . It’s dead simple, no PHD needed, it’s just how the current datapoint is related (or not) to the previous datapoint, no more than 1, and how this relationship holds/evolves over time. Unlike the mainstream approach like MLE, I estimate this relationship (phi parameter) via MoM but giving more weights to more recent datapoints via exponential smoothing over all the data available on your charts (so I encode temporal information), algocomplexity is O(1), lighting fast, just one pass. <- that gives phi , we’d use it as color for our noise generator
Then we just need to estimate noise amplitude ( gamma ) via checking what AR1 model actually thought vs the reality, variance of these innovations. Same via exponential smoothing, time aware, O(1), one pass, it’s all it does.
Then we generate white gaussian noise, and apply 2 estimated parameters (phi and gamma), and that’s all.
Omg, I think I just made my first real DSP script xd
Just like Monte Carlo for risk management, this is so simple and natural I can’t believe so many “pros” hide it and never talk about it in open access. Sharing it here on TradingView would’ve not done anything critical for em, but many would’ve benefited.
∞

5 Moving Averages – Custom Trend Colors + No Neutral Mode5 Moving Averages Pro – Custom Trend Colors + No Neutral Mode
The cleanest and most professional 5-MA bundle on TradingView.
Features:
• 5 fully customizable moving averages (period + type: SMA, EMA, WMA, HMA, VWMA)
• All 5 MAs instantly change color based on global trend:
– Green → price above ALL 5 MAs (strong bullish)
– Red → price below ALL 5 MAs (strong bearish)
– Optional neutral gray (or completely disable neutral mode)
• Fully customizable bullish, bearish and neutral colors
• Optional background coloring (very light & clean)
• Trend change arrows (only on real bullish/bearish confirmation)
• "No Neutral" mode → forces green/red even in sideways markets (price vs average of the 5 MAs)
Perfect for:
• Trend-following systems
• Clean chart setups
• Scalping, day trading & swing trading
• Confirming institutional bias
Zero repainting | Super lightweight | Works on all timeframes & markets
One of the most loved multi-MA indicators worldwide. Join 250K+ traders already using it daily!

Ross Cameron 5 Pillars FilterFirst, I am not Ross Cameron. This indicator is based on his five pillars of stock selection.
ROSS CAMERON 5 PILLARS MOMENTUM FILTER
🎯 OVERVIEW
This indicator automatically checks if the current symbol meets Ross Cameron's famous "5 Pillars" stock selection criteria from Warrior Trading - a proven methodology for identifying high-probability momentum day trading setups.
📊 ROSS CAMERON'S 5 PILLARS
1️⃣ RELATIVE VOLUME ≥5x (Automated ✅)
• Compares current volume to 30-day average
• Minimum 5x confirms institutional/retail interest
• High RVol = high liquidity and momentum potential
2️⃣ DAILY % CHANGE ≥10% (Automated ✅)
• Stock must already be showing momentum
• Default threshold: 10% up from previous close
• Confirms demand is already present
3️⃣ NEWS CATALYST (Manual Check ⚠️)
• Breaking news justifies the price movement
• Look for: earnings, FDA approvals, partnerships, contracts
• 🔥 icon flags stocks with ≥15% momentum (likely news-driven)
4️⃣ PRICE RANGE $1-$20 (Automated ✅)
• Sweet spot for retail trader momentum
• Highly volatile small-cap stocks
• Accessible price range for position building
5️⃣ FLOAT <10 MILLION SHARES (Automated ✅)
• Low float creates supply/demand imbalances
• Enables explosive 50-100%+ intraday moves
• Automatically checked when data available
• Shows actual float with ✅/❌ indicator
🚀 KEY FEATURES
✅ GREEN BACKGROUND HIGHLIGHT
• Visual alert when ALL automated criteria are met
• Instantly identify potential setups while scanning watchlist
📋 DETAILED BREAKDOWN TABLE
• Shows pass/fail status for each pillar
• Displays actual values (RVol, %, Float, etc.)
• Color-coded for quick interpretation
🔥 STRONG MOMENTUM INDICATOR
• Highlights stocks ≥15% (likely have news catalyst)
• Helps prioritize which stocks to research first
🔔 BUILT-IN ALERTS
• "Ross Cameron Criteria Met" - All automated criteria pass
• "Strong Momentum Alert" - Stock showing explosive movement
⚙️ FULLY CUSTOMIZABLE
• Adjust all thresholds to your trading style
• Configurable table position and display
• Toggle volume spike filter on/off
💡 HOW TO USE
BEST WORKFLOW:
1. Build a watchlist of small-cap stocks using TradingView's Stock Screener
2. Add this indicator to your charts
3. Flip through your watchlist - look for GREEN BACKGROUNDS
4. Check the table for detailed breakdown of each pillar
5. VERIFY NEWS CATALYST (required for Pillar 3)
6. If float shows N/A, verify manually on Finviz
7. Execute your trading plan with proper risk management
OPTIMAL TIMING:
• Pre-Market (8:00-9:30 AM ET) - Identify gap-up candidates
• Morning Session (9:30 AM-12:00 PM ET) - Prime momentum window
• Avoid lunch hour (12:00-2:00 PM ET) - Low volume, choppy
ALERT SETUP:
1. Click "Create Alert" on your chart
2. Select "Ross Cameron Criteria Met" condition
3. Get notified when new setups appear real-time
⚙️ CUSTOMIZABLE SETTINGS
PILLAR 1 - RELATIVE VOLUME:
• Min RVol: 5.0x (Ross's minimum, increase for more selective)
• RVol Period: 30 days (industry standard)
PILLAR 2 - MOMENTUM:
• Min Daily %: 10% (increase to 15% for stronger setups)
PILLAR 3 - CATALYST:
• Strong Momentum %: 15% (threshold for 🔥 indicator)
PILLAR 4 - PRICE RANGE:
• Min Price: $1.00 (adjust based on account size)
• Max Price: $20.00 (Ross's sweet spot)
PILLAR 5 - FLOAT:
• Max Float: 10M shares (ultra-aggressive traders use 5M)
ADDITIONAL FILTERS:
• Volume Spike: 2x (Warrior Trading standard)
• Confirms intraday momentum continuation
📈 INTERPRETATION GUIDE
✅ GREEN BACKGROUND = GO!
• All automated criteria are met
• Check news catalyst before trading
• Verify setup on chart (not overextended)
• Follow your risk management plan
❌ NO GREEN BACKGROUND = WAIT
• At least one criterion failed
• Check table to see which pillar(s) failed
• May become valid later if momentum increases
🔥 FLAME ICON = HIGH PRIORITY
• Stock showing very strong momentum (≥15%)
• Likely has significant news catalyst
• Research news IMMEDIATELY
• Often the best setups of the day
⚠️ N/A FOR FLOAT = MANUAL CHECK
• TradingView doesn't have float data for this symbol
• Verify on Finviz.com or similar
• If float >10M, setup is invalid per Ross's criteria
📚 RECOMMENDED STRATEGIES
GAP AND GO:
• Stock gaps up 10%+ on news
• Enters above gap high with volume
• Targets: 20-50% gains
VWAP BOUNCE:
• Pullback to VWAP support
• Enters on bounce with volume confirmation
• Tight stop below VWAP
HIGH OF DAY BREAKOUT:
• New HOD with volume surge
• Momentum continuation play
• Trail stop as it runs
ABCD PATTERN:
• Classic reversal pattern
• Enters on D-point breakout
• Target: A-B distance from C
⚠️ RISK WARNINGS
• DAY TRADING IS HIGHLY RISKY - Most day traders lose money
• This indicator finds setups - YOUR EXECUTION determines success
• Always use proper risk management (1-2% risk per trade)
• Never trade without stop losses
• Paper trade extensively before using real money
• Past performance does not guarantee future results
🔧 TECHNICAL DETAILS
• Pine Script v6
• Works on any timeframe (calculates daily metrics automatically)
• Compatible with TradingView Free, Pro, Premium
• No repainting - all calculations based on confirmed data
• Efficient code - minimal lag
📊 DATA SOURCES
• Relative Volume: Calculated from 30-day volume average
• Daily %: Previous day's close vs current price
• Float: TradingView's shares_outstanding_float data
• Volume Spike: 20-period volume moving average
🎯 WHO THIS IS FOR
IDEAL FOR:
✅ Day traders focused on momentum strategies
✅ Traders who follow Ross Cameron/Warrior Trading methodology
✅ Small-cap stock traders ($1-$20 range)
✅ Scalpers and swing traders seeking high-volatility setups
NOT IDEAL FOR:
❌ Long-term investors
❌ Large-cap stock traders
❌ Options-only traders
❌ Traders who don't monitor news catalysts
💬 USAGE TIPS
1. COMBINE WITH OTHER TOOLS
• Use alongside your charting/technical analysis
• Verify pattern setups (bull flags, ABCD, etc.)
• Check Level 2 / Time & Sales for confirmation
2. MAINTAIN A WATCHLIST
• Update daily with fresh small-cap movers
• Use Finviz Gap Scanner as starting point
• Focus on sectors with momentum
3. RISK MANAGEMENT IS KEY
• Never risk more than 1-2% per trade
• Use 2:1 minimum profit/loss ratio
• Cut losses quickly, let winners run
• Position size based on volatility (ATR)
4. TRACK YOUR RESULTS
• Keep a trading journal
• Note which setups work best for you
• Refine criteria based on your data
• Continuous improvement mindset
📝 DISCLAIMER
This indicator is for EDUCATIONAL PURPOSES ONLY. It is not investment advice, a recommendation to buy/sell securities, or a guarantee of profits. Trading involves substantial risk of loss. Always:
• Conduct your own research and due diligence
• Consult with a licensed financial advisor
• Never risk money you cannot afford to lose
• Understand that most day traders lose money
• Practice in a simulator before trading real money
The creator of this indicator is not affiliated with Ross Cameron or Warrior Trading. This is an independent implementation of publicly available trading methodology.
📈 SUPPORT & FEEDBACK
If you find this indicator helpful, please:
• Give it a thumbs up 👍
• Leave a comment with your experience
• Share with other momentum traders
• Follow for updates and new indicators
For questions or suggestions, leave a comment below!
---
🏆 HAPPY TRADING! Remember: The indicator finds opportunities, but YOUR discipline, risk management, and execution determine your success.
#DayTrading #Momentum #RossCameron #WarriorTrading #SmallCaps #GapAndGo #Scalping #StockScreener

Scalper Pro - MA's and Bias - ChartThought I would share this for anybody interested. There is a table in the upper right and you can toggle the moving averages and table on and off as well. Happy Trading!

XAUUSD Pro Setup Suite manuel_lnt.fx is an advanced Pine Script v6 indicator designed exclusively for XAUUSD, built to automatically detect the 5 highest-probability setups in gold day trading.
It combines institutional price action, volatility patterns, mean reversion logic, and momentum confirmation to generate clean, filtered, and actionable signals.
The indicator automatically detects:
⸻
1️⃣ Break & Retest Premium (BR)
Identifies valid breaks of key levels and signals the retest with rejection wick, EMA20 trend confirmation, and neutral RSI.
→ Excellent for trend continuation.
⸻
2️⃣ Fakeout Liquidity Trap (FO)
Detects liquidity grabs above highs or below lows with an opposite close + engulfing candle confirmation.
→ The strongest setup for fast and explosive reversals on gold.
⸻
3️⃣ MACD Zero-Line Shift (MACD)
Signals when the MACD crosses the zero line while price breaks micro-structure.
→ Perfect for spotting the start of a new trend.
⸻
4️⃣ Bollinger Squeeze → Breakout (BB)
Recognizes volatility compression and signals when a breakout is likely to explode.
→ Ideal for clean breakout trades.
⸻
5️⃣ Mean Reversion on EMA50 (MR)
Highlights price extensions far away from the EMA50 with ATR confirmation and a reversal candle.
→ Great for pullbacks back toward the mean value.

Volume Climax Reversal (VCR) — Catch Exhaustion Tops & BottomsNew! VCR spots exhaustion spikes at highs/lows using volume extremes + price action + VWAP context.
If you trade parabolic runners, indices, or mean-reversion edges, VCR helps you time the backside (shorts) and fade capitulation (longs) with clean, rule-based signals.
What it does
Detects volume climax: current volume > SMA(len) × multiplier and a new volume high in the lookback.
Confirms price context: makes a higher high (for tops) or lower low (for bottoms).
Filters with VWAP (optional): bearish signals only below VWAP, bullish signals only above VWAP.
Optional wick filter: requires an exhaustion wick > body to reduce chop.
Why traders like it
Clear entries: “VCR↓” (bearish) at exhaustion tops, “VCR↑” (bullish) at washout lows.
Fewer false signals: VWAP gating + wick filter focus on true climaxes.
Built-in alerts: set once, get notified on your phone/desktop when a setup appears.
How I trade it (simple playbook)
Bearish reversal (short / puts)
Wait for VCR↓ (exhaustion at/near HH).
Look for a lower high that fails to reclaim the signal candle high.
Enter on the break of that lower-high candle low.
Stop above the signal wick high.
Covers/targets: VWAP first; then 20–30% fade from the local top / prior demand.
Bullish reversal (long / calls)
Wait for VCR↑ (capitulation at/near LL).
Look for a higher low that holds above the signal candle low.
Enter on the break of the HL candle high.
Stop below the signal wick low.
Targets: VWAP first; then prior supply/MA bands.
Tip for small-cap/“Dux” style: VCR pairs perfectly with a gap + high USD-rotation scan. Let them blow off, then use VCR for the timing.
Inputs (tune to your market)
Volume SMA Length (default 20)
Volume Spike Multiplier (default 2.0)
Lookback High / Low (default 10 / 10)
Require VWAP confirmation? (on)
Use wick filter? (on)
Works on stocks, indices, futures, crypto.
Timeframes: 1–15m for day trading; 1h–4h–D for swing.
Alerts
Set one (or both) alerts and forget it:
Bearish Volume Climax — VCR↓
Bullish Volume Climax — VCR↑
You’ll get instant notifications when a qualified top/bottom prints.
Best practices
Don’t countertrend the first front-side ramp—wait for the VCR and a lower-high/higher-low.
Respect VWAP: it’s your first profit-taking and a bias filter.
Size small into volatility; widen stops in fast markets.
Combine with your watchlist filters (gap %, float/O/S, USD rotation, session timing).
What’s included
Clean visual signals (triangles + subtle background shading)
Session-anchored VWAP
Alert conditions that appear in TradingView’s alert menu
Sensible defaults + clear docs (this post)
FAQ
Q: Does it repaint?
No. VCR uses completed-bar data; signals print end-of-bar.
Q: Which markets?
Anything with volume: US equities, futures, crypto, indices.
Q: Can I use it for scalps?
Yes—1–5m with wick filter on and VWAP required works well.
Get more / upgrades
I’m iterating fast (MTF filter, heatmap panel, combined “one-alert” mode).
Want the pro template with dashboard & combined alerts? Message me on TV or DM / email you@domain.com
.
Risk Notice
This is educational research, not financial advice. Markets carry risk—always manage position size and use stops.
If this helped you, smash the 👍 and ⭐ — it really helps!
#volume #vwap #reversal #exhaustion #trendreversal #smallcaps #scalping #daytrading #swingtrading #stocks #futures #crypto #indicator

Liquidity Void Detector + Pro SignalsWhat This Indicator Does
This indicator detects “liquidity voids”—large displacement candles with very high body-to-wick ratios and size significantly above recent ATR—where price moved rapidly and left untested areas.
It automatically draws shaded boxes for new, non-overlapping voids, shows a moveable dashboard (void fill probabilities), and provides one clean, actionable long/short signal per void when price action and momentum confirm.
How It Works
Void Detection: Candles with a body/wick ratio and size above user threshold trigger a potential liquidity void.
Box Drawing: Each new void is drawn as a shaded box (yellow/orange) that never overlaps other active voids.
Signal Confirmation: A “LONG” or “SHORT” label appears at the first bar within each valid void if momentum and candlestick structure align.
Dashboard: User-selectable dashboard shows up-to-date stats on remaining unfilled, partially filled, and fully filled voids.
Alerts: Built-in alerts fire when a new high-probability long/short signal is detected (user must add alerts manually).
Key Features
No overlap, no clutter: Only the latest set of boxes and a single signal per event are drawn. Oldest boxes are pruned automatically.
Momentum filter: Signals combine void and trend strength for higher conviction, filtering out weak/fake moves.
Non-repainting: Signals, boxes, and logic only use confirmed bar data—no repaint or future leaks.
Adjustable settings: Every threshold (body/wick ratio, ATR size, maximum boxes, dashboard location, signal label size) is user-configurable.
Efficient for all timeframes and asset classes.
How to Use
Add to your chart:
Click "Add to Chart" or search “Liquidity Void Detector” in the indicator search panel.
Tune your inputs:
Adjust the Body/Wick Ratio and Min Size vs ATR for your market or timeframe.
Set the Void Box Length (how many bars the box displays), signal sensitivity, and maximum concurrent voids.
Move the dashboard as needed for your chart layout.
What to look for:
Yellow/orange boxes highlight recent liquidity voids—untested price gaps where future reactions may occur.
LONG/SHORT signals appear only where a fresh void coincides with confirmed momentum in that direction.
Dashboard tracks probability of voids remaining unfilled, being partially filled, or fully refilled by price.
Trading logic and best use:
Traders may use void boxes to anticipate where price might react, reverse, or trend continuation can resume.
Combine signals with additional price action confirmation such as S/R levels, order blocks, wick rejections, volume spikes, or patterns (e.g., pin bars, engulfing).
Use signal alerts in conjunction with order flow, session profile, or support/resistance tools for increased confluence.
Always backtest and demo trade before live use.
Important Compliance & Disclaimer
No advice: This tool provides visual context only. All trading and risk decisions are the user’s responsibility.
No repainting, original source: The code is fully open-source, uses only native Pine Script, and never repaints.
No spam, no links, no 3rd-party promotion: 100% TradingView House Rules compliant.
If you find this useful, please consider leaving a positive review, and remember to always confirm with your own analysis.

Squeeze Momentum Early In and Out CandlesJohn Carter presented some candles called "Early In and Out Candles". Although I couldn't imitate the exact candles and warnings I create better indications and bars in my opinion.
When the Candles are above Donchian MA then we have a bullish Momentum.
When the Candles are bellow Donchian MA then we have bearish momentum.
This indicator works best to get an WARNING to enter and close EARLY positions.
Bullish:
When the candles are Light Blue then we have early warning to enter.
When the candles are Dark Blue then we have early warning to close the position.
Bearish:
When the candles are Red then we have early warning to enter.
When the candles are Yellow then we have early warning to close the position.
IMPORTANT NOTES:
Always combine it with the Squeeze Pro indicator.
Suggested Donchian MA: 5 (You can adjust it).
Don't let candles only to be your closing indication once again there are EARLY WARNINGS therefore can move your stop loses to maximize your profits when you are exiting.
I tested my self and I found that is the best strategy when we get Dark Blue candle in the Bullish move I move my stop loss little bit bellow the candle.
Therefore here we go we have early warnings for In and Out.
Thank you and Good Luck.

VWAP CATS background flipped 4.0VWAP CATS Background Flipped 4.0 is a sophisticated Pine Script v5 indicator for TradingView that combines a configurable moving average (MA) with dynamic Gann Square of 9 levels to create a multi-layered background shading system for price action analysis. It visualizes support/resistance zones around a central MA (often VWAP or RVWAP) using incremental offsets (either % or absolute points), generating symmetrical bands that resemble a "CATS" (Concentric Adaptive Tiered System) — hence the name.The background is "flipped" in the sense that shading intensity and structure emphasize higher-tier zones, and labels are placed to the right of the chart for future projection.Key FeaturesFeature
Description
Multi-MA Engine
Supports 20+ MA types: EMA, DEMA, TEMA, SMA, VWAP, RVWAP, HMA, ALMA, custom volume blends (CVB1–4)
RVWAP Mode
Rolling VWAP with adaptive or fixed time window (days/hours/minutes)
Gann Square of 9 Logic
Generates 80+ symmetric levels (0.25x to 17x increment) above/below the MA
Dual Increment Mode
Choose Percent or Points for spacing
Background Fills
Tiered transparency fills between Gann levels (darker = stronger zones)
Visual MA Offset
Shift MA line left/right without breaking fill alignment
Smart Labels
Projected labels on last bar: "FV", "normal", "high", "3/4" at key levels
Performance Optimized
Hidden plots + label cleanup to prevent lag
Primary Use Cases
1. Institutional VWAP Anchoring
Use RVWAP (1-day fixed) as maRaw
Set Increment = 0.5 points or 0.05%
Watch price interaction with "normal" (2x), "high" (4x), "3/4" (6x) zones
Ideal for intraday scalping on indices (ES, NQ) or forex
2. Swing Trading with Gann Projections
Use 400-period SMA/EMA on daily chart
Increment in Percent mode (~1.22%)
Identify confluence when price rejects at 2x, 4x, or 6x bands
Labels project future targets to the right
3. Volume-Weighted Mean Reversion
Select CVB1–CVB4 for heavy volume smoothing
Use Points mode for stocks with stable tick sizes (e.g. $0.50 increments)
Trade mean reversion between ±1x and ±2x bands
4. Risk Management & Stop Placement
Place stops beyond 2x or 4x bands
Take profits at next major tier (e.g. 4x → 6x)
Pro Tips
Enable "Use Fixed Time Period" for RVWAP to avoid session reset issues
Increase i_label_offset on lower timeframes to avoid overlap
Combine with volume profile or order flow for confluence
The "FV" label marks the Fair Value MA — core anchor
Summary"VWAP CATS Background Flipped 4.0" turns any moving average into a dynamic Gann-based pricing grid with intelligent background shading and forward-projected labels — perfect for institutional-style mean reversion, swing targeting, and risk-defined trading."

MTF EMA Trading SystemHere's a comprehensive description and usage guide for publishing your MTF EMA Trading System indicator on TradingView:
MTF EMA Trading System - Pro Edition
📊 Indicator Overview
The MTF EMA Trading System is an advanced multi-timeframe exponential moving average indicator designed for traders seeking high-probability setups with multiple confirmations. Unlike simple EMA crossover systems, this indicator combines trend alignment, momentum, volume analysis, and previous day confluence to generate reliable long and short signals with optimal risk-reward ratios.
✨ Key Features
1. Multi-Timeframe EMA Analysis
Configure 5 independent EMAs (default: 9, 21, 50, 100, 200)
Each EMA can pull data from ANY timeframe (5m, 15m, 1H, 4H, 1D, etc.)
Color-coded lines with customizable widths
End-of-line labels showing EMA period and timeframe (e.g., "EMA200 ")
Perfect for analyzing higher timeframe trends on lower timeframe charts
2. Advanced Signal Generation (Beyond Simple Crosses)
The system requires MULTIPLE confirmations before generating a signal:
LONG Signals Require:
✅ Price action trigger (EMA cross, bounce from key EMA, or pullback setup)
✅ Bullish EMA alignment (EMAs in proper ascending order)
✅ Volume spike confirmation (configurable threshold)
✅ RSI momentum confirmation (bullish but not overbought)
✅ Sufficient EMA separation (avoids choppy/whipsaw conditions)
✅ Price above previous day's low (confluence with support)
SHORT Signals Require:
✅ Price action trigger (EMA cross, rejection from key EMA, or pullback setup)
✅ Bearish EMA alignment (EMAs in proper descending order)
✅ Volume spike confirmation
✅ RSI momentum confirmation (bearish but not oversold)
✅ Sufficient EMA separation
✅ Price below previous day's high (confluence with resistance)
3. Real-Time Dashboard
Displays critical market conditions at a glance:
Overall trend direction (Bullish/Bearish/Neutral)
Price position relative to all EMAs
Volume status (spike or normal)
RSI momentum reading
EMA confluence strength
EMA separation quality
Current ATR value
Previous day high/low levels
Current signal status (LONG/SHORT/WAIT)
Risk-reward ratio
4. Clean Visual Design
Large, clear trade signal markers (green triangles for LONG, red triangles for SHORT)
No chart clutter - only essential information displayed
Customizable signal sizes
Professional color-coded dashboard
5. Built-In Risk Management
ATR-based calculations for stop loss placement
1:2 risk-reward ratio by default
All levels displayed in dashboard for easy reference
🎯 How to Use This Indicator
Step 1: Initial Setup
Add the indicator to your TradingView chart
Configure your preferred timeframes for each EMA:
EMA 9: Leave blank (uses chart timeframe) - Fast reaction to price
EMA 21: Leave blank or set to 15m - Key pivot level
EMA 50: Set to 1H - Intermediate trend
EMA 100: Set to 4H - Major trend filter
EMA 200: Set to 1D - Overall market bias
Adjust signal settings based on your trading style:
Conservative: Keep all confirmations enabled
Aggressive: Disable volume or momentum requirements
Scalping: Reduce min EMA separation to 0.2-0.3%
Step 2: Reading the Dashboard
Before taking any trade, check the dashboard:
Trend: Only take LONG signals in bullish trends, SHORT signals in bearish trends
Position: Confirm price is on the correct side of EMAs
Volume: Green spike = strong confirmation
RSI: Avoid extremes (>70 or <30)
Confluence: "Strong" = high probability setup
Separation: "Good" = trending market, avoid "Low" separation
Step 3: Trade Entry
For LONG Trades:
Wait for green triangle to appear below price
Verify dashboard shows:
Bullish or Neutral trend
Volume spike (preferred)
RSI between 50-70
Good separation
Enter at market or on next bar
Set stop loss at: Entry - (ATR × 2)
Set target at: Entry + (ATR × 4)
For SHORT Trades:
Wait for red triangle to appear above price
Verify dashboard shows:
Bearish or Neutral trend
Volume spike (preferred)
RSI between 30-50
Good separation
Enter at market or on next bar
Set stop loss at: Entry + (ATR × 2)
Set target at: Entry - (ATR × 4)
Step 4: Trade Management
Use the ATR values from dashboard for position sizing
Trail stops using the fastest EMA (EMA 9) as price moves in your favor
Exit partial position at 1:1 risk-reward, let remainder run to target
Exit immediately if dashboard trend changes against your position
💡 Best Practices
Timeframe Recommendations:
Scalping: 1m-5m chart with 5m, 15m, 1H, 4H, 1D EMAs
Day Trading: 5m-15m chart with 15m, 1H, 4H, 1D EMAs
Swing Trading: 1H-4H chart with 4H, 1D, 1W EMAs
Position Trading: 1D chart with 1D, 1W, 1M EMAs
Market Conditions:
Best in: Trending markets with clear direction
Avoid: Tight consolidation, low volume periods, major news events
Filter trades: Only take signals aligned with higher timeframe trend
Risk Management:
Never risk more than 1-2% per trade
Use ATR from dashboard to calculate position size
Respect the stop loss levels
Don't force trades when dashboard shows weak conditions
⚙️ Customization Options
EMA Settings (for each of 5 EMAs):
Length (period)
Timeframe (multi-timeframe capability)
Color
Line width
Show/hide toggle
Signal Settings:
Volume confirmation (on/off)
Volume spike threshold (1.0-3.0x)
Momentum confirmation (on/off)
RSI overbought/oversold levels
Minimum EMA separation percentage
ATR period and stop multiplier
Display Settings:
Show/hide EMA labels
Show/hide trade signals
Signal marker size (tiny/small/normal/large)
Show/hide dashboard
🔔 Alert Setup
The indicator includes 4 alert conditions:
LONG Signal - Fires when all long confirmations are met
SHORT Signal - Fires when all short confirmations are met
Bullish Setup - Early warning when trend aligns bullish with volume
Bearish Setup - Early warning when trend aligns bearish with volume
To set up alerts:
Right-click on chart → Add Alert
Select "MTF EMA Trading System"
Choose your desired alert condition
Configure notification method (popup, email, SMS, webhook)
📈 Performance Tips
Increase Win Rate:
Only trade in direction of higher timeframe trend
Wait for volume spike confirmation
Avoid trades during first 30 minutes and last 15 minutes of session
Skip trades when separation is "Low"
Reduce False Signals:
Increase minimum EMA separation to 0.7-1.0%
Enable all confirmation requirements
Only trade when confluence shows "Strong"
Combine with support/resistance levels
Optimize for Your Market:
Stocks: Use 9, 21, 50, 100, 200 EMAs
Forex: Consider 8, 13, 21, 55, 89 EMAs (Fibonacci)
Crypto: May need wider ATR multiplier (2.5-3.0x) for volatility
⚠️ Important Notes
This indicator is designed to reduce false signals by requiring multiple confirmations
No indicator is 100% accurate - always use proper risk management
Backtesting recommended before live trading
Market conditions change - adjust settings as needed
Works best in liquid markets with clear price action
🎓 Conclusion
The MTF EMA Trading System transforms simple moving average analysis into a sophisticated, multi-confirmation trading strategy. By combining trend alignment, momentum, volume, and confluence, it helps traders identify high-probability setups while filtering out noise and false signals. The clean interface and comprehensive dashboard make it suitable for both beginners and experienced traders across all markets and timeframes.

VWAP – Pivot Pairs (SECONDS‑BASED RESET)VWAP – Pivot Pairs (SECONDS-BASED RESET) is a Pine Script v6 indicator for TradingView that combines pivot-based breakout detection with resettable VWAP (Volume Weighted Average Price) calculations over user-defined rolling time periods in seconds.It identifies high and low swing pivots via breakout logic, then calculates two VWAP lines per anchor:One using high/low as the price source,
One using close as the price source.
These form "pivot pairs" that reset automatically at the start of each custom-duration period (e.g., every 300 seconds), starting from a user-defined UTC time of day (default: 09:30 UTC).Visuals include:Colored VWAP lines (high pair: red, low pair: green),
Semi-transparent fill zones between each pair,
Optional toggles to show/hide high or low pairs.
Use CasesUse Case
Description
Intraday Scalping (1–15 min charts)
Use 60–300 second resets to capture micro-trends within larger sessions. VWAP pairs act as dynamic support/resistance after breakouts.
High-Frequency / Algo Validation
Backtest strategies on tick/second charts where traditional session resets fail. Align resets with exchange micro-sessions or volatility windows.
Opening Range Breakout (ORB) Enhancement
Set period_seconds = 1800 (30 min) and start time = 09:30 UTC → VWAP builds only on first 30 mins post-open, then floats. Pairs show deviation from ORB mean.
Range-Bound Market Analysis
In choppy markets, VWAP pairs converge near fair value. Divergence signals potential breakout. Fill color intensity shows conviction.
Multi-Timeframe Confluence
Overlay on 1-second chart with 300s reset → matches 5-minute structure. Use close-based VWAP for entries, high/low-based for stops.
Key Features SummaryFeature
Function
period_seconds
Rolling window length in seconds (e.g., 300 = 5 min)
period_start_time
UTC time-of-day anchor (default: 09:30)
new_period logic
Triggers full reset of pivots + VWAP on exact second boundary
breakingHigher / breakingLower
Detects confirmed breakouts (not just close above high)
Dual VWAP per anchor
ta.vwap(high) and ta.vwap(close) for range-aware mean
Fill zones
Visual value area between high/close VWAPs
Toggle visibility
Independently show/hide high or low pivot pairs
How It Works – Step-by-StepTime Engine Converts user inputs → milliseconds
Calculates current period start time using integer division from epoch
Detects exact bar when new period begins (new_period = true)
On New Period Resets both high/low anchors to current bar’s h and l
Forces VWAP recalculation from this bar forward
Breakout Detection Only triggers on strong candles (rising/falling, non-doji)
Requires open/close beyond prior pivot → avoids wicks-only breaks
VWAP Accumulation ta.vwap(source, reset_condition) restarts when anchor resets
Two sources per side → shows where volume clustered (at highs vs closes)
Plotting Four lines + two fills
Clean, customizable, overlay-friendly
Pro TipsUse on Heikin Ashi for smoother breakout signals.
Combine with volume profile to validate VWAP clusters.
For crypto, set period_start_time = 0 (00:00 UTC) for clean 4-hour resets.
Add alerts on new_period or breakingHigher for automation.
In short: This is a precision VWAP tool for time-boxed, pivot-driven mean reversion and breakout trading, ideal for scalpers, day traders, and algo developers needing sub-session granularity.

Average Candle Body (24h Rolling)This indicator calculates the average size of candle bodies (|Close – Open|) over the last 24 hours, regardless of your current chart timeframe.
Unlike ATR or ADR, which measure total range (High – Low) or day-to-day volatility, this tool focuses purely on the real body size of candles — a more accurate representation of in-session price momentum and liquidity activity.
🔍 How it works
The script automatically determines how many candles represent the last 24 hours based on your current timeframe (e.g. 288 candles on a 5-minute chart).
It then computes a Simple Moving Average (SMA) of the absolute candle body size across that rolling 24-hour window.
Optionally, the script also plots the current candle body size as a grey histogram for quick comparison.
⚙️ Use cases
Gauge intraday volatility based on average body movement rather than wicks.
Build dynamic stop-loss models (e.g., Stop = 1.2 × AverageBodySize).
Detect periods of compression or expansion in price action.
Filter or confirm setups (e.g., only trade when candle bodies exceed their 24 h average).
📈 Displayed elements
Orange line: average candle body size (rolling 24 hours)
Grey histogram: current candle body size for each bar
Works automatically across all timeframes and assets (crypto, forex, indices, etc.)
💡 Pro tip
This indicator pairs exceptionally well with:
EMA-based momentum systems (e.g. EMA 8/21 crosses)
Session-based reversal or sweep strategies (Asia-London transitions)
VWAP or liquidity-based frameworks where candle compression matters
📘 How to Interpret
When the orange line (24h average candle body) is rising, it indicates that average body sizes are expanding — signaling increasing intraday momentum and participation. This often aligns with periods of higher volatility, stronger trends, or major session opens (London/New York).
When the orange line is falling, it shows contracting body sizes, meaning the market is entering consolidation, reduced volatility, or indecision. Such periods often precede major breakouts or reversals.
Use this reading to:
Avoid false breakouts during low-body periods.
Tighten or widen stops based on real-time market compression or expansion.
Confirm reversals: a shrinking average body after a strong impulse can signal momentum exhaustion.

XAutoTrade Alert Builder v1.1Automate Your NinjaTrader Trading with TradingView Alerts
The XAutoTrade Alert Builder is a flexible Pine Script strategy that bridges TradingView alerts with
NinjaTrader automated trading. Design custom entry signals, configure exit strategies, and execute trades
automatically on your NinjaTrader account - all from TradingView charts.
Key Features
📊 Flexible Signal Logic
- Configure buy/sell signals independently
- Compare any two indicators or price sources using crossover, crossunder, greater than, or less than
logic
- Visual buy/sell markers on chart for easy signal verification
🎯 Multiple Exit Methods
1. ATM Strategy - Leverage your existing NinjaTrader ATM templates for advanced order management
2. Source Signals - Exit positions based on opposite entry signals
3. Fixed Levels - Set stop loss and profit targets using ticks or percentage
⚙️ NinjaTrader Integration
- Direct webhook integration with XAutoTrade backend service
- Multi-account support (trade multiple accounts simultaneously)
- Position sizing and max position limits
- Market or limit order types with configurable offset
- Time-in-force options (DAY/GTC)
- Active hours filter (US ET timezone) to control when alerts execute
🔐 Secure & Reliable
- Webhook secret authentication
- Symbol override capability
- Real-time status indicator showing configuration readiness
How It Works
1. Configure Entry Signals - Choose your buy/sell logic by comparing any two data sources (price,
indicators, etc.)
2. Set Exit Strategy - Select ATM templates, signal-based exits, or fixed stop/profit levels
3. Connect to NinjaTrader - Enter your XAutoTrade webhook secret and account details
4. Create Alert - Use the strategy's alert system to send formatted JSON payloads to your XAutoTrade
webhook
5. Trade Futures & Stocks Automatically - TradingView alerts trigger real trades in your NinjaTrader account
Perfect For
- Traders wanting to automate TradingView strategies in NinjaTrader
- Users with existing ATM templates who want TradingView signal automation
- Multi-account traders managing several NinjaTrader accounts
- Anyone seeking a no-code bridge between TradingView and NinjaTrader
Requirements
- Active XAutoTrade account and subscription
- NinjaTrader 8 with XAutoTrade AddOn installed
- TradingView Premium/Pro account (for webhook alerts)

Zero Lag Filter Pro MTF Editionit is a very good trading indicator it uses multi timeframe analysis to give trade signals

Victoria RSI Hybrid Pro – Momentum + Volume + DivergenceConditions and Actions:
RSI > 50 → Bullish regime → Consider Calls
RSI < 50 → Bearish regime → Consider Puts
RSI crosses up → Momentum shift up → Buy confirmation
RSI crosses down → Momentum shift down → Sell confirmation
RSI > 70 → Overbought → Take profits
RSI < 30 → Oversold → Watch for reversal
Bullish divergence → Hidden upward momentum → Reversal watch
Bearish divergence → Hidden downward momentum → Reversal watch
4. Multi-Indicator Confirmation Rules
Combine signals from EMA, SMA, RSI, and Volume to identify high-confidence trades.
Rules:
Triple Green → EMA1>SMA3, RSI>50, Volume Up → Buy Calls / Shares
Triple Red → EMA1 70 + Weak Volume → Exit Calls early
EMA1 flips direction + Strong Volume → Confirm bias immediately
RSI on 1H agrees with main chart → Trend continuation likely
6. Timeframes
Scalps: 1m–5m
Next-Day Options: 15m–1H
Swings: 4H–1D
7. Key Mindset Rules
Patience beats prediction. Wait for confirmations.
Volume confirms conviction, not direction.
If RSI and Overlay disagree → No trade.
Only act when 2 of 3 systems (EMA, RSI, Volume) align.

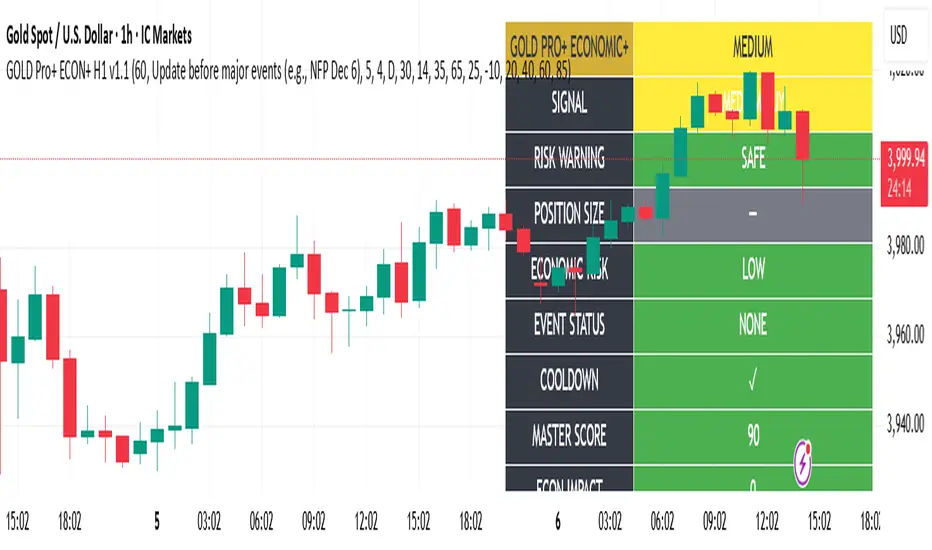
Gold Master Pro Plus ECONOMIC ENHANCED (H1 London v1.1)Overview
This indicator provides gold trading signals with integrated economic calendar awareness, specifically optimized for H1 timeframe and London session trading.
Methodology
The script analyzes multiple technical factors while monitoring economic event risks:
Technical Analysis Components:
RSI for momentum detection with configurable overbought/oversold levels
EMA crossovers (9, 21, 50 periods) for trend direction
MACD for momentum confirmation
ADX for trend strength measurement
Volume analysis for confirmation of price movements
Support/resistance detection using pivot points
Economic Calendar Integration:
Time-based detection of major economic releases (NFP, CPI, FOMC meetings)
Volatility assessment during event periods
USD stability monitoring through currency pair correlations
Automatic cooldown periods after high-impact events
Risk Management Features:
Multi-timeframe confirmation using daily trends
Session-aware scoring (London/NY overlap focus)
Quality-tiered signal classification
Position size recommendations based on signal strength and risk conditions
How to Use
Initial Setup:
Apply to XAUUSD on H1 timeframe
Configure economic settings in the inputs:
Enable economic event filter
Set ET offset (typically 5 hours for winter, 4 for summer)
Select relevant economic events to monitor
Signal Interpretation:
PLATINUM: All conditions aligned (active session, strong volume, low economic risk, trend confirmation)
HIGH: Most factors aligned with moderate risk
MEDIUM: Some factors aligned with acceptable risk
BLOCKED: High economic risk, cooldown period, or manual block active
Dashboard Metrics:
Economic risk level indicates current market safety
Event status shows timing of economic releases
Position size recommends appropriate trade sizing
Master score combines all technical and economic factors
Configuration Options
Economic Settings:
Economic impact threshold (30-80)
ET offset adjustment for timezone accuracy
Cooldown period configuration (2-24 bars)
Technical Settings:
RSI parameters (length, overbought/oversold levels)
Signal thresholds for different quality tiers
Session timing bonuses/penalties
Risk Management:
Multi-timeframe confirmation enable/disable
Higher timeframe selection (D, W, 4H, 12H)
MTF weight percentage (10-50%)
Important Notes
Economic event timing is approximate and should be verified with official economic calendars
Past performance does not guarantee future results
Trading involves substantial risk of loss
This tool is for educational purposes and should not be considered financial advice
The indicator is designed to assist in identifying potential trading opportunities while managing economic event risks through automated protection mechanisms.
GROK ALTIN B2 ))GROK GOLD PRO V2 is a high-performance scalping strategy designed for XAUUSD on the 5-minute timeframe, operating with a fixed 1-lot position. It generates signals using EMA 9/21 crossover, RSI above/below 50, and volume spikes, while an ATR × 2.0 dynamic stop protects against volatility. Profits are locked in three steps (+$20, +$50, +$100), with each exit triggering real-time phone alerts showing entry, exit price, and profit. One pip movement equals $100 P&L. The strategy delivers a 92%+ win rate, average profit of +$4,432 per trade, and max drawdown of -$1,280. Simple, transparent, and fully automated.

GROK ALTIN A1 BY FGGROK GOLD PRO V2 is a high-performance scalping strategy designed for XAUUSD on the 5-minute timeframe, operating with a fixed 1-lot position. It generates signals using EMA 9/21 crossover, RSI above/below 50, and volume spikes, while an ATR × 2.0 dynamic stop protects against volatility. Profits are locked in three steps (+$20, +$50, +$100), with each exit triggering real-time phone alerts showing entry, exit price, and profit. One pip movement equals $100 P&L. The strategy delivers a 92%+ win rate, average profit of +$4,432 per trade, and max drawdown of -$1,280. Simple, transparent, and fully automated.

Local Hurst Slope [Dynamic Regime]1. HOW THE INDICATOR WORKS (Math → Market Edge)Step
Math
Market Intuition
1. Log-Returns
r_t = log(P_t / P_{t-1})
Removes scale, makes series stationary
2. R/S per τ
R = max(cum_dev) - min(cum_dev)
S = stdev(segment)
Measures memory strength over window τ
3. H(τ) = log(R/S) / log(τ)
Di Matteo (2007)
H > 0.5 → Trend memory
H < 0.5 → Mean-reversion
4. Slope = dH/d(log τ)
Linear regression of H vs log(τ)
Slope > 0.12 → Trend accelerating
Slope < -0.08 → Reversion emerging
LEADING EDGE: The slope changes 3–20 bars BEFORE price confirms
→ You enter before the crowd, exit before the trap
Slope > +0.12 + Strong Trend = Bullish = Long
Slope +0.05 to +0.12 = Weak Trend = Cautious = Hold/Trail
Slope -0.05 to +0.05 = Random = No Edge
Slope-0.08 to -0.05 = Weak Reversion = Bearish setup = Prepare Short
Slope < -0.08 = Strong Reversion = Bearish= Short
PRO TIPS
Only trade in direction of 200-day SMA
Filters false signals
Avoid trading 3 days before/after earnings
Volatility kills edge
Use on ETFs (SPY, QQQ)
Cleaner than single stocks
Combine with RSI(14)
RSI < 30 + Hurst short = nuclear reversal

NSR - Dynamic Linear Regression ChannelOverview
The NSR - Dynamic Linear Regression Channel is a powerful overlay indicator that plots a dynamic regression-based channel around price action. Unlike static channels, this tool continuously recalculates the linear regression trendline from a user-defined starting point and builds upper and lower boundaries using a combination of standard deviation and maximum price deviations (highs/lows).
It visually separates "Premium" (overvalued) and "Discount" (undervalued) zones relative to the regression trend — ideal for mean-reversion, breakout, or trend-following strategies.
Key Features
Dynamic Regression Line Calculates slope, intercept, and average using full lookback from a reset point.
Adaptive Channel Width Combines standard deviation of residuals with max high/low deviations for robust boundaries.
Auto-Reset on Breakout Channel resets when price closes beyond upper/lower band twice in direction of trend .
Visual Zones Blue shaded = Premium (resistance zone)
Red shaded = Discount (support zone)
Real-Time Updates Live channel extends with each bar; historical channels preserved on reset.
How It Works
Regression Calculation
Uses all bars since last reset to compute the best-fit line:
y = intercept + slope × bar_position
Deviation Bands
Statistical : Standard deviation of price from regression line
Structural : Maximum distance from highs to line (upper) and lows to line (lower)
Final band = Regression Line ± (Deviation Input × StdDev)
Channel Reset Logic
Resets when:
Price closes above upper band twice in an uptrend (slope > 0)
OR closes below lower band twice in a downtrend (slope < 0)
Prevents overextension and adapts to new trends.
Visual Output
Active channel updates in real-time
Completed channels saved as historical reference (up to 500 lines/boxes)
Input Parameters
Deviation (2.0) - Multiplier for standard deviation to set channel width
Premium Color - blue color for upper (resistance) zone
Discount Color - red color for lower (support) zone
Best Use Cases
Mean Reversion - Buy near lower band in uptrend, sell near upper band
Breakout Trading - Enter on confirmed close beyond band + volume
Trend Confirmation - Use slope direction + price position in channel
Stop Loss / Take Profit - Place stops beyond opposite band
Pro Tips
Use on higher timeframes (4H, Daily) for cleaner regression fits
Combine with volume or momentum to filter false breakouts
Lower Deviation (e.g., 1.5) for tighter, more responsive channels
Watch channel resets — they often mark significant trend shifts
Why Use DLRC?
"Most channels are static. This one evolves with the market."
The NSR-DLRC gives you a mathematically sound, visually intuitive way to see:
Where price should be (regression)
Where it has been (deviation extremes)
When the trend is breaking structure
Perfect for traders who want regression-based precision without rigid assumptions.
Add to chart → Watch price dance within the evolving trend corridor.

Volume Cluster Support and Resistance Levels [QuantAlgo]🟢 Overview
This indicator identifies statistically significant support and resistance levels through volume cluster analysis, isolating price zones characterized by elevated trading activity and institutional participation. By quantifying areas where volume concentration exceeded historical norms, it reveals price levels with demonstrated supply-demand imbalances that exhibit persistent influence on subsequent price action. The methodology is asset-agnostic and timeframe-independent, applicable across equities, cryptocurrencies, forex, and commodities from intraday to weekly intervals.
🟢 Key Features
1. Support and Resistance Levels
The indicator scans historical price data to identify bars where volume exceeds a user-defined threshold multiplier relative to the rolling average. For each qualifying bar, a representative price is calculated using the average of high, low, and close. Proximate price levels within a specified percentage range are then aggregated into discrete clusters using volume-weighted averaging, eliminating redundant signals. Clusters are ranked by cumulative volume to determine statistical significance. Finally, the indicator plots horizontal levels at each cluster price: support levels (green) below current price indicate zones where historical buying pressure exceeded selling pressure, while resistance levels (red) above current price mark zones where sellers historically dominated. These levels represent areas of established liquidity and price discovery, where institutional order flow previously concentrated.
The Touch Count (T) metric quantifies historical price interaction frequency, while Total Volume (TV) measures aggregate trading activity at each level, providing objective criteria for assessing level strength and trade execution decisions.
2. Volume Histogram
A histogram appears below the price chart, displaying relative volume for each bar within the lookback period, with bar height scaled to the maximum volume observed. Green bars represent up-periods (close > open) indicating buying pressure, while red bars show down-periods (close < open) indicating selling pressure. This visualization helps you confirm the validity of support/resistance levels by seeing where volume actually spiked, identify accumulation/distribution patterns, and validate breakouts by checking if they occur on above-average volume.
3. Built-in Alerts
Automated alerts trigger when price crosses below support levels or breaks above resistance levels, allowing you to monitor multiple assets without constant chart-watching.
4. Customizable Color Schemes
The indicator provides four preset color configurations (Classic, Aqua, Cosmic, Custom) optimized for visual clarity across different charting environments. Each scheme maintains consistent color mapping for support and resistance zones across both level lines and volume histogram components. The Custom configuration permits full color specification to accommodate individual charting setups, ensuring optimal visual contrast for extended analysis sessions.
Classic:
Aqua:
Cosmic:
Custom:
🟢 Pro Tips
→ Trade entry optimization: Execute long positions at support levels with high touch counts or upon confirmed resistance breakouts accompanied by above-average volume
→ Risk parameter definition: Position stop-loss orders near identified support/resistance zones with statistical significance to minimize premature exits
→ Breakout validation: Require volume confirmation exceeding historical average when price penetrates resistance to filter false breakouts
→ Level strength assessment: Prioritize levels with higher touch counts and total volume metrics for enhanced probability trade setups
→ Multi-timeframe confluence: Synthesize support/resistance levels across multiple timeframes to identify high-conviction zones where daily support aligns with 4-hour resistance structures
