Vix spread Betting/CFD strategy. Highest profit factor ever?Recently I have noticed that many CFD and spread betting providers (I wont mention which ones but they are easy to find with a quick google search) are letting users "trade" the CBOE Volatility Index ( VIX ). I thought this was unusual as the VIX is not a purchasable asset; it is a measure of implied volatility (both long and short) on the S&P500 calculated through a formula using the price of S&P options. As far as I know the VIX has never been directly tradeable until now, VIX related products like ETFs which attempt to follow the VIX has been available for nearly two decades however they suffer greatly from slippage which makes them difficult to trade.
I am astonished that we are now, for the first time, able to bet on the result of a formula. I think that CFD and spread betting providers have made a mistake, they were probably just looking to add more tradable products and didn't think through fully that the VIX is not like any of their other products, and is much easier to profit from when using a quantitative strategy.
This strategy works live on 4H and daily charts and achieves absolutely ridiculous results. I set it to start with $100 initial capital, and over the course of 465 trades it made $73154339495899.86 profit due to compounding profits. This is a profit factor of 695603.753. I don't expect to earn this much profit myself as I am sure that CFD and spread betting providers will eventually realize that it was a mistake to let traders have positions betting on the outcome of a formula, and eventually stop allowing VIX trades to be placed. I am currently trading using this algorithm, and will maybe let others use this script eventually after I've had my fun. So follow me :)
在腳本中搜尋"profit factor"

The Rocket : Profit Factor [Bradford_Fournier]The Rocket
I hope this helps you as much as it has me.
Suggestions:
Use with tech stocks with reasonably high volatility
Time-frames are flexible but a 1-3month window is best.
REQUEST: If you find this useful, please let me know. I'd like to improve this script further. Any suggestions or encouragement are greatly appreciated
The rocket is based on my Trend Shift Indicator. Please take a look if you haven't yet.

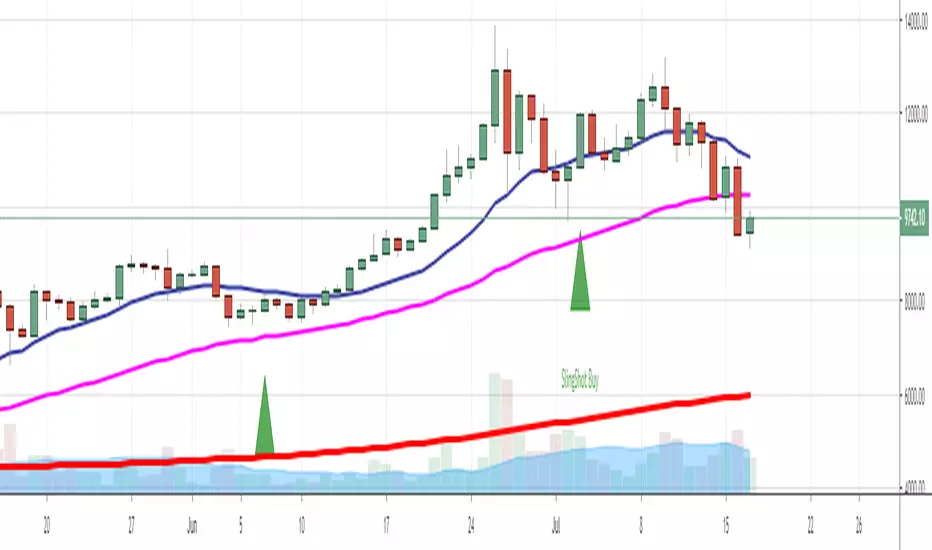
Trade Genius Sling Shot IndicatorOur proprietary reversal indicator with high profit factor, if interested: www.tradelikeagenius.com
AlphaTrend Strategy-Dexter📌 AlphaTrend Strategy – Brief Description
The AlphaTrend Strategy uses ATR with RSI/MFI filters to build a dynamic trend line.
Buy when AlphaTrend crosses above its past value (trend up).
Sell when AlphaTrend crosses below its past value (trend down).
Works as a trend-following system, but can whipsaw in sideways markets.
📊 Backtest Summary (Nifty 50, 10-min TF)
Period: Aug 19, 2024 – Sep 11, 2025
Metric Value
Total P&L ₹5,595.65 (+0.56%)
Total Trades 230
Win Rate 42.61%
Profit Factor 1.40
Max Equity Drawdown ₹1,704.15 (0.17%)
Sharpe Ratio -1.80 ❌
Sortino Ratio -0.87 ❌
⚠️ Observations & Risks
Profit Factor > 1 → profitable but thin edge.
Negative Sharpe & Sortino → risk-adjusted performance is poor (high volatility, low consistency).
Low Win Rate (42%) → depends heavily on a few big winners.
No Stop Loss / Take Profit → exposes account to streaks of losses.
Works better in trending markets, fails in choppy/sideways conditions.
✅ Caution: The system makes money on paper, but the risk profile is weak. Use strict money management and additional filters (higher timeframe trend or volume confirmation) before considering it live.

888 BOT #backtest█ 888 BOT #backtest
This is an Expert Advisor 'EA' or Automated trading script for ‘longs’ and ‘shorts’, which uses only a Take Profit or, in the worst case, a Stop Loss to close the trade.
It's a much improved version of the previous ‘Repanocha’. It doesn`t use 'Trailing Stop' or 'security()' functions (although using a security function doesn`t mean that the script repaints) and all signals are confirmed, therefore the script doesn`t repaint in alert mode and is accurate in backtest mode.
Apart from the previous indicators, some more and other functions have been added for Stop-Loss, re-entry and leverage.
It uses 8 indicators, (many of you already know what they are, but in case there is someone new), these are the following:
1. Jurik Moving Average
It's a moving average created by Mark Jurik for professionals which eliminates the 'lag' or delay of the signal. It's better than other moving averages like EMA, DEMA, AMA or T3.
There are two ways to decrease noise using JMA. Increasing the 'LENGTH' parameter will cause JMA to move more slowly and therefore reduce noise at the expense of adding 'lag'
The 'JMA LENGTH', 'PHASE' and 'POWER' parameters offer a way to select the optimal balance between 'lag' and over boost.
Green: Bullish, Red: Bearish.
2. Range filter
Created by Donovan Wall, its function is to filter or eliminate noise and to better determine the price trend in the short term.
First, a uniform average price range 'SAMPLING PERIOD' is calculated for the filter base and multiplied by a specific quantity 'RANGE MULTIPLIER'.
The filter is then calculated by adjusting price movements that do not exceed the specified range.
Finally, the target ranges are plotted to show the prices that will trigger the filter movement.
Green: Bullish, Red: Bearish.
3. Average Directional Index (ADX Classic) and (ADX Masanakamura)
It's an indicator designed by Welles Wilder to measure the strength and direction of the market trend. The price movement is strong when the ADX has a positive slope and is above a certain minimum level 'ADX THRESHOLD' and for a given period 'ADX LENGTH'.
The green color of the bars indicates that the trend is bullish and that the ADX is above the level established by the threshold.
The red color of the bars indicates that the trend is down and that the ADX is above the threshold level.
The orange color of the bars indicates that the price is not strong and will surely lateralize.
You can choose between the classic option and the one created by a certain 'Masanakamura'. The main difference between the two is that in the first it uses RMA () and in the second SMA () in its calculation.
4. Parabolic SAR
This indicator, also created by Welles Wilder, places points that help define a trend. The Parabolic SAR can follow the price above or below, the peculiarity that it offers is that when the price touches the indicator, it jumps to the other side of the price (if the Parabolic SAR was below the price it jumps up and vice versa) to a distance predetermined by the indicator. At this time the indicator continues to follow the price, reducing the distance with each candle until it is finally touched again by the price and the process starts again. This procedure explains the name of the indicator: the Parabolic SAR follows the price generating a characteristic parabolic shape, when the price touches it, stops and turns (SAR is the acronym for 'stop and reverse'), giving rise to a new cycle. When the points are below the price, the trend is up, while the points above the price indicate a downward trend.
5. RSI with Volume
This indicator was created by LazyBear from the popular RSI.
The RSI is an oscillator-type indicator used in technical analysis and also created by Welles Wilder that shows the strength of the price by comparing individual movements up or down in successive closing prices.
LazyBear added a volume parameter that makes it more accurate to the market movement.
A good way to use RSI is by considering the 50 'RSI CENTER LINE' centerline. When the oscillator is above, the trend is bullish and when it is below, the trend is bearish.
6. Moving Average Convergence Divergence (MACD) and (MAC-Z)
It was created by Gerald Appel. Subsequently, the histogram was added to anticipate the crossing of MA. Broadly speaking, we can say that the MACD is an oscillator consisting of two moving averages that rotate around the zero line. The MACD line is the difference between a short moving average 'MACD FAST MA LENGTH' and a long moving average 'MACD SLOW MA LENGTH'. It's an indicator that allows us to have a reference on the trend of the asset on which it is operating, thus generating market entry and exit signals.
We can talk about a bull market when the MACD histogram is above the zero line, along with the signal line, while we are talking about a bear market when the MACD histogram is below the zero line.
There is the option of using the MAC-Z indicator created by LazyBear, which according to its author is more effective, by using the parameter VWAP (volume weighted average price) 'Z-VWAP LENGTH' together with a standard deviation 'STDEV LENGTH' in its calculation.
7. Volume Condition
Volume indicates the number of participants in this war between bulls and bears, the more volume the more likely the price will move in favor of the trend. A low trading volume indicates a lower number of participants and interest in the instrument in question. Low volumes may reveal weakness behind a price movement.
With this condition, those signals whose volume is less than the volume SMA for a period 'SMA VOLUME LENGTH' multiplied by a factor 'VOLUME FACTOR' are filtered. In addition, it determines the leverage used, the more volume, the more participants, the more probability that the price will move in our favor, that is, we can use more leverage. The leverage in this script is determined by how many times the volume is above the SMA line.
The maximum leverage is 8.
8. Bollinger Bands
This indicator was created by John Bollinger and consists of three bands that are drawn superimposed on the price evolution graph.
The central band is a moving average, normally a simple moving average calculated with 20 periods is used. ('BB LENGTH' Number of periods of the moving average)
The upper band is calculated by adding the value of the simple moving average X times the standard deviation of the moving average. ('BB MULTIPLIER' Number of times the standard deviation of the moving average)
The lower band is calculated by subtracting the simple moving average X times the standard deviation of the moving average.
the band between the upper and lower bands contains, statistically, almost 90% of the possible price variations, which means that any movement of the price outside the bands has special relevance.
In practical terms, Bollinger bands behave as if they were an elastic band so that, if the price touches them, it has a high probability of bouncing.
Sometimes, after the entry order is filled, the price is returned to the opposite side. If price touch the Bollinger band in the same previous conditions, another order is filled in the same direction of the position to improve the average entry price, (% MINIMUM BETTER PRICE ': Minimum price for the re-entry to be executed and that is better than the price of the previous position in a given %) in this way we give the trade a chance that the Take Profit is executed before. The downside is that the position is doubled in size. 'ACTIVATE DIVIDE TP': Divide the size of the TP in half. More probability of the trade closing but less profit.
█ STOP LOSS and RISK MANAGEMENT.
A good risk management is what can make your equity go up or be liquidated.
The % risk is the percentage of our capital that we are willing to lose by operation. This is recommended to be between 1-5%.
% Risk: (% Stop Loss x % Equity per trade x Leverage) / 100
First the strategy is calculated with Stop Loss, then the risk per operation is determined and from there, the amount per operation is calculated and not vice versa.
In this script you can use a normal Stop Loss or one according to the ATR. Also activate the option to trigger it earlier if the risk percentage is reached. '% RISK ALLOWED'
'STOP LOSS CONFIRMED': The Stop Loss is only activated if the closing of the previous bar is in the loss limit condition. It's useful to prevent the SL from triggering when they do a ‘pump’ to sweep Stops and then return the price to the previous state.
█ BACKTEST
The objective of the Backtest is to evaluate the effectiveness of our strategy. A good Backtest is determined by some parameters such as:
- RECOVERY FACTOR: It consists of dividing the 'net profit' by the 'drawdown’. An excellent trading system has a recovery factor of 10 or more; that is, it generates 10 times more net profit than drawdown.
- PROFIT FACTOR: The ‘Profit Factor’ is another popular measure of system performance. It's as simple as dividing what win trades earn by what loser trades lose. If the strategy is profitable then by definition the 'Profit Factor' is going to be greater than 1. Strategies that are not profitable produce profit factors less than one. A good system has a profit factor of 2 or more. The good thing about the ‘Profit Factor’ is that it tells us what we are going to earn for each dollar we lose. A profit factor of 2.5 tells us that for every dollar we lose operating we will earn 2.5.
- SHARPE: (Return system - Return without risk) / Deviation of returns.
When the variations of gains and losses are very high, the deviation is very high and that leads to a very poor ‘Sharpe’ ratio. If the operations are very close to the average (little deviation) the result is a fairly high 'Sharpe' ratio. If a strategy has a 'Sharpe' ratio greater than 1 it is a good strategy. If it has a 'Sharpe' ratio greater than 2, it is excellent. If it has a ‘Sharpe’ ratio less than 1 then we don't know if it is good or bad, we have to look at other parameters.
- MATHEMATICAL EXPECTATION: (% winning trades X average profit) + (% losing trades X average loss).
To earn money with a Trading system, it is not necessary to win all the operations, what is really important is the final result of the operation. A Trading system has to have positive mathematical expectation as is the case with this script: ME = (0.87 x 30.74$) - (0.13 x 56.16$) = (26.74 - 7.30) = 19.44$ > 0
The game of roulette, for example, has negative mathematical expectation for the player, it can have positive winning streaks, but in the long term, if you continue playing you will end up losing, and casinos know this very well.
PARAMETERS
'BACKTEST DAYS': Number of days back of historical data for the calculation of the Backtest.
'ENTRY TYPE': For '% EQUITY' if you have $ 10,000 of capital and select 7.5%, for example, your entry would be $ 750 without leverage. If you select CONTRACTS for the 'BTCUSDT' pair, for example, it would be the amount in 'Bitcoins' and if you select 'CASH' it would be the amount in $ dollars.
'QUANTITY (LEVERAGE 1X)': The amount for an entry with X1 leverage according to the previous section.
'MAXIMUM LEVERAGE': It's the maximum allowed multiplier of the quantity entered in the previous section according to the volume condition.
The settings are for Bitcoin at Binance Futures (BTC: USDTPERP) in 30 minutes.
For other pairs and other timeframes, the settings have to be adjusted again. And within a month, the settings will be different because we all know the market and the trend are changing.
█ 888 BOT (SPANISH)
Este es un Expert Advisor 'EA' o script de trading automatizado para ‘longs’ y ‘shorts’, el cual, utiliza solo un Take Profit o, en el peor de los casos, un Stop Loss para cerrar el trade.
Es una versión muy mejorada del anterior ‘Repanocha’. No utiliza ‘Trailing Stop’, ni funciones ‘security()’ (aunque usar una función security no significa que el script repinte) y todas las señales son confirmadas, por consiguiente, el script no repinta en modo alertas y es preciso en en el modo backtest.
Aparte de los anteriores indicadores se han añadido algunos más y otras funciones para Stop-Loss, de re-entrada y apalancamiento.
Utiliza 8 indicadores, (muchos ya sabéis sobradamente lo que son, pero por si hay alguien nuevo), son los siguientes:
1. Jurik Moving Average
Es una media móvil creada por Mark Jurik para profesionales la cual elimina el ‘lag’ o retardo de la señal. Es mejor que otras medias móviles como la EMA, DEMA, AMA o T3.
Hay dos formas de disminuir el ruido utilizando JMA. El aumento del parámetro 'LENGTH' hará que JMA se mueva más lentamente y, por lo tanto, reducirá el ruido a expensas de añadir ‘lag’
Los parámetros 'JMA LENGTH', 'PHASE' y 'POWER' ofrecen una forma de seleccionar el equilibrio óptimo entre ‘lag’ y sobre impulso.
Verde : Alcista, Rojo: Bajista.
2. Range filter
Creado por Donovan Wall, su función es la de filtrar o eliminar el ruido y poder determinar mejor la tendencia del precio a corto plazo.
Primero, se calcula un rango de precio promedio uniforme 'SAMPLING PERIOD' para la base del filtro y se multiplica por una cantidad específica 'RANGE MULTIPLIER'.
A continuación, el filtro se calcula ajustando los movimientos de precios que no exceden el rango especificado.
Por último, los rangos objetivo se trazan para mostrar los precios que activarán el movimiento del filtro.
Verde : Alcista, Rojo: Bajista.
3. Average Directional Index (ADX Classic) y (ADX Masanakamura)
Es un indicador diseñado por Welles Wilder para medir la fuerza y dirección de la tendencia del mercado. El movimiento del precio tiene fuerza cuando el ADX tiene pendiente positiva y está por encima de cierto nivel mínimo 'ADX THRESHOLD' y para un periodo dado 'ADX LENGTH'.
El color verde de las barras indica que la tendencia es alcista y que el ADX está por encima del nivel establecido por el threshold.
El color Rojo de las barras indica que la tendencia es bajista y que el ADX está por encima del nivel de threshold.
El color naranja de las barras indica que el precio no tiene fuerza y seguramente lateralizará.
Se puede elegir entre la opción clásica y la creada por un tal 'Masanakamura'. La diferencia principal entre los dos es que en el primero utiliza RMA() y en el segundo SMA() en su cálculo.
4. Parabolic SAR
Este indicador, creado también por Welles Wilder, coloca puntos que ayudan a definir una tendencia. El Parabolic SAR puede seguir al precio por encima o por debajo, la particularidad que ofrece es que cuando el precio toca al indicador, este salta al otro lado del precio (si el Parabolic SAR estaba por debajo del precio salta arriba y viceversa) a una distancia predeterminada por el indicador. En este momento el indicador vuelve a seguir al precio, reduciendo la distancia con cada vela hasta que finalmente es tocado otra vez por el precio y se vuelve a iniciar el proceso. Este procedimiento explica el nombre del indicador: el Parabolic SAR va siguiendo al precio generando una característica forma parabólica, cuando el precio lo toca, se para y da la vuelta (SAR son las siglas en inglés de ‘stop and reverse’), dando lugar a un nuevo ciclo. Cuando los puntos están por debajo del precio, la tendencia es alcista, mientras que los puntos por encima del precio indica una tendencia bajista.
5. RSI with Volume
Este indicador lo creo un tal LazyBear de TV a partir del popular RSI.
El RSI es un indicador tipo oscilador utilizado en análisis técnico y creado también por Welles Wilder que muestra la fuerza del precio mediante la comparación de los movimientos individuales al alza o a la baja de los sucesivos precios de cierre.
LazyBear le añadió un parámetro de volumen que lo hace más preciso al movimiento del mercado.
Una buena forma de usar el RSI es teniendo en cuenta la línea central de 50 'RSI CENTER LINE'. Cuando el oscilador está por encima, la tendencia es alcista y cuando está por debajo la tendencia es bajista.
6. Moving Average Convergence Divergence (MACD) y (MAC-Z)
Fue creado por Gerald Appel. Posteriormente se añadió el histograma para anticipar el cruce de medias. A grandes rasgos podemos decir que el MACD es un oscilador consistente en dos medias móviles que van girando en torno a la línea de cero. La línea del MACD no es más que la diferencia entre una media móvil corta 'MACD FAST MA LENGTH' y una media móvil larga 'MACD SLOW MA LENGTH'. Es un indicador que nos permite tener una referencia sobre la tendencia del activo sobre el cual se está operando, generando de este modo señales de entrada y salida del mercado.
Podemos hablar de mercado alcista cuando el histograma del MACD se sitúe por encima de la línea cero, junto con la línea de señal, mientras que hablaremos de mercado bajista cuando el histograma MACD se situará por debajo de la línea cero.
Está la opción de utilizar el indicador MAC-Z creado por LazyBear que según su autor es más eficaz, por utilizar el parámetro VWAP (precio medio ponderado por volumen) 'Z-VWAP LENGTH' junto con una desviación standard 'STDEV LENGTH' en su cálculo.
7. Volume Condition
El volumen indica el número de participantes en esta guerra entre toros y osos, cuanto más volumen más probabilidad de que se mueva el precio a favor de la tendencia. Un volumen bajo de negociación indica un menor número de participantes e interés por el instrumento en cuestión. Los bajos volúmenes pueden revelar debilidad detrás de un movimiento de precios.
Con esta condición se filtran aquellas señales cuyo volumen es inferior a la SMA de volumen para un periodo 'SMA VOLUME LENGTH' multiplicado por un factor 'VOLUME FACTOR'. Además, determina el apalancamiento utilizado, a más volumen, más participantes, más probabilidad de que se mueva el precio a nuestro favor, es decir, podemos utilizar más apalancamiento. El apalancamiento en este script lo determina las veces que está el volumen por encima de la línea de la SMA.
El apalancamiento máximo es de 8.
8. Bollinger Bands
Este indicador fue creado por John Bollinger y consiste en tres bandas que se dibujan superpuestas al gráfico de evolución del precio.
La banda central es una media móvil, normalmente se emplea una media móvil simple calculada con 20 períodos. ('BB LENGTH' Número de periodos de la media móvil)
La banda superior se calcula sumando al valor de la media móvil simple X veces la desviación típica de la media móvil. ('BB MULTIPLIER' Número de veces la desviación típica de la media móvil)
La banda inferior de calcula restando a la media móvil simple X veces la desviación típica de la media móvil.
la franja comprendida entre las bandas superior e inferior contiene, estadísticamente, casi un 90% de las posibles variaciones del precio, lo que significa que cualquier movimiento del precio fuera de las bandas tiene especial relevancia.
En términos prácticos, las bandas de Bollinger se comporta como si de una banda elástica se tratara de manera que, si el precio las toca, éste tiene mucha probabilidad de rebotar.
En ocasiones, después de rellenarse la orden de entrada, el precio se devuelve hacia el lado contrario. Si toca la banda de Bollinger se rellena otra orden en la misma dirección de la posición para mejorar el precio medio de entrada, (% MINIMUM BETTER PRICE': Precio mínimo para que se ejecute la re-entrada y que sea mejor que el precio de la posición anterior en un % dado) de esta manera damos una oportunidad al trade de que el Take Profit se ejecute antes. La desventaja es que se dobla el tamaño de la posición. 'ACTIVATE DIVIDE TP': Divide el tamaño del TP a la mitad. Más probabilidad de que se cierre el trade pero menos ganancias.
█ STOP LOSS y RISK MANAGEMENT.
Una buena gestión de las pérdidas o gestión del riesgo es lo que puede hacer que tu cuenta suba o se liquide en poco tiempo.
El % de riesgo es el porcentaje de nuestro capital que estamos dispuestos a perder por operación. Este se aconseja que debe estar comprendido entre un 1-5%.
% Risk = (% Stop Loss x % Equity per trade x Leverage) / 100
Primero se calcula la estrategia con Stop Loss, después se determina el riesgo por operación y a partir de ahí se calcula el monto por operación y no al revés.
En este script puedes usar un Stop Loss normal o uno según el ATR. También activar la opción de que salte antes si se alcanza el porcentaje de riesgo. '% RISK ALLOWED'
'STOP LOSS CONFIRMED': Solamente se activa el Stop Loss si el cierre de la barra anterior se encuentra en la condición de límite de pérdidas. Es útil para evitar que se dispare el SL cuando hacen un ‘pump’ para barrer Stops y luego se devuelve el precio a la normalidad.
█ BACKTEST
El objetivo del Backtest es evaluar la eficacia de nuestra estrategia. Un buen Backtest lo determinan algunos parámetros como son:
- RECOVERY FACTOR: Consiste en dividir el ‘beneficio neto’ entre el ‘drawdown’. Un excelente sistema de trading tiene un recovery factor de 10 o más; es decir, genera 10 veces más beneficio neto que drawdown.
- PROFIT FACTOR: El ‘Profit Factor’ es otra medida popular del rendimiento de un sistema. Es algo tan simple como dividir lo que ganan las operaciones con ganancias entre lo que pierden las operaciones con pérdidas. Si la estrategia es rentable entonces por definición el ‘Profit Factor’ va a ser mayor que 1. Las estrategias que no son rentables producen factores de beneficio menores que uno. Un buen sistema tiene un profit factor de 2 o más. Lo bueno del ‘Profit Factor’ es que nos dice lo que vamos a ganar por cada dolar que perdemos. Un profit factor de 2.5 nos dice que por cada dolar que perdamos operando vamos a ganar 2.5.
- SHARPE: (Retorno sistema – Retorno sin riesgo) / Desviación de los retornos.
Cuando las variaciones de ganancias y pérdidas son muy altas, la desviación es muy elevada y eso conlleva un ratio de ‘Sharpe’ muy pobre. Si las operaciones están muy cerca de la media (poca desviación) el resultado es un ratio de ‘Sharpe’ bastante elevado. Si una estrategia tiene un ratio de ‘Sharpe’ mayor que 1 es una buena estrategia. Si tiene un ratio de ‘Sharpe’ mayor que 2, es excelente. Si tiene un ratio de ‘Sharpe’ menor que 1 entonces no sabemos si es buena o mala, hay que mirar otros parámetros.
- MATHEMATICAL EXPECTATION:(% operaciones ganadoras X ganancia media) + (% operaciones perdedoras X pérdida media).
Para ganar dinero con un sistema de Trading, no es necesario ganar todas las operaciones, lo verdaderamente importante es el resultado final de la operativa. Un sistema de Trading tiene que tener esperanza matemática positiva como es el caso de este script.
El juego de la ruleta, por ejemplo, tiene esperanza matemática negativa para el jugador, puede tener rachas positivas de ganancias, pero a la larga, si se sigue jugando se acabará perdiendo, y esto los casinos lo saben muy bien.
PARAMETROS
'BACKTEST DAYS': Número de días atrás de datos históricos para el calculo del Backtest.
'ENTRY TYPE': Para % EQUITY si tienes 10000$ de capital y seleccionas 7.5% tu entrada sería de 750$ sin apalancamiento. Si seleccionas CONTRACTS para el par BTCUSDT sería la cantidad en Bitcoins y si seleccionas CASH sería la cantidad en dólares.
'QUANTITY (LEVERAGE 1X)': La cantidad para una entrada con apalancamiento X! según el apartado anterior.
'MAXIMUM LEVERAGE': Es el máximo multiplicador permitido de la cantidad introducida en el apartado anterior según la condición de volumen.
Los settings son para Bitcoin en Binance Futures (BTC:USDTPERP) en 30 minutos.
Para otro pares y otras temporalidades se tienen que ajustar las opciones de nuevo. Además para dentro de un mes, los ajustes serán otros distintos ya que el mercado y la tendencia es cambiante.

Trendline Breaks with Multi Fibonacci Supertrend StrategyTMFS Strategy: Advanced Trendline Breakouts with Multi-Fibonacci Supertrend
Elevate your algorithmic trading with institutional-grade signal confluence
Strategy Genesis & Evolution
This advanced trading system represents the culmination of a personal research journey, evolving from my custom " Multi Fibonacci Supertrend with Signals " indicator into a comprehensive trading strategy. Built upon the exceptional trendline detection methodology pioneered by LuxAlgo in their " Trendlines with Breaks " indicator, I've engineered a systematic framework that integrates multiple technical factors into a cohesive trading system.
Core Fibonacci Principles
At the heart of this strategy lies the Fibonacci sequence application to volatility measurement:
// Fibonacci-based factors for multiple Supertrend calculations
factor1 = input.float(0.618, 'Factor 1 (Weak/Fibonacci)', minval = 0.01, step = 0.01)
factor2 = input.float(1.618, 'Factor 2 (Medium/Golden Ratio)', minval = 0.01, step = 0.01)
factor3 = input.float(2.618, 'Factor 3 (Strong/Extended Fib)', minval = 0.01, step = 0.01)
These precise Fibonacci ratios create a dynamic volatility envelope that adapts to changing market conditions while maintaining mathematical harmony with natural price movements.
Dynamic Trendline Detection
The strategy incorporates LuxAlgo's pioneering approach to trendline detection:
// Pivotal swing detection (inspired by LuxAlgo)
pivot_high = ta.pivothigh(swing_length, swing_length)
pivot_low = ta.pivotlow(swing_length, swing_length)
// Dynamic slope calculation using ATR
slope = atr_value / swing_length * atr_multiplier
// Update trendlines based on pivot detection
if bool(pivot_high)
upper_slope := slope
upper_trendline := pivot_high
else
upper_trendline := nz(upper_trendline) - nz(upper_slope)
This adaptive trendline approach automatically identifies key structural market boundaries, adjusting in real-time to evolving chart patterns.
Breakout State Management
The strategy implements sophisticated state tracking for breakout detection:
// Track breakouts with state variables
var int upper_breakout_state = 0
var int lower_breakout_state = 0
// Update breakout state when price crosses trendlines
upper_breakout_state := bool(pivot_high) ? 0 : close > upper_trendline ? 1 : upper_breakout_state
lower_breakout_state := bool(pivot_low) ? 0 : close < lower_trendline ? 1 : lower_breakout_state
// Detect new breakouts (state transitions)
bool new_upper_breakout = upper_breakout_state > upper_breakout_state
bool new_lower_breakout = lower_breakout_state > lower_breakout_state
This state-based approach enables precise identification of the exact moment when price breaks through a significant trendline.
Multi-Factor Signal Confluence
Entry signals require confirmation from multiple technical factors:
// Define entry conditions with multi-factor confluence
long_entry_condition = enable_long_positions and
upper_breakout_state > upper_breakout_state and // New trendline breakout
di_plus > di_minus and // Bullish DMI confirmation
close > smoothed_trend // Price above Supertrend envelope
// Execute trades only with full confirmation
if long_entry_condition
strategy.entry('L', strategy.long, comment = "LONG")
This strict requirement for confluence significantly reduces false signals and improves the quality of trade entries.
Advanced Risk Management
The strategy includes sophisticated risk controls with multiple methodologies:
// Calculate stop loss based on selected method
get_long_stop_loss_price(base_price) =>
switch stop_loss_method
'PERC' => base_price * (1 - long_stop_loss_percent)
'ATR' => base_price - long_stop_loss_atr_multiplier * entry_atr
'RR' => base_price - (get_long_take_profit_price() - base_price) / long_risk_reward_ratio
=> na
// Implement trailing functionality
strategy.exit(
id = 'Long Take Profit / Stop Loss',
from_entry = 'L',
qty_percent = take_profit_quantity_percent,
limit = trailing_take_profit_enabled ? na : long_take_profit_price,
stop = long_stop_loss_price,
trail_price = trailing_take_profit_enabled ? long_take_profit_price : na,
trail_offset = trailing_take_profit_enabled ? long_trailing_tp_step_ticks : na,
comment = "TP/SL Triggered"
)
This flexible approach adapts to varying market conditions while providing comprehensive downside protection.
Performance Characteristics
Rigorous backtesting demonstrates exceptional capital appreciation potential with impressive risk-adjusted metrics:
Remarkable total return profile (1,517%+)
Strong Sortino ratio (3.691) indicating superior downside risk control
Profit factor of 1.924 across all trades (2.153 for long positions)
Win rate exceeding 35% with balanced distribution across varied market conditions
Institutional Considerations
The strategy architecture addresses execution complexities faced by institutional participants with temporal filtering and date-range capabilities:
// Time Filter settings with flexible timezone support
import jason5480/time_filters/5 as time_filter
src_timezone = input.string(defval = 'Exchange', title = 'Source Timezone')
dst_timezone = input.string(defval = 'Exchange', title = 'Destination Timezone')
// Date range filtering for precise execution windows
use_from_date = input.bool(defval = true, title = 'Enable Start Date')
from_date = input.time(defval = timestamp('01 Jan 2022 00:00'), title = 'Start Date')
// Validate trading permission based on temporal constraints
date_filter_approved = time_filter.is_in_date_range(
use_from_date, from_date, use_to_date, to_date, src_timezone, dst_timezone
)
These capabilities enable precise execution timing and market session optimization critical for larger market participants.
Acknowledgments
Special thanks to LuxAlgo for the pioneering work on trendline detection and breakout identification that inspired elements of this strategy. Their innovative approach to technical analysis provided a valuable foundation upon which I could build my Fibonacci-based methodology.
This strategy is shared under the same Attribution-NonCommercial-ShareAlike 4.0 International (CC BY-NC-SA 4.0) license as LuxAlgo's original work.
Past performance is not indicative of future results. Conduct thorough analysis before implementing any algorithmic strategy.

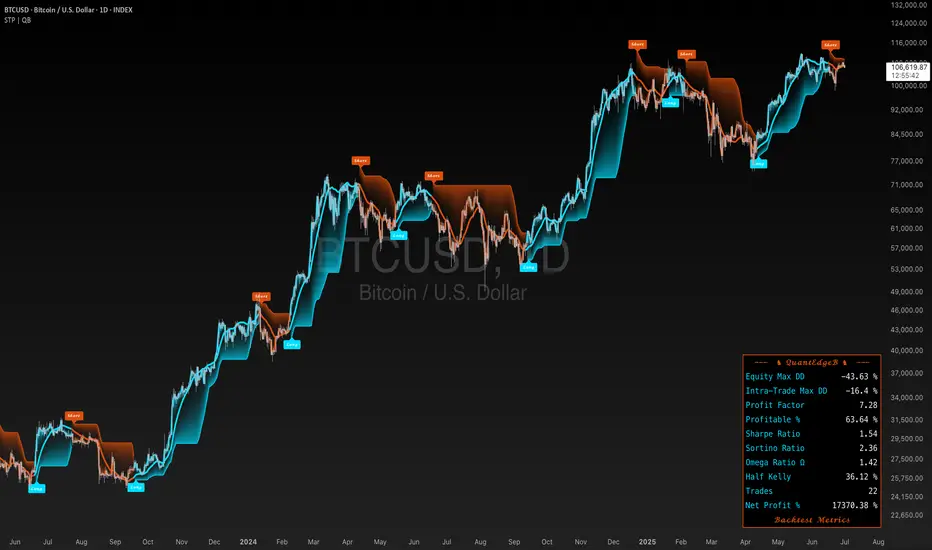
SigmaTrend Prime | QuantEdgeBIntroducing SigmaTrend Prime (STP) by QuantEdgeB
🛠️ Overview
SigmaTrend Prime (STP) is an advanced trend-following indicator that combines double exponential moving averages (DEMA) with a volatility-adjusted SuperTrend framework.
Unlike traditional ATR-based SuperTrends, STP dynamically adjusts trend thresholds using a standard deviation filter derived from price percentiles. This ensures that the trend signals remain highly adaptive, filtering out short-term noise while maintaining robustness across different market conditions.
By leveraging a DEMA core, STP minimizes lag while preserving strong trend identification, making it a powerful tool for traders looking to capture directional moves with enhanced precision.
_____
✨ Key Features
🔹 DEMA-Driven Trend Filtering
SigmaTrend Prime minimizes lag and enhances responsiveness using a double exponential moving average (DEMA) core.
🔹 Volatility-Adaptive SuperTrend
STP applies a percentile-based price smoothing technique, ensuring that the trend filter dynamically adjusts to market conditions.
🔹 Standard Deviation (SD) Filtering for Noise Reduction
By applying a rolling standard deviation derived from smoothed price action, STP eliminates false breakouts and enhances trend clarity.
🔹 Customizable Visual & Signal Settings
Includes multiple color modes, backtest metrics, and signal labels, making it highly adaptable for different trading styles.
📊 How It Works
1️⃣ DEMA-Based Trend Smoothing
SigmaTrend Prime uses DEMA (Double Exponential Moving Average) as its trend foundation, offering a smoother and more responsive trend structure:
🔹 Why DEMA?
✔ Minimizes lag compared to standard EMA.
✔ Maintains trend sensitivity while reducing market noise.
✔ Stronger confirmation of directional moves in volatile environments.
2️⃣ Adaptive Volatility Filtering with Standard Deviation (SD)
Unlike conventional SuperTrend indicators that rely on ATR for trend filtering, SigmaTrend Prime applies an SD-based smoothing mechanism.
📌 How it Works?
✔ Price Percentile Calculation → Uses percentile price ranking for better trend representation.
✔ Rolling Standard Deviation Calculation → Applies a volatility-adjusted filter to prevent false signals.
✔ Dynamic Trend Band Expansion → Factors (Factor1 & Factor2) multipliers to adjust trend sensitivity based on current price behavior.
🔹 Why SD-Based Filtering?
✔ More adaptive to different volatility regimes.
✔ Improves trend accuracy in both trending and ranging markets.
✔ Avoids excessive whipsaws common with ATR-based models.
3️⃣ Signal Generation & Trend Confirmation
SigmaTrend Prime detects trend shifts based on SD-filtered breakouts:
✅ Long Signal → Triggered when price crosses above the SuperTrend upper band.
❌ Short Signal → Triggered when price crosses below the SuperTrend lower band.
📌 Additional Features:
✔ Adaptive Signal Labels → Shows "Long" or "Short" trade signals dynamically.
✔ Trend-Following Mode → Stays in position until a confirmed reversal signal occurs.
✔ Customizable Sensitivity → Traders can adjust Factor1 & Factor2 multipliers and other settings to refine signal responsiveness.
👥 Who Should Use It?
✅ Trend Traders & Momentum Followers → Identify strong directional trends with greater accuracy.
✅ Swing & Position Traders → Gain precise trend confirmation signals for optimized entries/exits.
✅ Volatility-Aware Traders → Benefit from adaptive trend filtering based on real-time market conditions.
✅ Systematic & Quant Traders → Implement STP within automated trading systems for improved trend detection.
⚙️ Customization & Default Settings
🔧 Key Custom Inputs:
• DEMA Source (Default: HLC3) → Defines the price input for DEMA calculations.
• DEMA Length (Default: 30) → Controls the smoothing period for trend calculation.
• Percentile SD Length (Default: 10) → Determines historical percentile ranking for volatility
assessment.
• Volatility SD Length (Default: 30) → Defines rolling SD length for dynamic filtering.
• Trend Sensitivity Factors:
🔹 Factor1 (Default: 25) → Adjusts lower SD band responsiveness.
🔹 Factor2 (Default: 40) → Controls upper SD band expansion.
• Visual Customizations → Multiple color modes, backtest metrics, and trend labels available.
🚀 By default, STP is optimized for adaptive trend-following while remaining flexible for customization.
_____
📌 How to Use SigmaTrend Prime in Trading
1️⃣ Trend-Following Strategy (Momentum Confirmation)
✔ Enter long positions when STP confirms a bullish trend shift above its upper trend band.
✔ Enter short positions when STP confirms a bearish trend shift below its lower trend band.
✔ Stay in trades as long as STP maintains trend direction, filtering out false reversals.
2️⃣ Volatility-Adaptive Strategy (Dynamic Trend Adjustments)
✔ Use Factor1 & Factor2 adjustments to fine-tune STP’s sensitivity to price movements.
✔ Increase Factor1 for slower trend shifts and reduce Factor2 for more aggressive trend detection.
📌 Why?
• In high-volatility conditions, adjust trend bands wider to prevent whipsaws.
• In low-volatility conditions, tighten trend bands for faster signal responsiveness.
_____
📊 Backtest Mode
SigmaTrend Prime includes an optional backtest table, enabling traders to assess its historical effectiveness before applying it in live trading conditions.
🔹 Backtest Metrics Displayed:
• Equity Max Drawdown → Largest historical loss from peak equity.
• Profit Factor → Ratio of total profits to total losses, measuring system efficiency.
• Sharpe Ratio → Assesses risk-adjusted return performance.
• Sortino Ratio → Focuses on downside risk-adjusted returns.
• Omega Ratio → Evaluates return consistency & performance asymmetry.
• Half Kelly → Optimal position sizing based on risk/reward analysis.
• Total Trades & Win Rate → Assess STP’s historical success rate.
📌 Disclaimer:
Backtest results are based on past performance and do not guarantee future success. Always incorporate real-time validation and risk management in live trading.
🚀 Why This Matters?
✅ Strategy Validation → Gain insight into historical trend accuracy.
✅ Customization Insights → See how different STP settings impact performance.
✅ Risk Awareness → Understand potential drawdowns before deploying capital.
_____
📌 Conclusion
SigmaTrend Prime (STP) is an advanced trend-following solution that merges DEMA-based trend smoothing with standard deviation-adaptive filtering. By utilizing percentile-based price smoothing, STP enhances trend accuracy while ensuring that signals remain adaptive to different market environments.
🔹 Key Takeaways:
1️⃣ Lag-Minimized Trend Filtering – DEMA enhances trend responsiveness while reducing noise.
2️⃣ SD-Based Volatility Adaptation – More reliable than ATR-based trend models, reducing false breakouts.
3️⃣ Customizable & Dynamic – Easily fine-tune sensitivity settings for various market conditions.
📌 Master the market with precision and confidence | QuantEdgeB
🔹 Disclaimer: Past performance is not indicative of future results. No trading strategy can guarantee success in financial markets.
🔹 Strategic Advice: Always backtest, optimize, and align parameters with your trading objectives and risk tolerance before live trading.
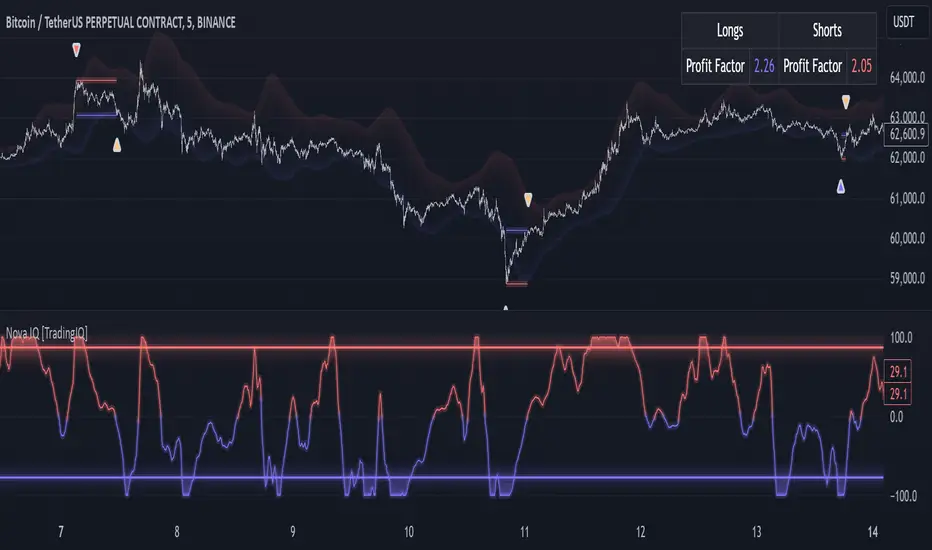
TradingIQ - Nova IQIntroducing "Nova IQ" by TradingIQ
Nova IQ is an exclusive Trading IQ algorithm designed for extended price move scalping. It spots overextended micro price moves and bets against them. In this way, Nova IQ functions similarly to a reversion strategy.
Nova IQ analyzes historical and real-time price data to construct a dynamic trading system adaptable to various asset and timeframe combinations.
Philosophy of Nova IQ
Nova IQ integrates AI with the concept of central-value reversion scalping. On lower timeframes, prices may overextend for small periods of time - which Nova IQ looks to bet against. In this sense, Nova IQ scalps against small, extended price moves on lower timeframes.
Nova IQ is designed to work straight out of the box. In fact, its simplicity requires just one user setting, making it incredibly straightforward to manage.
Use HTF (used to apply a higher timeframe trade filter) is the only setting that controls how Nova IQ works.
Traders don’t have to spend hours adjusting settings and trying to find what works best - Nova IQ handles this on its own.
Key Features of Nova IQ
Self-Learning Market Scalping
Employs AI and IQ Technology to scalp micro price overextensions.
AI-Generated Trading Signals
Provides scalping signals derived from self-learning algorithms.
Comprehensive Trading System
Offers clear entry and exit labels.
Performance Tracking
Records and presents trading performance data, easily accessible for user analysis.
Higher Timeframe Filter
Allows users to implement a higher timeframe trading filter.
Long and Short Trading Capabilities
Supports both long and short positions to trade various market conditions.
Nova Oscillator (NOSC)
The Nova IQ Oscillator (NOSC) is an exclusive self-learning oscillator developed by Trading IQ. Using IQ Technology, the NOSC functions as an all-in-one oscillator for evaluating price overextensions.
Nova Bands (NBANDS)
The Nova Bands (NBANDS) are based on a proprietary calculation and serve as a custom two-layer smoothing filter that uses exponential decay. These bands adaptively smooth prices to identify potential trend retracement opportunities.
How It Works
Nova IQ operates on a simple heuristic: scalp long during micro downside overextensions and short during micro upside overextensions.
What constitutes an "overextension" is defined by IQ Technology, TradingIQ's proprietary AI algorithm. For Nova IQ, this algorithm evaluates the typical extent of micro overextensions before a reversal occurs. By learning from these patterns, Nova IQ adapts to identify and trade future overextensions in a consistent manner.
In essence, Nova IQ learns from price movements within scalping timeframes to pinpoint price areas for capitalizing on the reversal of an overextension.
As a trading system, Nova IQ enters all positions using market orders at the bar’s close. Each trade is exited with a profit-taking limit order and a stop-loss order. Thanks to its self-learning capability, Nova IQ determines the most suitable profit target and stop-loss levels, eliminating the need for the user to adjust any settings.
What classifies as a tradable overextension?
For Nova IQ, tradable overextensions are not manually set but are learned by the system. Nova IQ utilizes NOSC to identify and classify micro overextensions. By analyzing multiple variations of NOSC, along with its consistency in signaling overextensions and its tendency to remain in extreme zones, Nova IQ dynamically adjusts NOSC to determine what constitutes overextension territory for the indicator.
When NOSC reaches the downside overextension zone, long trades become eligible for entry. Conversely, when NOSC reaches the upside overextension zone, short trades become eligible for entry.
The image above illustrates NOSC and explains the corresponding overextension zones
The blue lower line represents the Downside Overextension Zone.
The red upper line represents the Upside Overextension Zone.
Any area between the two deviation points is not considered a tradable price overextension.
When either of the overextension zones are breached, Nova IQ will get to work at determining a trade opportunity.
The image above shows a long position being entered after the Downside Overextension Zone was reached.
The blue line on the price scale shows the AI-calculated profit target for the scalp position. The redline shows the AI-calculated stop loss for the scalp position.
Blue arrows indicate that the strategy entered a long position at the highlighted price level.
Yellow arrows indicate a position was closed.
You can also hover over the trade labels to get more information about the trade—such as the entry price and exit price.
The image above depicts a short position being entered after the Upside Overextension Zone was breached.
The blue line on the price scale shows the AI-calculated profit target for the scalp position. The redline shows the AI-calculated stop loss for the scalp position.
Red arrows indicate that the strategy entered a short position at the highlighted price level.
Yellow arrows indicate that NOVA IQ exited a position.
Long Entry: Blue Arrow
Short Entry: Red Arrow
Closed Trade: Yellow Arrow
Nova Bands
The Nova Bands (NBANDS) are based on a proprietary calculation and serve as a custom two-layer smoothing filter that uses exponential decay and cosine factors.
These bands adaptively smooth the price to identify potential trend retracement opportunities.
The image above illustrates how to interpret NBANDS. While NOSC focuses on identifying micro overextensions, NBANDS is designed to capture larger price overextensions. As a result, the two indicators complement each other well and can be effectively used together to identify a broader range of price overextensions in the market.
While the Nova Bands are not part of the core heuristic and do not use IQ technology, they provide valuable insights for discretionary traders looking to refine their strategies.
Use HTF (Use Higher Timeframe) Setting
Nova IQ has only one setting that controls its functionality.
“Use HTF” controls whether the AI uses a higher timeframe trading filter. This setting can be true or false. If true, the trader must select the higher timeframe to implement.
No Higher TF Filter
Nova IQ operates with standard aggression when the higher timeframe setting is turned off. In this mode, it exclusively learns from the price data of the current chart, allowing it to trade more aggressively without the influence of a higher timeframe filter.
Higher TF Filter
Nova IQ demonstrates reduced aggression when the "Use HTF" (Higher Timeframe) setting is enabled. In this mode, Nova IQ learns from both the current chart's data and the selected higher timeframe data, factoring in the higher timeframe trend when seeking scalping opportunities. As a result, trading opportunities only arise when both the higher timeframe and the chart's timeframe simultaneously display overextensions, making this mode more selective in its entries.
In this mode, Nova IQ calculates NOSC on the higher timeframe, learns from the corresponding price data, and applies the same rules to NOSC as it does for the current chart's timeframe. This ensures that Nova IQ consistently evaluates overextensions across both timeframes, maintaining its trading logic while incorporating higher timeframe insights.
AI Direction
The AI Direction setting controls the trade direction Nova IQ is allowed to take.
“Trade Longs” allows for long trades.
“Trade Shorts” allows for short trades.
Verifying Nova IQ’s Effectiveness
Nova IQ automatically tracks its performance and displays the profit factor for the long strategy and the short strategy it uses. This information can be found in a table located in the top-right corner of your chart showing the long strategy profit factor and the short strategy profit factor.
The image above shows the long strategy profit factor and the short strategy profit factor for Nova IQ.
A profit factor greater than 1 indicates a strategy profitably traded historical price data.
A profit factor less than 1 indicates a strategy unprofitably traded historical price data.
A profit factor equal to 1 indicates a strategy did not lose or gain money when trading historical price data.
Using Nova IQ
While Nova IQ is a full-fledged trading system with entries and exits - it was designed for the manual trader to take its trading signals and analysis indications to greater heights, offering numerous applications beyond its built-in trading system.
The hallmark feature of Nova IQ is its to ignore noise and only generate signals during tradable overextensions.
The best way to identify overextensions with Nova IQ is with NOSC.
NOSC is naturally adept at identifying micro overextensions. While it can be interpreted in a manner similar to traditional oscillators like RSI or Stochastic, NOSC’s underlying calculation and self-learning capabilities make it significantly more advanced and useful than conventional oscillators.
Additionally, manual traders can benefit from using NBANDS. Although NBANDS aren't a core component of Nova IQ's guiding heuristic, they can be valuable for manual trading. Prices rarely extend beyond these bands, and it's uncommon for prices to consistently trade outside of them.
NBANDS do not incorporate IQ Technology; however, when combined with NOSC, traders can identify strong double-confluence opportunities.
Slight Swing Momentum Strategy.Introduction:
The Swing Momentum Strategy is a quantitative trading strategy designed to capture mid-term opportunities in the financial markets by combining swing trading principles with momentum indicators. It utilizes a combination of technical indicators, including moving averages, crossover signals, and volume analysis, to generate buy and sell signals. The strategy aims to identify market trends and capitalize on price momentum for profit generation.
Highlights:
The strategy offers several key highlights that make it unique and potentially attractive to traders:
Swing Trading with Momentum: The strategy combines the principles of swing trading, which aim to capture short-to-medium-term price swings, with momentum indicators that help identify strong price trends and potential breakout opportunities.
Technical Indicator Optimization: The strategy utilizes a selection of optimized technical indicators, including moving averages and crossover signals, to filter out the noise and focus on high-probability trading setups. This optimization enhances the strategy's ability to identify favourable entry and exit points.
Risk Management: The strategy incorporates risk management techniques, such as position sizing based on equity and dynamic stop loss levels, to manage risk exposure and protect capital. This helps to minimize drawdowns and preserve profits.
Buy Condition:
The buy condition in the strategy is determined by a combination of factors, including A1, A2, A3, XG, and weeklySlope. Let's break it down:
A1 Condition: The A1 condition checks for specific price relationships. It verifies that the ratio of the highest price to the closing price is less than 1.03, the ratio of the opening price to the lowest price is less than 1.03, and the ratio of the highest price to the previous day's closing price is greater than 1.06. This condition looks for a specific pattern indicating potential bullish momentum.
A2 Condition: The A2 condition checks for price relationships related to the closing price. It verifies that the ratio of the closing price to the opening price is greater than 1.05 or that the ratio of the closing price to the previous day's closing price is greater than 1.05. This condition looks for signs of upward price movement and momentum.
A3 Condition: The A3 condition focuses on volume. It checks if the current volume crosses above the highest volume over the last 60 periods. This condition aims to identify increased buying interest and potentially confirms the strength of the potential upward price movement.
XG Condition: The XG condition combines the A1 and A2 conditions and checks if they are true for both the current and previous bars. It also verifies that the ratio of the closing price to the 5-period EMA crosses above the 9-period SMA of the same ratio. This condition helps identify potential buy signals when multiple factors align, indicating a strong bullish momentum and potential entry point.
Weekly Trend Factor: The weekly slope condition calculates the slope of the 50-period SMA over a weekly timeframe. It checks if the slope is positive, indicating an overall upward trend on a weekly basis. This condition provides additional confirmation that the stock is in an upward trend.
When all of these conditions align, the buy condition is triggered, indicating a favourable time to enter a long position.
Sell Condition:
The sell condition is relatively straightforward in the strategy:
Sell Signal: The sell condition simply checks if the closing price crosses below the 10-period EMA. When this condition is met, it indicates a potential reversal or weakening of the upward price momentum, and a sell signal is generated.
Backtest Outcome:
The strategy was backtested over the period from January 22nd, 1999 to May 3rd, 2023, using daily candlestick charts for the NASDAQ: NVDA. The strategy used an initial capital of 1,000,000 USD, The order quantity is defined as 10% of the equity. The strategy allows for pyramiding with 1 order, and the transaction fee is set at 0.03% per trade. Here are the key outcomes of the backtest:
Net Profit: 539,595.84 USD, representing a return of 53.96%.
Percent Profitable: 48.82%
Total Closed Trades: 127
Profit Factor: 2.331
Max Drawdown: 68,422.70 USD
Average Trade: 4,248.79 USD
Average Number of Bars in Trades: 11, indicating the average duration of the trades.
Conclusion:
In conclusion, the Swing Momentum Strategy is a quantitative trading approach that combines swing trading principles with momentum indicators to identify and capture mid term trading opportunities. The strategy has demonstrated promising results during backtesting, including a significant net profit and a favourable profit factor.

Quantum Reversal Engine [ApexLegion]Quantum Reversal Engine
STRATEGY OVERVIEW
This strategy is constructed using 5 custom analytical filters that analyze different market dimensions - trend structure, momentum expansion, volume confirmation, price action patterns, and reversal detection - with results processed through a multi-component scoring calculation that determines signal generation and position management decisions.
Why These Custom Filters Were Independently Developed:
This strategy employs five custom-developed analytical filters:
1. Apex Momentum Core (AMC) - Custom oscillator with volatility-scaled deviation calculation
Standard oscillators lag momentum shifts by 2-3 bars. Custom calculation designed for momentum analysis
2. Apex Wick Trap (AWT) - Wick dominance analysis for trap detection
Existing wick analysis tools don't quantify trap conditions. Uses specific ratios for wick dominance detection
3. Apex Volume Pulse (AVP) - Volume surge validation with participation confirmation
Volume indicators typically use simple averages. Uses surge multipliers with participation validation
4. Apex TrendGuard (ATG) - Angle-based trend detection with volatility band integration
EMA slope calculations often produce false signals. Uses angle analysis with volatility bands for confirmation
5. Quantum Composite Filter (QCF) - Multi-component scoring and signal generation system
Composite scoring designed to filter noise by requiring multiple confirmations before signal activation.
Each filter represents mathematical calculations designed to address specific analytical requirements.
Framework Operation: The strategy functions as a scoring framework where each filter contributes weighted points based on market conditions. Entry signals are generated when minimum threshold scores are met. Exit management operates through a three-tier system with continued signal strength evaluation determining position holds versus closures at each TP level.
Integration Challenge: The core difficulty was creating a scoring system where five independent filters could work together without generating conflicting signals. This required backtesting to determine effective weight distributions.
Custom Filter Development:
Each of the five filters represents analytical approaches developed through testing and validation:
Integration Validation: Each filter underwent individual testing before integration. The composite scoring system required validation to verify that filters complement rather than conflict with each other, resulting in a cohesive analytical framework that was tested during the development period.
These filters represent custom-developed components created specifically for this strategy, with each component addressing different analytical requirements through testing and parameter adjustment.
Programming Features:
Multi-timeframe data handling with backup systems
Performance optimization techniques
Error handling for live trading scenarios
Parameter adaptation based on market conditions
Strategy Features:
Uses multi-filter confirmation approach
Adapts position holding based on continued signal strength
Includes analysis tools for trade review and optimization
Ongoing Development: The strategy was developed through testing and validation processes during the creation period.
COMPONENT EXPLANATION
EMA System
Uses 8 exponential moving averages (7, 14, 21, 30, 50, 90, 120, 200 periods) for trend identification. Primary signals come from 8/21 EMA crossovers, while longer EMAs provide structural context. EMA 1-4 determine short-term structure, EMA 5-8 provide long-term trend confirmation.
Apex Momentum Core (AMC)
Built custom oscillator mathematics after testing dozens of momentum calculation methods. Final algorithm uses price deviation from EMA baseline with volatility scaling to reduce lag while maintaining accuracy across different market conditions.
Custom momentum oscillator using price deviation from EMA baseline:
apxCI = 100 * (source - emaBase) / (sensitivity * sqrt(deviation + 1))
fastLine = EMA(apxCI, smoothing)
signalLine = SMA(fastLine, 4)
Signals generate when fastLine crosses signalLine at +50/-50 thresholds.
This identifies momentum expansion before traditional oscillators.
Apex Volume Pulse (AVP)
Created volume surge analysis that goes beyond simple averages. Extensive testing determined 1.3x multiplier with participation validation provides reliable confirmation while filtering false volume spikes.
Compares current volume to 21-period moving average.
Requires 1.3x average volume for signal confirmation. This filters out low-volume moves during quiet periods and confirms breakouts with actual participation.
Apex Wick Trap (AWT)
Developed proprietary wick trap detection through analysis of failed breakout patterns. Tested various ratio combinations before settling on 60% wick dominance + 20% body limit as effective trap identification parameters.
Analyzes candle structure to identify failed breakouts:
candleRange = math.max(high - low, 0.00001)
candleBody = math.abs(close - open)
bodyRatio = candleBody / candleRange
upperWick = high - math.max(open, close)
lowerWick = math.min(open, close) - low
upperWickRatio = upperWick / candleRange
lowerWickRatio = lowerWick / candleRange
trapWickLong = showAWT and lowerWickRatio > minWickDom and bodyRatio < bodyToRangeLimit and close > open
trapWickShort = showAWT and upperWickRatio > minWickDom and bodyRatio < bodyToRangeLimit and close < open This catches reversals after fake breakouts.
Apex TrendGuard (ATG)
Built angle-based trend detection after standard EMA crossovers proved insufficient. Combined slope analysis with volatility bands through iterative testing to eliminate false trend signals.
EMA slope analysis with volatility bands:
Fast EMA (21) vs Slow EMA (55) for trend direction
Angle calculation: atan(fast - slow) * 180 / π
ATR bands (1.75x multiplier) for breakout confirmation
Minimum 25° angle for strong trend classification
Core Algorithm Framework
1. Composite Signal Generation
calculateCompositeSignals() =>
// Component Conditions
structSignalLong = trapWickLong
structSignalShort = trapWickShort
momentumLong = amcBuySignal
momentumShort = amcSellSignal
volumeSpike = volume > volAvg_AVP * volMult_AVP
priceStrength_Long = close > open and close > close
priceStrength_Short = close < open and close < close
rsiMfiComboValue = (ta.rsi(close, 14) + ta.mfi(close, 14)) / 2
reversalTrigger_Long = ta.crossover(rsiMfiComboValue, 50)
reversalTrigger_Short = ta.crossunder(rsiMfiComboValue, 50)
isEMACrossUp = ta.crossover(emaFast_ATG, emaSlow_ATG)
isEMACrossDown = ta.crossunder(emaFast_ATG, emaSlow_ATG)
// Enhanced Composite Score Calculation
scoreBuy = 0.0
scoreBuy += structSignalLong ? scoreStruct : 0.0
scoreBuy += momentumLong ? scoreMomentum : 0.0
scoreBuy += flashSignal ? weightFlash : 0.0
scoreBuy += blinkSignal ? weightBlink : 0.0
scoreBuy += volumeSpike_AVP ? scoreVolume : 0.0
scoreBuy += priceStrength_Long ? scorePriceAction : 0.0
scoreBuy += reversalTrigger_Long ? scoreReversal : 0.0
scoreBuy += emaAlignment_Bull ? weightTrendAlign : 0.0
scoreBuy += strongUpTrend ? weightTrendAlign : 0.0
scoreBuy += highRisk_Long ? -1.2 : 0.0
scoreBuy += signalGreenDot ? 1.0 : 0.0
scoreBuy += isAMCUp ? 0.8 : 0.0
scoreBuy += isVssBuy ? 1.5 : 0.0
scoreBuy += isEMACrossUp ? 1.0 : 0.0
scoreBuy += signalRedX ? -1.0 : 0.0
scoreSell = 0.0
scoreSell += structSignalShort ? scoreStruct : 0.0
scoreSell += momentumShort ? scoreMomentum : 0.0
scoreSell += flashSignal ? weightFlash : 0.0
scoreSell += blinkSignal ? weightBlink : 0.0
scoreSell += volumeSpike_AVP ? scoreVolume : 0.0
scoreSell += priceStrength_Short ? scorePriceAction : 0.0
scoreSell += reversalTrigger_Short ? scoreReversal : 0.0
scoreSell += emaAlignment_Bear ? weightTrendAlign : 0.0
scoreSell += strongDownTrend ? weightTrendAlign : 0.0
scoreSell += highRisk_Short ? -1.2 : 0.0
scoreSell += signalRedX ? 1.0 : 0.0
scoreSell += isAMCDown ? 0.8 : 0.0
scoreSell += isVssSell ? 1.5 : 0.0
scoreSell += isEMACrossDown ? 1.0 : 0.0
scoreSell += signalGreenDot ? -1.0 : 0.0
compositeBuySignal = enableComposite and scoreBuy >= thresholdCompositeBuy
compositeSellSignal = enableComposite and scoreSell >= thresholdCompositeSell
if compositeBuySignal and compositeSellSignal
compositeBuySignal := false
compositeSellSignal := false
= calculateCompositeSignals()
// Final Entry Signals
entryCompositeBuySignal = compositeBuySignal and ta.rising(emaFast_ATG, 2)
entryCompositeSellSignal = compositeSellSignal and ta.falling(emaFast_ATG, 2)
Calculates weighted scores from independent modules and activates signals only when threshold requirements are met.
2. Smart Exit Hold Evaluation System
evaluateSmartHold() =>
compositeBuyRecentCount = 0
compositeSellRecentCount = 0
for i = 0 to signalLookbackBars - 1
compositeBuyRecentCount += compositeBuySignal ? 1 : 0
compositeSellRecentCount += compositeSellSignal ? 1 : 0
avgVolume = ta.sma(volume, 20)
volumeSpike = volume > avgVolume * volMultiplier
// MTF Bull/Bear conditions
mtf_bull = mtf_emaFast_final > mtf_emaSlow_final
mtf_bear = mtf_emaFast_final < mtf_emaSlow_final
emaBackupDivergence = math.abs(mtf_emaFast_backup - mtf_emaSlow_backup) / mtf_emaSlow_backup
emaBackupStrong = emaBackupDivergence > 0.008
mtfConflict_Long = inLong and mtf_bear and emaBackupStrong
mtfConflict_Short = inShort and mtf_bull and emaBackupStrong
// Layer 1: ATR-Based Dynamic Threshold (Market Volatility Intelligence)
atr_raw = ta.atr(atrLen)
atrValue = na(atr_raw) ? close * 0.02 : atr_raw
atrRatio = atrValue / close
dynamicThreshold = atrRatio > 0.02 ? 1.0 : (atrRatio > 0.01 ? 1.5 : 2.8)
// Layer 2: ROI-Conditional Time Intelligence (Selective Pressure)
timeMultiplier_Long = realROI >= 0 ? 1.0 : // Profitable positions: No time pressure
holdTimer_Long <= signalLookbackBars ? 1.0 : // Loss positions 1-8 bars: Base
holdTimer_Long <= signalLookbackBars * 2 ? 1.1 : // Loss positions 9-16 bars: +10% stricter
1.3 // Loss positions 17+ bars: +30% stricter
timeMultiplier_Short = realROI >= 0 ? 1.0 : // Profitable positions: No time pressure
holdTimer_Short <= signalLookbackBars ? 1.0 : // Loss positions 1-8 bars: Base
holdTimer_Short <= signalLookbackBars * 2 ? 1.1 : // Loss positions 9-16 bars: +10% stricter
1.3 // Loss positions 17+ bars: +30% stricter
// Dual-Layer Threshold Calculation
baseThreshold_Long = mtfConflict_Long ? dynamicThreshold + 1.0 : dynamicThreshold
baseThreshold_Short = mtfConflict_Short ? dynamicThreshold + 1.0 : dynamicThreshold
timeAdjustedThreshold_Long = baseThreshold_Long * timeMultiplier_Long
timeAdjustedThreshold_Short = baseThreshold_Short * timeMultiplier_Short
// Final Smart Hold Decision with Dual-Layer Intelligence
smartHold_Long = not mtfConflict_Long and smartScoreLong >= timeAdjustedThreshold_Long and compositeBuyRecentCount >= signalMinCount
smartHold_Short = not mtfConflict_Short and smartScoreShort >= timeAdjustedThreshold_Short and compositeSellRecentCount >= signalMinCount
= evaluateSmartHold()
Evaluates whether to hold positions past TP1/TP2/TP3 levels based on continued signal strength, volume confirmation, and multi-timeframe trend alignment
HOW TO USE THE STRATEGY
Step 1: Initial Setup
Apply strategy to your preferred timeframe (backtested on 15M)
Enable "Use Heikin-Ashi Base" for smoother signals in volatile markets
"Show EMA Lines" and "Show Ichimoku Cloud" are enabled for visual context
Set default quantities to match your risk management (5% equity default)
Step 2: Signal Recognition
Visual Signal Guide:
Visual Signal Guide - Complete Reference:
🔶 Red Diamond: Bearish momentum breakdown - short reversal signal
🔷 Blue Diamond: Strong bullish momentum - long reversal signal
🔵 Blue Dot: Volume-confirmed directional move - trend continuation
🟢 Green Dot: Bullish EMA crossover - trend reversal confirmation
🟠 Orange X: Oversold reversal setup - counter-trend opportunity
❌ Red X: Bearish EMA breakdown - trend reversal warning
✡ Star Uprising: Strong bullish convergence
💥 Ultra Entry: Ultra-rapid downward momentum acceleration
▲ VSS Long: Velocity-based bullish momentum confirmation
▼ VSS Short: Velocity-based bearish momentum confirmation
Step 3: Entry Execution
For Long Positions:
1. ✅ EMA1 crossed above EMA2 exactly 3 bars ago [ta.crossover(ema1,ema2) ]
2. ✅ Current EMA structure: EMA1 > EMA2 (maintained)
3. ✅ Composite score ≥ 5.0 points (6.5+ for 5-minute timeframes)
4. ✅ Cooldown period completed (no recent stop losses)
5. ✅ Volume spike confirmation (green dot/blue dot signals)
6. ✅ Bullish candle closes above EMA structure
For Short Positions:
1. ✅ EMA1 crossed below EMA2 exactly 3 bars ago [ta.crossunder(ema1,ema2) ]
2. ✅ Current EMA structure: EMA1 < EMA2 (maintained)
3. ✅ Composite score ≥ 5.4 points (7.0+ for 5-minute timeframes)
4. ✅ Cooldown period completed (no recent stop losses)
5. ✅ Momentum breakdown (red diamond/red X signals)
6. ✅ Bearish candle closes below EMA structure
🎯 Critical Timing Note: The strategy requires EMA crossover to have occurred 3 bars prior to entry, not at the current bar. This attempts to avoid premature entries and may improve signal reliability.
Step 4: Reading Market Context
EMA Ribbon Interpretation:
All EMAs ascending = Strong uptrend context
EMAs 1-3 above EMAs 4-8 = Bullish structure
Tight EMA spacing = Low volatility/consolidation
Wide EMA spacing = High volatility/trending
Ichimoku Cloud Context:
Price above cloud = Bullish environment
Price below cloud = Bearish environment
Cloud color intensity = Momentum strength
Thick cloud = Strong support/resistance
THE SMART EXIT GRID SYSTEM
Smart Exit Grid Approach:
The Smart Exit Grid uses dynamic hold evaluation that continuously analyzes market conditions after position entry. This differs from traditional fixed profit targets by adapting exit timing based on real-time signal strength.
How Smart Exit Grid System Works
The system operates through three evaluation phases:
Smart Score Calculation:
The smart score calculation aggregates 22 signal components in real-time, combining reversal warnings, continuation signals, trend alignment indicators, EMA structural analysis, and risk penalties into a numerical representation of market conditions. MTF analysis provides additional confirmation as a separate validation layer.
Signal Stack Management:
The per-tick signal accumulation system monitors 22 active signal types with MTF providing trend validation and conflict detection as a separate confirmation layer.
Take Profit Progression:
Smart Exit Activation:
The QRE system activates Smart Exit Grid immediately upon position entry. When strategy.entry() executes, the system initializes monitoring systems designed to track position progress.
Upon position opening, holdTimer begins counting, establishing the foundation for subsequent decisions. The Smart Exit Grid starts accumulating signals from entry, with all 22 signal components beginning real-time tracking when the trade opens.
The system operates on continuous evaluation where smartScoreLong and smartScoreShort calculate from the first tick after entry. QRE's approach is designed to capture market structure changes, trend deteriorations, or signal pattern shifts that can trigger protective exits even before the first take profit level is reached.
This activation creates a proactive position management framework. The 8-candle sliding window starts from entry, meaning that if market conditions change rapidly after entry - due to news events, liquidity shifts, or technical changes - the system can respond within the configured lookback period.
TP Markers as Reference Points:
The TP1, TP2, and TP3 levels function as reference points rather than mandatory exit triggers. When longTP1Hit or shortTP1Hit conditions activate, they serve as profit confirmation markers that inform the Smart Exit algorithm about achieved reward levels, but don't automatically initiate position closure.
These TP markers enhance the Smart Exit decision matrix by providing profit context to ongoing signal evaluation. The system recognizes when positions have achieved target returns, but the actual exit decision remains governed by continuous smart score evaluation and signal stack analysis.
TP2 Reached: Enhanced Monitoring
TP2 represents significant profit capture with additional monitoring features:
This approach is designed to help avoid premature profit-taking during trending conditions. If TP2 is reached but smartScoreLong remains above the dynamic threshold and the 8-candle sliding window shows persistent signals, the position continues holding. If market structure deteriorates before reaching TP2, the Smart Exit can trigger closure based on signal analysis.
The visual TP circles that appear when levels are reached serve as performance tracking tools, allowing users to see how frequently entries achieve various profit levels while understanding that actual exit timing depends on market structure analysis.
Risk Management Systems:
Operating independently from the Smart Exit Grid are two risk management systems: the Trap Wick Detection Protocol and the Stop Loss Mechanism. These systems maintain override authority over other exit logic.
The Trap Wick System monitors for conditionBearTrapExit during long positions and conditionBullTrapExit during short positions. When detected, these conditions trigger position closure with state reset, bypassing Smart Exit evaluations. This system recognizes that certain candlestick patterns may indicate reversal risk.
Volatility Exit Monitoring: The strategy monitors for isStrongBearCandle combined with conditionBearTrapExit, recognizing when market structure may be shifting.
Volume Validation: Before exiting on volatility, the strategy requires volume confirmation: volume > ta.sma(volume, 20) * 1.8. This is designed to filter exits on weak, low-volume movements.
The Stop Loss Mechanism operates through multiple triggers including traditional price-based stops (longSLHit, shortSLHit) and early exit conditions based on smart score deterioration combined with negative ROI. The early exit logic activates when smartScoreLong < 1.0 or smartScoreShort < 1.0 while realROI < -0.9%.
These risk management systems are designed so that risk scenarios can trigger protective closure with state reset across all 22 signal counters, TP tracking variables, and smart exit states.
This architecture - Smart Exit activation, TP markers as navigation tools, and independent risk management - creates a position management system that adapts to market conditions while maintaining risk discipline through dedicated protection protocols.
TP3 Reached: Enhanced Protection
Once TP3 is hit, the strategy shifts into enhanced monitoring:
EMA Structure Monitoring: isEMAStructureDown becomes a primary exit trigger
MTF Alignment: The higher timeframe receives increased consideration
Wick Trap Priority: conditionBearTrapExit becomes an immediate exit signal
Approach Differences:
Traditional Fixed Exits:
Exit at predetermined levels regardless of market conditions
May exit during trend continuation
May exit before trend completion
Limited adaptation to changing volatility
Smart Exit Grid Approach:
Adaptive timing based on signal conditions
Exits when supporting signals weaken
Multi-timeframe validation for trend confirmation
Volume confirmation requirements for holds
Structural monitoring for trend analysis
Dynamic ATR-Based Smart Score Threshold System
Market Volatility Adaptive Scoring
// Real-time ATR Analysis
atr_raw = ta.atr(atrLen)
atrValue = na(atr_raw) ? close * 0.02 : atr_raw
atrRatio = atrValue / close
// Three-Tier Dynamic Threshold Matrix
dynamicThreshold = atrRatio > 0.02 ? 1.0 : // High volatility: Lower threshold
(atrRatio > 0.01 ? 1.5 : // Medium volatility: Standard
2.8) // Low volatility: Higher threshold
The market volatility adaptive scoring calculates real-time ATR with a 2% fallback for new markets. The atrRatio represents the relationship between current volatility and price, creating a foundation for threshold adjustment.
The three-tier dynamic threshold matrix responds to market conditions by adjusting requirements based on volatility levels: lowering thresholds during high volatility periods above 2% ATR ratio to 1.0 points, maintaining standard requirements at 1.5 points for medium volatility between 1-2%, and raising standards to 2.8 points during low volatility periods below 1%.
Profit-Loss Adaptive Management:
The system applies different evaluation criteria based on position performance:
Winning Positions (realROI ≥ 0%):
→ timeMultiplier = 1.0 (No additional pressure)
→ Maintains base threshold requirements
→ Allows natural progression to TP2/TP3 levels
Losing Positions (realROI < 0%):
→ Progressive time pressure activated
→ Increasingly strict requirements over time
→ Faster decision-making on underperforming trades
ROI-Adaptive Smart Hold Decision Process:
The strategy uses a profit-loss adaptive system:
Winning Position Management (ROI ≥ 0%):
✅ Standard threshold requirements maintained
✅ No additional time-based pressure applied
✅ Allows positions to progress toward TP2/TP3 levels
✅ timeMultiplier remains at 1.0 regardless of hold duration
Losing Position Management (ROI < 0%):
⚠️ Time-based threshold adjustments activated
⚠️ Progressive increase in required signal strength over time
⚠️ Earlier exit evaluation on underperforming positions
⚠️ timeMultiplier increases from 1.0 → 1.1 → 1.3 based on hold duration
Real-Time Monitoring:
Monitor Analysis Table → "Smart" filter → "Score" vs "Dynamic Threshold"
Winning positions: Evaluation based on signal strength deterioration only
Losing positions: Evaluation considers both signal strength and progressive time adjustments
Breakeven positions (0% ROI): Treated as winning positions - no time adjustments
This approach differentiates between winning and losing positions in the hold evaluation process, requiring higher signal thresholds for extended holding of losing positions while maintaining standard requirements for winning ones.
ROI-Conditional Decision Matrix Examples:
Scenario 1 - Winning Position in Any Market:
Position ROI: +0.8% → timeMultiplier = 1.0 (regardless of hold time)
ATR Medium (1.2%) → dynamicThreshold = 1.5
Final Threshold = 1.5 × 1.0 = 1.5 points ✅ Position continues
Scenario 2 - Losing Position, Extended Hold:
Position ROI: -0.5% → Time pressure activated
Hold Time: 20 bars → timeMultiplier = 1.3
ATR Low (0.8%) → dynamicThreshold = 2.8
Final Threshold = 2.8 × 1.3 = 3.64 points ⚡ Enhanced requirements
Scenario 3 - Fresh Losing Position:
Position ROI: -0.3% → Time pressure activated
Hold Time: 5 bars → timeMultiplier = 1.0 (still early)
ATR High (2.1%) → dynamicThreshold = 1.0
Final Threshold = 1.0 × 1.0 = 1.0 points 📊 Recovery opportunity
Scenario 4 - Breakeven Position:
Position ROI: 0.0% → timeMultiplier = 1.0 (no pressure)
Hold Time: 15 bars → No time penalty applied
Final Threshold = dynamicThreshold only ⚖️ Neutral treatment
🔄8-Candle Sliding Window Signal Rotation System
Composite Signal Counting Mechanism
// Dynamic Lookback Window (configurable: default 8)
signalLookbackBars = input.int(8, "Composite Lookback Bars", minval=1, maxval=50)
// Rolling Signal Analysis
compositeBuyRecentCount = 0
compositeSellRecentCount = 0
for i = 0 to signalLookbackBars - 1
compositeBuyRecentCount += compositeBuySignal ? 1 : 0
compositeSellRecentCount += compositeSellSignal ? 1 : 0
Candle Flow Example (8-bar window):
→
✓ ✓ ✗ ✓ ✗ ✓ ✗ ✓ 🗑️
New Signal Count = 5/8 signals in window
Threshold Check: 5 ≥ signalMinCount (2) = HOLD CONFIRMED
Signal Decay & Refresh Mechanism
// Signal Persistence Tracking
if compositeBuyRecentCount >= signalMinCount
smartHold_Long = true
else
smartHold_Long = false
The composite signal counting operates through a configurable sliding window. The system maintains rolling counters that scan backward through the specified number of candles.
During each evaluation cycle, the algorithm iterates through historical bars, incrementing counters when composite signals are detected. This creates a dynamic signal persistence measurement where recent signal density determines holding decisions.
The sliding window rotation functions like a moving conveyor belt where new signals enter while the oldest signals drop off. For example, in an 8-bar window, if 5 out of 8 recent candles showed composite buy signals, and the minimum required count is 2, the system confirms the hold condition. As new bars form, the window slides forward, potentially changing the signal count and triggering exit conditions when signal density falls below the threshold.
Signal decay and refresh occur continuously where smartHold_Long remains true only when compositeBuyRecentCount exceeds signalMinCount. When recent signal density drops below the minimum requirement, the system switches to exit mode.
Advanced Signal Stack Management - 22-Signal Real-Time Evaluation
// Long Position Signal Stacking (calc_on_every_tick=true)
if inLong
// Primary Reversal Signals
if signalRedDiamond: signalCountRedDiamond += 1 // -0.5 points
if signalStarUprising: signalCountStarUprising += 1 // +1.5 points
if entryUltraShort: signalCountUltra += 1 // -1.0 points
// Trend Confirmation Signals
if strongUpTrend: trendUpCount_Long += 1 // +1.5 points
if emaAlignment_Bull: bullAlignCount_Long += 1 // +1.0 points
// Risk Assessment Signals
if highRisk_Long: riskCount_Long += 1 // -1.5 points
if topZone: tzoneCount_Long += 1 // -0.5 points
The per-tick signal accumulation system operates with calc_on_every_tick=true for real-time responsiveness. During long positions, the system monitors primary reversal signals where Red Diamond signals subtract 0.5 points as reversal warnings, Star Uprising adds 1.5 points for continuation signals, and Ultra Short signals deduct 1.0 points as counter-trend warnings.
Trend confirmation signals provide weighted scoring where strongUpTrend adds 1.5 points for aligned momentum, emaAlignment_Bull contributes 1.0 point for structural support, and various EMA-based confirmations contribute to the overall score. Risk assessment signals apply negative weighting where highRisk_Long situations subtract 1.5 points, topZone conditions deduct 0.5 points, and other risk factors create defensive scoring adjustments.
The smart score calculation aggregates all 22 components in real-time, combining reversal warnings, continuation signals, trend alignment indicators, EMA structural analysis, and risk penalties into a numerical representation of market conditions. This score updates continuously, providing the foundation for hold-or-exit decisions.
MULTI-TIMEFRAME (MTF) SYSTEM
MTF Data Collection
The strategy requests higher timeframe data (default 30-minute) for trend confirmation:
= request.security(syminfo.tickerid, mtfTimeframe, , lookahead=barmerge.lookahead_off, gaps=barmerge.gaps_off)
MTF Watchtower System - Implementation Logic
The system employs a timeframe discrimination protocol where currentTFInMinutes is compared against a 30-minute threshold. This creates different operational behavior between timeframes:
📊 Timeframe Testing Results:
30M+ charts: Full MTF confirmation → Tested with full features
15M charts: Local EMA + adjusted parameters → Standard testing baseline
5M charts: Local EMA only → Requires parameter adjustment
1M charts: High noise → Limited testing conducted
When the chart timeframe is 30 minutes or above, the strategy activates useMTF = true and requests external MTF data through request.security(). For timeframes below 30 minutes, including your 5-minute setup, the system deliberately uses local EMA calculations to avoid MTF lag and data inconsistencies.
The triple-layer data sourcing architecture works as follows: timeframes from 1 minute to 29 minutes rely on chart-based EMA calculations for immediate responsiveness. Timeframes of 30 minutes and above utilize MTF data through the security function, with a backup system that doubles the EMA length (emaLen * 2) if MTF data fails. When MTF data is unavailable or invalid, the system falls back to local EMA as the final safety net.
Data validation occurs through a pipeline where mtf_dataValid checks not only for non-null values but also verifies that EMA values are positive above zero. The system tracks data sources through mtf_dataSource which displays "MTF Data" for successful external requests, "Backup EMA" for failed MTF with backup system active, or "Chart EMA" for local calculations.
🔄 MTF Smart Score Caching & Recheck System
// Cache Update Decision Logic
mtfSmartIntervalSec = input.int(300, "Smart Grid Recheck Interval (sec)") // 5-minute cache
canRecheckSmartScore = na(timenow) ? false :
(na(lastCheckTime) or (timenow - lastCheckTime) > mtfSmartIntervalSec * 1000)
// Cache Management
if canRecheckSmartScore
lastCheckTime := timenow
cachedSmartScoreLong := smartScoreLong // Store current calculation
cachedSmartScoreShort := smartScoreShort
The performance-optimized caching system addresses the computational intensity of continuous MTF analysis through intelligent interval management. The mtfSmartIntervalSec parameter, defaulting to 300 seconds (5 minutes), determines cache refresh frequency. The system evaluates canRecheckSmartScore by comparing current time against lastCheckTime plus the configured interval.
When cache updates trigger, the system stores current calculations in cachedSmartScoreLong and cachedSmartScoreShort, creating stable reference points that reduce excessive MTF requests. This cache management balances computational efficiency with analytical accuracy.
The cache versus real-time hybrid system creates a multi-layered decision matrix where immediate signals update every tick for responsive market reaction, cached MTF scores refresh every 5 minutes for stability filtering, dynamic thresholds recalculate every bar for volatility adaptation, and sliding window analysis updates every bar for trend persistence validation.
This architecture balances real-time signal detection with multi-timeframe strategic validation, creating adaptive trading intelligence that responds immediately to market changes while maintaining strategic stability through cached analysis and volatility-adjusted decision thresholds.
⚡The Execution Section Deep Dive
The execution section represents the culmination of all previous systems – where analysis transforms into action.
🚪 Entry Execution: The Gateway Protocol
Primary Entry Validation:
Entry isn't just about seeing a signal – it's about passing through multiple security checkpoints, each designed to filter out low-quality opportunities.
Stage 1: Signal Confirmation
entryCompositeBuySignal must be TRUE for longs
entryCompositeSellSignal must be TRUE for shorts
Stage 2: Enhanced Entry Validation
The strategy employs an "OR" logic system that recognizes different types of market opportunities:
Path A - Trend Reversal Entry:
When emaTrendReversal_Long triggers, it indicates the market structure is shifting in favor of the trade direction. This isn't just about a single EMA crossing – it represents a change in market momentum that experienced traders recognize as potential high-probability setups.
Path B - Momentum Breakout Entry:
The strongBullMomentum condition is where QRE identifies accelerating market conditions:
Criteria:
EMA1 rising for 3+ candles AND
EMA2 rising for 2+ candles AND
Close > 10-period high
This combination captures those explosive moves where the market doesn't just trend – it accelerates, creating momentum-driven opportunities.
Path C - Recovery Entry:
When previous exit states are clean (no recent stop losses), the strategy permits entry based purely on signal strength. This pathway is designed to help avoid the strategy becoming overly cautious after successful trades.
🛡️ The Priority Exit Matrix: When Rules Collide
Not all exit signals are created equal. QRE uses a strict hierarchy that is designed to avoid conflicting signals from causing hesitation:
Priority Level 1 - Exception Exits (Immediate Action):
Condition: TP3 reached AND Wick Trap detected
Action: Immediate exit regardless of other signals
Rationale: Historical analysis suggests wick traps at TP3 may indicate potential reversals
Priority Level 2 - Structural Breakdown:
Condition: TP3 active AND EMA structure deteriorating AND Smart Score insufficient
Logic: isEMAStructureDown AND NOT smartHold_Long
This represents the strategy recognizing that the underlying market structure that justified the trade is failing. It's like a building inspector identifying structural issues – you don't wait for additional confirmation.
Priority Level 3 - Enhanced Volatility Exits:
Conditions: TP2 active AND Strong counter-candle AND Wick trap AND Volume spike
Logic: Multiple confirmation required to reduce false exits
Priority Level 4 - Standard Smart Score Exits:
Condition: Any TP level active AND smartHold evaluates to FALSE
This is the bread-and-butter exit logic where signal deterioration triggers exit
⚖️ Stop Loss Management: Risk Control Protocol
Dual Stop Loss System:
QRE provides two stop loss modes that users can select based on their preference:
Fixed Mode (Default - useAdaptiveSL = false):
Uses predetermined percentage levels regardless of market volatility:
- Long SL = entryPrice × (1 - fixedRiskP - slipBuffer)
- Short SL = entryPrice × (1 + fixedRiskP + slipBuffer)
- Default: 0.6% risk + 0.3% slippage buffer = 0.9% total stop
- Consistent and predictable stop loss levels
- Recommended for users who prefer stable risk parameters
Adaptive Mode (Optional - useAdaptiveSL = true):
Dynamic system that adjusts stop loss based on market volatility:
- Base Calculation uses ATR (Average True Range)
- Long SL = entryPrice × (1 - (ATR × atrMultSL) / entryPrice - slipBuffer)
- Short SL = entryPrice × (1 + (ATR × atrMultSL) / entryPrice + slipBuffer)
- Automatically widens stops during high volatility periods
- Tightens stops during low volatility periods
- Advanced users can enable for volatility-adaptive risk management
Trend Multiplier Enhancement (Both Modes):
When strongUpTrend is detected for long positions, the stop loss receives 1.5x breathing room. Strong trends often have deeper retracements before continuing. This is designed to help avoid the strategy being shaken out of active trades by normal market noise.
Mode Selection Guidance:
- New Users: Start with Fixed Mode for predictable risk levels
- Experienced Users: Consider Adaptive Mode for volatility-responsive stops
- Volatile Markets: Adaptive Mode may provide better stop placement
- Stable Markets: Fixed Mode often sufficient for consistent risk management
Early Exit Conditions:
Beyond traditional stop losses, QRE implements "smart stops" that trigger before price-based stops:
Early Long Exit: (smartScoreLong < 1.0 OR prev5BearCandles) AND realROI < -0.9%
🔄 State Management: The Memory System
Complete State Reset Protocol:
When a position closes, QRE doesn't just wipe the slate clean – it performs a methodical reset:
TP State Cleanup:
All Boolean flags: tp1/tp2/tp3HitBefore → FALSE
All Reached flags: tp1/tp2/tp3Reached → FALSE
All Active flags: tp1/tp2/tp3HoldActive → FALSE
Signal Counter Reset:
Every one of the 22 signal counters returns to zero.
This is designed to avoid signal "ghosting" where old signals influence new trades.
Memory Preservation:
While operational states reset, certain information is preserved for learning:
killReasonLong/Short: Why did this trade end?
lastExitWasTP1/TP2/TP3: What was the exit quality?
reEntryCount: How many consecutive re-entries have occurred?
🔄 Re-Entry Logic: The Comeback System
Re-Entry Conditions Matrix:
QRE implements a re-entry system that recognizes not all exits are created equal:
TP-Based Re-Entry (Enabled):
Criteria: Previous exit was TP1, TP2, or TP3
Cooldown: Minimal or bypassed entirely
Logic: Target-based exits indicate potentially viable market conditions
EMA-Based Re-Entry (Conditional):
Criteria: Previous exit was EMA-based (structural change)
Requirements: Must wait for EMA confirmation in new direction
Minimum Wait: 5 candles
Advanced Re-Entry Features:
When adjustReEntryTargets is enabled, the strategy becomes more aggressive with re-entries:
Target Adjustment: TP1 multiplied by reEntryTP1Mult (default 2.0)
Stop Adjustment: SL multiplied by reEntrySLMult (default 1.5)
Logic: If we're confident enough to re-enter, we should be confident enough to hold for bigger moves
Performance Tracking: Strategy tracks re-entry win rate, average ROI, and total performance separately from initial entries for optimization analysis.
📊 Exit Reason Analytics: Learning from Every Trade
Kill Reason Tracking:
Every exit is categorized and stored:
"TP3 Exit–Wick Trap": Exit at target level with wick pattern detection
"Smart Exit–EMA Down": Structural breakdown exit
"Smart Exit–Volatility": Volatility-based protection exit
"Exit Post-TP1/TP2/TP3": Standard smart exit progression
"Long SL Exit" / "Short SL Exit": Stop loss exits
Performance Differentiation:
The strategy tracks performance by exit type, allowing for continuous analysis:
TP-based exits: Achieved target levels, analyze for pattern improvement
EMA-based exits: Mixed results, analyze for pattern improvement
SL-based exits: Learning opportunities, adjust entry criteria
Volatility exits: Protective measures, monitor performance
🎛️ Trailing Stop Implementation:
Conditional Trailing Activation:
Activation Criteria: Position profitable beyond trailingStartPct AND
(TP hold active OR re-entry trade)
Dynamic Trailing Logic:
Unlike simple trailing stops, QRE's implementation considers market context:
Trending Markets: Wider trail offsets to avoid whipsaws
Volatile Markets: Tighter offsets to protect gains
Re-Entry Trades: Enhanced trailing to maximize second-chance opportunities
Return-to-Entry Protection:
When deactivateOnReturn is enabled, the strategy will close positions that return to entry level after being profitable. This is designed to help avoid the frustration of watching profitable trades turn into losers.
🧠 How It All Works Together
The beauty of QRE lies not in any single component, but in how everything integrates:
The Entry Decision: Multiple pathways are designed to help identify opportunities while maintaining filtering standards.
The Progression System: Each TP level unlocks new protection features, like achieving ranks in a video game.
The Exit Matrix: Prioritized decision-making aims to reduce analysis paralysis while providing appropriate responses to different market conditions.
The Memory System: Learning from each trade while preventing contamination between separate opportunities.
The Re-Entry Logic: Re-entry system that balances opportunity with risk management.
This creates a trading system where entry conditions filter for quality, progression systems adapt to changing market conditions, exit priorities handle conflicting signals intelligently, memory systems learn from each trade cycle, and re-entry logic maximizes opportunities while managing risk exposure.
📊 ANALYSIS TABLE INTERPRETATION -
⚙️ Enabling Analysis Mode
Navigate to strategy settings → "Testing & Analysis" → Enable "Show Analysis Table". The Analysis Table displays different information based on the selected test filter and provides real-time insight into all strategy components, helping users understand current market conditions, position status, and system decision-making processes.
📋 Filter Mode Interpretations
"All" Mode (Default View):
Composite Section:
Buy Score: Aggregated strength from all 22 bullish signals (threshold 5.0+ triggers entry consideration)
Sell Score: Aggregated strength from all 22 bearish signals (threshold 5.4+ triggers entry consideration)
APEX Filters:
ATG Trend: Shows current trend direction analysis
Indicates whether momentum filters are aligned for directional bias
ReEntry Section:
Most Recent Exit: Displays exit type and timeframe since last position closure
Status: Shows if ReEntry system is Ready/Waiting/Disabled
Count: Current re-entry attempts versus maximum allowed attempts
Position Section (When Active):
Status: Current position state (LONG/SHORT/FLAT)
ROI: Dual calculation showing Custom vs Real ROI percentages
Entry Price: Original position entry level
Current Price: Live market price for comparison
TP Tracking: Progress toward profit targets
"Smart" Filter (Critical for Active Positions):
Smart Exit Section:
Hold Timer: Time elapsed since position opened (bar-based counting)
Status: Whether Smart Exit Grid is Enabled/Disabled
Score: Current smart score calculation from 22-component matrix
Dynamic Threshold: ATR-based minimum score required for holding
Final Threshold: Time and ROI-adjusted threshold actually used for decisions
Score Check: Pass/Fail based on Score vs Final Threshold comparison
Smart Hold: Current hold decision status
Final Hold: Final recommendation based on all factors
🎯 Advanced Smart Exit Debugging - ROI & Time-Based Threshold System
Understanding the Multi-Layer Threshold System:
Layer 1: Dynamic Threshold (ATR-Based)
atrRatio = ATR / close
dynamicThreshold = atrRatio > 0.02 ? 1.0 : // High volatility: Lower threshold
(atrRatio > 0.01 ? 1.5 : // Medium volatility: Standard
2.8) // Low volatility: Higher threshold
Layer 2: Time Multiplier (ROI & Duration-Based)
Winning Positions (ROI ≥ 0%):
→ timeMultiplier = 1.0 (No time pressure, regardless of hold duration)
Losing Positions (ROI < 0%):
→ holdTimer ≤ 8 bars: timeMultiplier = 1.0 (Early stage, standard requirements)
→ holdTimer 9-16 bars: timeMultiplier = 1.1 (10% stricter requirements)
→ holdTimer 17+ bars: timeMultiplier = 1.3 (30% stricter requirements)
Layer 3: Final Threshold Calculation
finalThreshold = dynamicThreshold × timeMultiplier
Examples:
- Winning Position: 2.8 × 1.0 = 2.8 (Always standard)
- Losing Position (Early): 2.8 × 1.0 = 2.8 (Same as winning initially)
- Losing Position (Extended): 2.8 × 1.3 = 3.64 (Much stricter)
Real-Time Debugging Display:
Smart Exit Section shows:
Score: 3.5 → Current smartScoreLong/Short value
Dynamic Threshold: 2.8 → Base ATR-calculated threshold
Final Threshold: 3.64 (ATR×1.3) → Actual threshold used for decisions
Score Check: FAIL (3.5 vs 3.64) → Pass/Fail based on final comparison
Final Hold: NO HOLD → Actual system decision
Position Status Indicators:
Winner + Early: ATR×1.0 (No pressure)
Winner + Extended: ATR×1.0 (No pressure - winners can run indefinitely)
Loser + Early: ATR×1.0 (Recovery opportunity)
Loser + Extended: ATR×1.1 or ATR×1.3 (Increasing pressure to exit)
MTF Section:
Data Source: Shows whether using MTF Data/EMA Backup/Local EMA
Timeframe: Configured watchtower timeframe setting
Data Valid: Confirms successful MTF data retrieval status
Trend Signal: Higher timeframe directional bias analysis
Close Price: MTF price data availability confirmation
"Composite" Filter:
Composite Section:
Buy Score: Real-time weighted scoring from multiple indicators
Sell Score: Opposing directional signal strength
Threshold: Minimum scores required for signal activation
Components:
Flash/Blink: Momentum acceleration indicators (F = Flash active, B = Blink active)
Individual filter contributions showing which specific signals are firing
"ReEntry" Filter:
ReEntry System:
System: Shows if re-entry feature is Enabled/Disabled
Eligibility: Conditions for new entries in each direction
Performance: Success metrics of re-entry attempts when enabled
🎯 Key Status Indicators
Status Column Symbols:
✓ = Condition met / System active / Signal valid
✗ = Condition not met / System inactive / No signal
⏳ = Cooldown active (waiting period)
✅ = Ready state / Good condition
🔄 = Processing / Transitioning state
🔍 Critical Reading Guidelines
For Active Positions - Smart Exit Priority Reading:
1. First Check Position Type:
ROI ≥ 0% = Winning Position (Standard requirements)
ROI < 0% = Losing Position (Progressive requirements)
2. Check Hold Duration:
Early Stage (≤8 bars): Standard multiplier regardless of ROI
Extended Stage (9-16 bars): Slight pressure on losing positions
Long Stage (17+ bars): Strong pressure on losing positions
3. Score vs Final Threshold Analysis:
Score ≥ Final Threshold = HOLD (Continue position)
Score < Final Threshold = EXIT (Close position)
Watch for timeMultiplier changes as position duration increases
4. Understanding "Why No Hold?"
Common scenarios when Score Check shows FAIL:
Losing position held too long (timeMultiplier increased to 1.1 or 1.3)
Low volatility period (dynamic threshold raised to 2.8)
Signal deterioration (smart score dropped below required level)
MTF conflict (higher timeframe opposing position direction)
For Entry Signal Analysis:
Composite Score Reading: Signal strength relative to threshold requirements
Component Analysis: Individual filter contributions to overall score
EMA Structure: Confirm 3-bar crossover requirement met
Cooldown Status: Ensure sufficient time passed since last exit
For ReEntry Opportunities (when enabled):
System Status: Availability and eligibility for re-engagement
Exit Type Analysis: TP-based exits enable immediate re-entry, SL-based exits require cooldown
Condition Monitoring: Requirements for potential re-entry signals
Debugging Common Issues:
Issue: "Score is high but no hold?"
→ Check Final Threshold vs Score (not Dynamic Threshold)
→ Losing position may have increased timeMultiplier
→ Extended hold duration applying pressure
Issue: "Why different thresholds for same score?"
→ Position ROI status affects multiplier
→ Time elapsed since entry affects multiplier
→ Market volatility affects base threshold
Issue: "MTF conflicts with local signals?"
→ Higher timeframe trend opposing position
→ System designed to exit on MTF conflicts
→ Check MTF Data Valid status
⚡ Performance Optimization Notes
For Better Performance:
Analysis table updates may impact performance on some devices
Use specific filters rather than "All" mode for focused monitoring
Consider disabling during live trading for optimal chart performance
Enable only when needed for debugging or analysis
Strategic Usage:
Monitor "Smart" filter when positions are active for exit timing decisions
Use "Composite" filter during setup phases for signal strength analysis
Reference "ReEntry" filter after position closures for re-engagement opportunities
Track Final Threshold changes to understand exit pressure evolution
Advanced Debugging Workflow:
Position Entry Analysis:
Check Composite score vs threshold
Verify EMA crossover timing (3 bars prior)
Confirm cooldown completion
Hold Decision Monitoring:
Track Score vs Final Threshold progression
Monitor timeMultiplier changes over time
Watch for MTF conflicts
Exit Timing Analysis:
Identify which threshold layer caused exit
Track performance by exit type
Analyze re-entry eligibility
This analysis system provides transparency into strategy decision-making processes, allowing users to understand how signals are generated and positions are managed according to the programmed logic during various market conditions and position states.
SIGNAL TYPES AND CHARACTERISTICS
🔥 Core Momentum Signals
Flash Signal
Calculation: ta.rma(math.abs(close - close ), 5) > ta.sma(math.abs(close - close ), 7)
Purpose: Detects sudden price acceleration using smoothed momentum comparison
Characteristics: Triggers when recent price movement exceeds historical average movement
Usage: Primary momentum confirmation across multiple composite calculations
Weight: 1.3 points in composite scoring
Blink Signal
Calculation: math.abs(ta.change(close, 1)) > ta.sma(math.abs(ta.change(close, 1)), 5)
Purpose: Identifies immediate price velocity spikes
Characteristics: More sensitive than Flash, captures single-bar momentum bursts
Usage: Secondary momentum confirmation, often paired with Flash
Weight: 1.3 points in composite scoring
⚡ Advanced Composite Signals
Apex Pulse Signal
Calculation: apexAngleValue > 30 or apexAngleValue < -30
Purpose: Detects extreme EMA angle momentum
Characteristics: Identifies when trend angle exceeds ±30 degrees
Usage: Confirms directional momentum strength in trend-following scenarios
Pressure Surge Signal
Calculation: volSpike_AVP and strongTrendUp_ATG
Purpose: Combines volume expansion with trend confirmation
Characteristics: Requires both volume spike and strong uptrend simultaneously
Usage: bullish signal for trend continuation
Shift Wick Signal
Calculation: ta.crossunder(ema1, ema2) and isWickTrapDetected and directionFlip
Purpose: Detects bearish reversal with wick trap confirmation
Characteristics: Combines EMA crossunder with upper wick dominance and directional flip
Usage: Reversal signal for trend change identification
🛡️ Trap Exit Protection Signals
Bear Trap Exit
Calculation: isUpperWickTrap and isBearEngulfNow
Conditions: Previous bullish candle with 80%+ upper wick, followed by current bearish engulfing
Purpose: Emergency exit signal for long positions
Priority: Highest - overrides all other hold conditions
Action: Immediate position closure with full state reset
Bull Trap Exit
Calculation: isLowerWickTrap and isBullEngulfNow
Conditions: Previous bearish candle with 80%+ lower wick, followed by current bullish engulfing
Purpose: Emergency exit signal for short positions
Priority: Highest - overrides all other hold conditions
Action: Immediate position closure with full state reset
📊 Technical Analysis Foundation Signals
RSI-MFI Hybrid System
Base Calculation: (ta.rsi(close, 14) + ta.mfi(close, 14)) / 2
Oversold Threshold: < 35
Overbought Threshold: > 65
Weak Condition: < 35 and declining
Strong Condition: > 65 and rising
Usage: Momentum confirmation and reversal identification
ADX-DMI Trend Classification
Strong Up Trend: (adx > 25 and diplus > diminus and (diplus - diminus) > 5) or (ema1 > ema2 and ema2 > ema3 and ta.rising(ema2, 3))
Strong Down Trend: (adx > 20 and diminus > diplus - 5) or (ema1 < ema2 and ta.falling(ema1, 3))
Trend Weakening: adx < adx and adx < adx
Usage: Primary trend direction confirmation
Bollinger Band Squeeze Detection
Calculation: bbWidth < ta.lowest(bbWidth, 20) * 1.2
Purpose: Identifies low volatility periods before breakouts
Usage: Entry filter - avoids trades during consolidation
🎨 Visual Signal Indicators
Red X Signal
Calculation: isBearCandle and ta.crossunder(ema1, ema2)
Visual: Red X above price
Purpose: Bearish EMA crossunder with confirming candle
Composite Weight: +1.0 for short positions, -1.0 for long positions
Characteristics: Simple but effective trend change indicator
Green Dot Signal
Calculation: isBullCandle and ta.crossover(ema1, ema2)
Visual: Green dot below price
Purpose: Bullish EMA crossover with confirming candle
Composite Weight: +1.0 for long positions, -1.0 for short positions
Characteristics: Entry confirmation for trend-following strategies
Blue Diamond Signal
Trigger Conditions: amcBuySignal and score >= 4
Scoring Components: 11 different technical conditions
Key Requirements: AMC bullish + momentum rise + EMA expansion + volume confirmation
Visual: Blue diamond below price
Purpose: Bullish reversal or continuation signal
Characteristics: Multi-factor confirmation requiring 4+ technical alignments
Red Diamond Signal
Trigger Conditions: amcSellSignal and score >= 5
Scoring Components: 11 different technical conditions (stricter than Blue Diamond)
Key Requirements: AMC bearish + momentum crash + EMA compression + volume decline
Visual: Red diamond above price
Purpose: Potential bearish reversal or continuation signal
Characteristics: Requires higher threshold (5 vs 4) for more selective triggering
🔵 Specialized Detection Signals
Blue Dot Signal
Calculation: volumePulse and isCandleStrong and volIsHigh
Requirements: Volume > 2.0x MA, strong candle body > 35% of range, volume MA > 55
Purpose: Volume-confirmed momentum signal
Visual: Blue dot above price
Characteristics: Volume-centric signal for high-liquidity environments
Orange X Signal
Calculation: Complex multi-factor oversold reversal detection
Requirements: AMC oversold + wick trap + flash/blink + RSI-MFI oversold + bullish flip
Purpose: Oversold bounce signal with multiple confirmations
Visual: Orange X below price
Characteristics: Reversal signal requiring 5+ simultaneous conditions
VSS (Velocity Signal System)
Components: Volume spike + EMA angle + trend direction
Buy Signal: vssTrigger and vssTrendDir == 1
Sell Signal: vssTrigger and vssTrendDir == -1
Visual: Green/Red triangles
Purpose: Velocity-based momentum detection
Characteristics: Fast-response signal for momentum trading
⭐ Elite Composite Signals
Star Uprising Signal
Base Requirements: entryCompositeBuySignal and echoBodyLong and strongUpTrend and isAMCUp
Additional Confirmations: RSI hybrid strong + not high risk
Special Conditions: At bottom zone OR RSI bottom bounce OR strong volume bounce
Visual: Star symbol below price
Purpose: Bullish reversal signal from oversold conditions
Characteristics: Most selective bullish signal requiring multiple confirmations
Ultra Short Signal
Scoring System: 7-component scoring requiring 4+ points
Key Components: EMA trap + volume decline + RSI weakness + composite confirmation
Additional Requirements: Falling EMA structure + volume spike + flash confirmation
Visual: Explosion emoji above price
Purpose: Aggressive short entry for trend reversal or continuation
Characteristics: Complex multi-layered signal for experienced short selling
🎯 Composite Signal Architecture
Enhanced Composite Scoring
Long Composite: 15+ weighted components including structure, momentum, flash/blink, volume, price action, reversal triggers, trend alignment
Short Composite: Mirror structure with bearish bias
Threshold: 5.0 points required for signal activation
Conflict Resolution: If both long and short signals trigger simultaneously, both are disabled
Final Validation: Requires EMA momentum confirmation (ta.rising(emaFast_ATG, 2) for longs, ta.falling(emaFast_ATG, 2) for shorts)
Risk Assessment Integration
High Risk Long: RSI > 70 OR close > upper Bollinger Band 80%
High Risk Short: RSI < 30 OR close < lower Bollinger Band 80%
Zone Analysis: Top zone (95% of 50-bar high) vs Bottom zone (105% of 50-bar low)
Risk Penalty: High risk conditions subtract 1.5 points from composite scores
This signal architecture creates a multi-layered detection system where simple momentum signals provide foundation, technical analysis adds structure, visual indicators offer clarity, specialized detectors capture different market conditions, and composite signals identify potential opportunities while integrated risk assessment is designed to filter risky entries.
VISUAL FEATURES SHOWCASE
Ichimoku Cloud Visualization
Dynamic Color Intensity: Cloud transparency adapts to momentum strength - darker colors indicate stronger directional moves, while lighter transparency shows weakening momentum phases.
Gradient Color Mapping: Bullish momentum renders blue-purple spectrum with increasing opacity, while bearish momentum displays corresponding color gradients with intensity-based transparency.
Real-time Momentum Feedback: Color saturation provides immediate visual feedback on market structure strength, allowing traders to assess levels at a glance without additional indicators.
EMA Ribbon Bands
The 8-level exponential moving average system creates a comprehensive trend structure map with gradient color coding.
Signal Type Visualization
STRATEGY PROPERTIES & BACKTESTING DISCLOSURE
📊 Default Strategy Configuration:
✅ Initial Capital: 100,000 USD (realistic for average traders)
✅ Commission: 0.075% per trade (realistic exchange fees)
✅ Slippage: 3 ticks (market impact consideration)
✅ Position Size: 5% equity per trade (sustainable risk level)
✅ Pyramiding: Disabled (single position management)
✅ Sample Size: 185 trades over 12-month backtesting period
✅ Risk Management: Adaptive stop loss with maximum 1% risk per trade
COMPREHENSIVE BACKTESTING RESULTS
Testing Period & Market Conditions:
Backtesting Period: June 25, 2024 - June 25, 2025 (12 months)
Timeframe: 15-minute charts (MTF system active)
Market: BTCUSDT (Bitcoin/Tether)
Market Conditions: Full market cycle including volatility periods
Deep Backtesting: Enabled for maximum accuracy
📈 Performance Summary:
Total Return: +2.19% (+2,193.59 USDT)
Total Trades Executed: 185 trades
Win Rate: 34.05% (63 winning trades out of 185)
Profit Factor: 1.295 (gross profit ÷ gross loss)
Maximum Drawdown: 0.65% (653.17 USDT)
Risk-Adjusted Returns: Consistent with conservative risk management approach
📊 Detailed Trade Analysis:
Position Distribution:
Long Positions: 109 trades (58.9%) | Win Rate: 36.70%
Short Positions: 76 trades (41.1%) | Win Rate: 30.26%
Average Trade Duration: Optimized for 15-minute timeframe efficiency
Profitability Metrics:
Average Profit per Trade: 11.74 USDT (0.23%)
Average Winning Trade: 151.17 USDT (3.00%)
Average Losing Trade: 60.27 USDT (1.20%)
Win/Loss Ratio: 2.508 (winners are 2.5x larger than losses)
Largest Single Win: 436.02 USDT (8.69%)
Largest Single Loss: 107.41 USDT (controlled risk management)
💰 Financial Performance Breakdown:
Gross Profit: 9,523.93 USDT (9.52% of capital)
Gross Loss: 7,352.48 USDT (7.35% of capital)
Net Profit After Costs: 2,171.44 USDT (2.17%)
Commission Costs: 1,402.47 USDT (realistic trading expenses)
Maximum Equity Run-up: 2,431.66 USDT (2.38%)
⚖️ Risk Management Validation:
Maximum Drawdown: 0.65% showing controlled risk management
Drawdown Recovery: Consistent equity curve progression
Risk per Trade: Successfully maintained below 1.5% per position
Position Sizing: 5% equity allocation proved sustainable throughout testing period
📋 Strategy Performance Characteristics:
✅ Strengths Demonstrated:
Controlled Risk: Maximum drawdown well below industry standards (< 1%)
Positive Expectancy: Win/loss ratio of 2.5+ creates profitable edge
Consistent Performance: Steady equity curve without extreme volatility
Realistic Costs: Includes actual commission and slippage impacts
Sample Size: 185 trades during testing period
⚠️ Performance Considerations:
Win Rate: 34% win rate requires discipline to follow system signals
Market Dependency: Performance may vary significantly in different market conditions
Timeframe Sensitivity: Optimized for 15-minute charts; other timeframes may show different results
Slippage Impact: Real trading conditions may affect actual performance
📊 Benchmark Comparison:
Strategy Return: +2.19% over 12 months
Buy & Hold Bitcoin: +71.12% over same period
Strategy Advantage: Significantly lower drawdown and volatility
Risk-Adjusted Performance: Different risk profile compared to holding cryptocurrency
🎯 Real-World Application Insights:
Expected Trading Frequency:
Average: 15.4 trades per month (185 trades ÷ 12 months)
Weekly Frequency: Approximately 3-4 trades per week
Active Management: Requires regular monitoring during market hours
Capital Requirements:
Minimum Used in Testing: $10,000 for sustainable position sizing
Tested Range: $50,000-$100,000 for comfortable risk management
Commission Impact: 0.075% per trade totaled 1.4% of capital over 12 months
⚠️ IMPORTANT BACKTESTING DISCLAIMERS:
📈 Performance Reality:
Past performance does not guarantee future results. Backtesting results represent hypothetical performance and may not reflect actual trading outcomes due to market changes, execution differences, and emotional factors.
🔄 Market Condition Dependency:
This strategy's performance during the tested period may not be representative of performance in different market conditions, volatility regimes, or trending vs. sideways markets.
💸 Cost Considerations:
Actual trading costs may vary based on broker selection, market conditions, and trade size. Commission rates and slippage assumptions may differ from real-world execution.
🎯 Realistic Expectations:
The 34% win rate requires psychological discipline to continue following signals during losing streaks. Risk management and position sizing are critical for replicating these results.
⚡ Technology Dependencies:
Strategy performance assumes reliable internet connection, platform stability, and timely signal execution. Technical failures may impact actual results.
CONFIGURATION OPTIMIZATION
5-Minute Timeframe Optimization (Advanced Users Only)
⚠️ Important Warning: 5-minute timeframes operate without MTF confirmation, resulting in reduced signal quality and higher false signal rates.
Example 5-Minute Parameters:
Composite Thresholds: Long 6.5, Short 7.0 (vs 15M default 5.0/5.4)
Signal Lookback Bars: 12 (vs 15M default 8)
Volume Multiplier: 2.2 (vs 15M default 1.8)
MTF Timeframe: Disabled (automatic below 30M)
Risk Management Adjustments:
Position Size: Reduce to 3% (vs 5% default)
TP1: 0.8%, TP2: 1.2%, TP3: 2.0% (tighter targets)
SL: 0.8% (tighter stop loss)
Cooldown Minutes: 8 (vs 5 default)
Usage Notes for 5-Minute Trading:
- Wait for higher composite scores before entry
- Require stronger volume confirmation
- Monitor EMA structure more closely
15-Minute Scalping Setup:
TP1: 1.0%, TP2: 1.5%, TP3: 2.5%
Composite Threshold: 5.0 (higher filtering)
TP ATR Multiplier: 7.0
SL ATR Multiplier: 2.5
Volume Multiplier: 1.8 (requires stronger confirmation)
Hold Time: 2 bars minimum
3-Hour Swing Setup:
TP1: 2.0%, TP2: 4.0%, TP3: 8.0%
Composite Threshold: 4.5 (more signals)
TP ATR Multiplier: 8.0
SL ATR Multiplier: 3.2
Volume Multiplier: 1.2
Hold Time: 6 bars minimum
Market-Specific Adjustments
High Volatility Periods:
Increase ATR multipliers (TP: 2.0x, SL: 1.2x)
Raise composite thresholds (+0.5 points)
Reduce position size
Enable cooldown periods
Low Volatility Periods:
Decrease ATR multipliers (TP: 1.2x, SL: 0.8x)
Lower composite thresholds (-0.3 points)
Standard position sizing
Disable extended cooldowns
News Events:
Temporarily disable strategy 30 minutes before major releases
Increase volume requirements (2.0x multiplier)
Reduce position sizes by 50%
Monitor for unusual price action
RISK MANAGEMENT
Dual ROI System: Adaptive vs Fixed Mode
Adaptive RR Mode:
Uses ATR (Average True Range) for automatic adjustment
TP1: 1.0x ATR from entry price
TP2: 1.5x ATR from entry price
TP3: 2.0x ATR from entry price
Stop Loss: 1.0x ATR from entry price
Automatically adjusts to market volatility
Fixed Percentage Mode:
Uses predetermined percentage levels
TP1: 1.0% (default)
TP2: 1.5% (default)
TP3: 2.5% (default)
Stop Loss: 0.9% total (0.6% risk tolerance + 0.3% slippage buffer)(default)
Consistent levels regardless of volatility
Mode Selection: Enable "Use Adaptive RR" for ATR-based targets, disable for fixed percentages. Adaptive mode works better in varying volatility conditions, while fixed mode provides predictable risk/reward ratios.
Stop Loss Management
In Adaptive SL Mode:
Automatically scales with market volatility
Tight stops during low volatility (smaller ATR)
Wider stops during high volatility (larger ATR)
Include 0.3% slippage buffer in both modes
In Fixed Mode:
Consistent percentage-based stops
2% for crypto, 1.5% for forex, 1% for stocks
Manual adjustment needed for different market conditions
Trailing Stop System
Configuration:
Enable Trailing: Activates dynamic stop loss adjustment
Start Trailing %: Profit level to begin trailing (default 1.0%)
Trailing Offset %: Distance from current price (default 0.5%)
Close if Return to Entry: Optional immediate exit if price returns to entry level
Operation: Once position reaches trailing start level, stop loss automatically adjusts upward (longs) or downward (shorts) maintaining the offset distance from favorable price movement.
Timeframe-Specific Risk Considerations
15-Minute and Above (Tested):
✅ Full MTF system active
✅ Standard risk parameters apply
✅ Backtested performance metrics valid
✅ Standard position sizing (5%)
5-Minute Timeframes (Advanced Only):
⚠️ MTF system inactive - local signals only
⚠️ Higher false signal rate expected
⚠️ Reduced position sizing preferred (3%)
⚠️ Tighter stop losses required (0.8% vs 1.2%)
⚠️ Requires parameter optimization
⚠️ Monitor performance closely
1-Minute Timeframes (Limited Testing):
❌ Excessive noise levels
❌ Strategy not optimized for this frequency
Risk Management Practices
Allocate no more than 5% of your total investment portfolio to high-risk trading
Never trade with funds you cannot afford to lose
Thoroughly backtest and validate the strategy with small amounts before full implementation
Always maintain proper risk management and stop-loss settings
IMPORTANT DISCLAIMERS
Performance Disclaimer
Past performance does not guarantee future results. All trading involves substantial risk of loss. This strategy is provided for informational purposes and does not constitute financial advice.
Market Risk
Cryptocurrency and forex markets are highly volatile. Prices can move rapidly against positions, resulting in significant losses. Users should never risk more than they can afford to lose.
Strategy Limitations
This strategy relies on technical analysis and may not perform well during fundamental market shifts, news events, or unprecedented market conditions. No trading strategy can guarantee 100% success or eliminate the risk of loss.
Legal Compliance
You are responsible for compliance with all applicable regulations and laws in your jurisdiction. Consult with licensed financial professionals when necessary.
User Responsibility
Users are responsible for their own trading decisions, risk management, and compliance with applicable regulations in their jurisdiction.

Multi Fibonacci Supertrend with Signals【FIbonacciFlux】Multi Fibonacci Supertrend with Signals (MFSS)
Overview
The Multi Fibonacci Supertrend with Signals (MFSS) is an advanced technical analysis tool that combines multiple Supertrend indicators using Fibonacci ratios to identify trend directions and potential trading opportunities.
Key Features
1. Fibonacci-Based Supertrend Levels
* Factor 1 (Weak) : 0.618 - The golden ratio
* Factor 2 (Medium) : 1.618 - The Fibonacci ratio
* Factor 3 (Strong) : 2.618 - The extension ratio
2. Visual Components
* Multi-layered Trend Lines
* Different line weights for easy identification
* Progressive transparency from Factor 1 to Factor 3
* Color-coded trend directions (Green for bullish, Red for bearish)
* Dynamic Fill Areas
* Gradient fills between price and trend lines
* Visual representation of trend strength
* Automatic color adjustment based on trend direction
* Signal Indicators
* Clear BUY/SELL labels on chart
* Position-adaptive signal placement
* High-visibility color scheme
3. Signal Generation Logic
The system generates signals based on two key conditions:
* Primary Condition :
* BUY : Price crossunder Supertrend2 (Factor 1.618)
* SELL : Price crossover Supertrend2 (Factor 1.618)
* Confirmation Filter :
* Signals only trigger when Supertrend3 confirms the trend direction
* Reduces false signals in volatile markets
Technical Details
Input Parameters
* ATR Period : 10 (default)
* Customizable for different market conditions
* Affects sensitivity of all Supertrend levels
* Factor Settings :
* All factors are customizable
* Default values based on Fibonacci sequence
* Minimum value: 0.01
* Step size: 0.01
Alert System
* Built-in alert conditions
* Customizable alert messages
* Real-time notification support
Use Cases
* Trend Trading
* Identify strong trend directions
* Filter out weak signals
* Confirm trend continuations
* Risk Management
* Multiple trend levels for stop-loss placement
* Clear entry and exit signals
* Trend strength visualization
* Market Analysis
* Multi-timeframe analysis capability
* Trend strength assessment
* Market structure identification
Benefits
* Reliability
* Based on proven Supertrend algorithm
* Enhanced with Fibonacci mathematics
* Multiple confirmation levels
* Clarity
* Clear visual signals
* Easy-to-interpret interface
* Reduced noise in signal generation
* Flexibility
* Customizable parameters
* Adaptable to different markets
* Suitable for various trading styles
Performance Considerations
* Optimized code structure
* Efficient calculation methods
* Minimal resource usage
Installation and Usage
Setup
* Add indicator to chart
* Adjust parameters if needed
* Enable alerts as required
Best Practices
* Use with other confirmation tools
* Adjust factors based on market volatility
* Consider timeframe appropriateness
Backtesting Results and Strategy Performance
This indicator is specifically designed for pullback trading with optimized risk-reward ratios in trend-following strategies. Below are the detailed backtesting results from our proprietary strategy implementation:
BTCUSDT Performance (Binance)
* Test Period: Approximately 7 years
* Risk-Reward Ratio: 2:1
* Take Profit: 8%
* Stop Loss: 4%
Key Metrics (BTCUSDT):
* Net Profit: +2,579%
* Total Trades: 551
* Win Rate: 44.8%
* Profit Factor: 1.278
* Maximum Drawdown: 42.86%
ETHUSD Performance (Binance)
* Risk-Reward Ratio: 4.33:1
* Take Profit: 13%
* Stop Loss: 3%
Key Metrics (ETHUSD):
* Net Profit: +8,563%
* Total Trades: 581
* Win Rate: 32%
* Profit Factor: 1.32
* Maximum Drawdown: 55%
Strategy Highlights:
* Optimized for pullback trading in strong trends
* Focus on high risk-reward ratios
* Proven effectiveness in major cryptocurrency pairs
* Consistent performance across different market conditions
* Robust profit factor despite moderate win rates
Note: These results are from our proprietary strategy implementation and should be used as reference only. Individual results may vary based on market conditions and implementation.
Important Considerations:
* The strategy demonstrates strong profitability despite lower win rates, emphasizing the importance of proper risk-reward ratios
* Higher drawdowns are compensated by significant overall returns
* The system shows adaptability across different cryptocurrencies with consistent profit factors
* Results suggest optimal performance in volatile crypto markets
Real Trading Examples
BTCUSDT 4-Hour Chart Analysis
Example of pullback strategy implementation on Bitcoin, showing clear trend definition and entry points
ETHUSDT 4-Hour Chart Analysis
Ethereum chart demonstrating effective signal generation during strong trends
BTCUSDT Detailed Signal Example (15-Minute Scalping)
Close-up view of signal generation and trend confirmation process on 15-minute timeframe, demonstrating the indicator's effectiveness for scalping operations
Chart Analysis Notes:
* Green and red zones clearly indicate trend direction
* Multiple timeframe confirmation visible through different Supertrend levels
* Clear entry signals during pullbacks in established trends
* Precise stop-loss placement opportunities below support levels
Implementation Guidelines:
* Wait for main trend confirmation from Factor 3 (2.618)
* Enter trades on pullbacks to Factor 2 (1.618)
* Use Factor 1 (0.618) for fine-tuning entry points
* Place stops below the relevant Supertrend level
Footnotes:
* Charts provided are from Binance exchange, using both 4-hour and 15-minute timeframes
* Trading view screenshots captured during actual market conditions
* Indicators shown: Multi Fibonacci Supertrend with all three factors
* Time period: Recent market activity showing various market conditions
Important Notice:
These charts are for educational purposes only. Past performance does not guarantee future results. Always conduct your own analysis and risk management.
Disclaimer
This indicator is for informational purposes only. Past performance is not indicative of future results. Always conduct proper risk management and due diligence.
License
Open source under MIT License
Author's Note
Contributions and suggestions for improvement are welcome. Please feel free to fork and enhance.

Briss Thorn XtremeStrategy Description: Briss Thorn Xtreme
The Briss Thorn Xtreme is an innovative trading strategy designed to identify and capitalize on opportunities in the forex market through advanced technical analysis and dynamic risk management. This strategy combines calculations based on RSI and ATR with time and day filters, providing customized signals and real-time alerts via Discord. Ideal for traders seeking a structured and highly customizable methodology, Briss Thorn Xtreme integrates enhanced visual tools for efficient trade management.
Key Features:
RSI and ATR-Based Signals: Utilizes smoothed RSI and ATR calculations to identify trends and measure volatility, allowing for more precise detection of buy and sell opportunities.
Dynamic Stop-Loss (SL) and Take-Profit (TP) Levels: Automatically calculates SL and TP levels based on market volatility, dynamically adjusting to optimize risk management.
Advanced Discord Integration: Sends detailed alerts to your Discord channel, including information such as the asset, signal time, entry price, and SL/TP levels, facilitating real-time decision-making.
Complete Customization: Allows users to adjust key parameters such as RSI periods, smoothing factors, liquidity thresholds, trading schedules, and operation days, adapting to different trading styles and market conditions.
Enhanced Chart Visualization: Includes visual elements like candle color changes based on trend, colored boxes for SL and TP, and a summary table of recent trades, enabling quick market interpretation.
Day and Time Operation Filters: Enables selection of specific days of the week and time slots during which signals are generated, optimizing market exposure and avoiding periods of low liquidity or unwanted high volatility.
Trade Summary: Displays a summary of the last three trades directly on the chart, indicating whether TP or SL was reached, aiding in strategy performance evaluation.
Customizable Alert Messages: Allows customization of messages sent to Discord for buy and sell signals, tailoring them to your specific preferences and requirements.
Additional Visual Tools: Highlights the operational range on the chart during permitted trading hours and colors candles based on the current trend (bullish, bearish, or neutral), enhancing visibility and decision-making.
How the Strategy Works:
Technical Indicators Calculation:
- RSI (Relative Strength Index) : Calculates RSI with a defined period and smooths it using an Exponential Moving Average (EMA) to obtain a more stable and reliable signal.
- ATR (Average True Range) : Calculates ATR adjusted by a rapid liquidity factor to measure the current market volatility, thereby determining the strength of the trend.
Generating Buy and Sell Signals:
- Buy Signal: A buy signal is generated when the liquidity index surpasses the short liquidity level, indicating potential accumulation and an upward trend.
- Sell Signal: A sell signal is generated when the liquidity index falls below the long liquidity level, indicating potential distribution and a downward trend.
- Operation Conditions: Signals are only generated on selected days and times, avoiding periods of low liquidity or unwanted high volatility.
Dynamic SL and TP Levels Calculation:
- Stop-Loss (SL) and Take-Profit (TP): SL and TP levels are calculated based on the entry price and a defined number of ticks, automatically adjusting to market volatility to optimize risk management.
- SL and TP Visualization: Colored boxes are drawn on the chart for a clear visual reference of SL and TP levels, facilitating trade management.
Automatic Execution and Alerts:
- Order Execution: Upon signal generation, the strategy automatically executes a market order (buy or sell).
- Discord Alerts: Detailed alerts are sent to the configured Discord channel, providing essential information for swift decision-making, including asset, signal time, entry price, current volatility (ATR), and trend direction.
Trade Management and Monitoring:
- Trade Summary: A table on the chart displays a summary of the last three trades (Today, Yesterday, Day Before Yesterday), indicating whether TP or SL was reached, allowing real-time performance evaluation.
- Automatic Trade Closure: The strategy automatically closes trades upon reaching the established SL or TP levels, ensuring efficient risk management and preventing excessive losses.
Additional Visualization:
- Candle Coloring by Trend: Candles are colored based on the current trend (bullish, bearish, or neutral), facilitating quick identification of market direction.
- Operational Range Highlighting: The chart background is colored during permitted trading hours, highlighting active periods of the strategy and enhancing trade visibility.
---
Strategy Properties (Important)
This backtest is conducted on M17 EURUSD using the following backtesting properties:
Initial Capital: $1000
Order Size: 1% of capital
Commission: $0.20 per order
Slippage: 1 tick
Pyramiding: 1 order
Price Verification for Limit Orders: 0 ticks
Recalculate on Order Execution: Enabled
Recalculate on Every Tick: Enabled
Recalculate After Order Execution: Enabled
Bar Magnifier for Backtesting Precision: Enabled
These properties ensure a realistic preview of the backtesting system. Note that default properties may vary for different reasons:
Order Size: It is essential to calculate the contract size according to the traded asset and desired risk level.
Commission and Slippage: These costs may vary depending on the market and instrument; there is no default value that guarantees realistic results.
All users are strongly recommended to adjust the properties within the script settings to align them with their trading accounts and platforms, ensuring that strategy results are realistic.
---
Backtesting Results:
- Net Profit: $327.90 (32.79%)
- Total Closed Trades: 162
- Profit Percentage: 35.80%
- Profit Factor: 1.298
- Maximum Drawdown: $146.70 (10.27%)
- Average per Trade: $2.02 (0.02%)
- Average Bars per Trade: 22
These results were obtained under the mentioned conditions and properties, providing an overview of the strategy's historical performance.
---
Interpretation of Results:
- The strategy has demonstrated profitability over the analyzed period, albeit with a success rate of 32.79%, indicating that success depends on a favorable risk-reward ratio.
- The profit factor of 1.298 suggests that total gains exceed total losses by this proportion.
- It is crucial to consider the maximum drawdown of 10.27% when evaluating the strategy's suitability to your risk tolerance.
---
Risk Warning:
Trading with leveraged financial instruments involves a high level of risk and may not be suitable for all investors. Before deciding to trade, you should carefully consider your investment objectives, level of experience, and risk tolerance. Past performance does not guarantee future results. It is essential to perform additional testing and adjust the strategy according to your needs.
---
What Makes This Strategy Original?
Unique RSI and Liquidity Focus: Unlike conventional strategies, Briss Thorn Xtreme focuses on combining RSI analysis with liquidity parameters to reflect institutional activity and macroeconomic events that may influence the market.
Advanced Technological Integration: The combination of automatic execution and customized alerts via Discord provides an efficient and modern tool for active traders.
Customization and Adaptability: The wide range of adjustable parameters allows the strategy to adapt to different assets, time zones, and trading styles, offering flexibility and complete user control.
Enhanced Visual Tools: Integrated visual elements, such as candle coloring, SL/TP boxes, and summary tables, facilitate quick market interpretation and informed decision-making.
---
Additional Considerations
Continuous Testing and Optimization: Users are advised to perform additional backtests and optimize parameters based on their own observations and requirements.
Complementary Analysis: Use this strategy in conjunction with other indicators and fundamental analysis tools to reinforce decision-making and confirm generated signals.
Rigorous Risk Management: Ensure that SL and TP levels, as well as position sizes, are aligned with your risk management plan to avoid excessive losses.
Updates and Support: I am committed to providing updates and improvements based on community feedback. For inquiries or suggestions, feel free to contact me.
---
Example Configuration
Assuming you want to use the strategy with the following parameters:
Discord Webhook: Your unique Discord Webhook
RSI Period: 6
RSI Smoothing Factor: 5
Rapid Liquidity Factor: 5
Liquidity Threshold: 5
SL Ticks: 100
TP Ticks: 250
SL/TP Box Width: 25 bars
Trading Days: Monday, Tuesday, Wednesday, Thursday, Friday
Trading Hours: Start at 8:00, End at 11:00
Simulated Initial Capital: $1000
Risk per Trade in Simulation: 1% of capital
Slippage and Commissions in Simulation: 1 tick slippage and $0.20 commission per trade
---
Conclusion
The Briss Thorn Xtreme strategy offers an innovative approach by combining advanced technical analysis with dynamic risk management and modern technological tools. Its original and adaptable design makes it a valuable tool for traders looking to diversify their methods and capitalize on opportunities based on less conventional patterns. Ready for immediate implementation in TradingView, this strategy can enhance your trading arsenal and contribute to a more informed and structured approach in your operations.
---
Final Disclaimer:
Financial markets are volatile and can present significant risks. This strategy should be used as part of a comprehensive trading approach and does not guarantee positive results. It is always advisable to consult with a professional financial advisor before making investment decisions.

RSI Shifting Band Oscillator | QuantMAC📊 RSI Shifting Band Oscillator | QuantMAC
🎯 Overview
The RSI Shifting Band Oscillator represents a breakthrough in adaptive technical analysis, combining the innovative dual-stage RSI processing with dynamic volatility bands to create an oscillator that automatically adjusts to changing market momentum conditions. This cutting-edge indicator goes beyond traditional static approaches by using smoothed RSI to dynamically shift band width based on momentum transitions, providing superior signal accuracy across different market regimes.
🔧 Key Features
Revolutionary Dual RSI Technology: Proprietary two-stage RSI calculation with exponential smoothing that measures momentum transitions in real-time
Dynamic Adaptive Bands: Self-adjusting volatility bands that expand and contract based on RSI distance from equilibrium
Dual Trading Modes: Flexible Long/Short or Long/Cash strategies for different trading preferences
Advanced Performance Analytics: Comprehensive metrics including Sharpe, Sortino, and Omega ratios
Smart Visual System: Dynamic color coding with 9 professional color schemes
Precision Backtesting: Date range filtering with detailed historical performance analysis
Real-time Signal Generation: Clear entry/exit signals with customizable threshold sensitivity
Position Sizing Intelligence: Half Kelly criterion for optimal risk management
📈 How The Dual RSI Technology Works
The Dual RSI system is the heart of this indicator's innovation. Unlike traditional RSI implementations, this approach analyzes the smoothed momentum transitions between different RSI states, providing early warning signals for momentum regime changes.
RSI Calculation Process:
Calculate traditional RSI using specified length and price source
Apply exponential moving average smoothing to reduce noise
Measure RSI distance from neutral 50 level to determine momentum strength
Use RSI deviation to dynamically adjust standard deviation multipliers
Create adaptive bands that respond to momentum conditions
Generate normalized oscillator values for clear signal interpretation
The genius of this dual RSI approach lies in its ability to detect when markets are transitioning between momentum and consolidation periods before traditional indicators catch up. This provides traders with a significant edge in timing entries and exits.
⚙️ Comprehensive Parameter Control
RSI Settings:
RSI Length: Controls the lookback period for momentum analysis (default: 14)
RSI Smoothing: Reduces noise in RSI calculations using EMA (default: 20)
Source: Price input selection (close, open, high, low, etc.)
Oscillator Settings:
Base Length: Foundation moving average for band calculations (default: 40)
Standard Deviation Length: Period for volatility measurement (default: 26)
SD Multiplier: Base band width adjustment (default: 2.7)
Oscillator Multiplier: Scaling factor for oscillator values (default: 100)
Signal Thresholds:
Long Threshold: Bullish signal trigger level (default: 90)
Short Threshold: Bearish signal trigger level (default: 56)
🎨 Advanced Visual System
Main Chart Elements:
Dynamic Shifting Bands: Upper and lower bands that automatically adjust width based on RSI momentum
Adaptive Fill Zone: Color-coded area between bands showing current market state
Basis Line: Moving average foundation displayed as subtle reference points
Smart Bar Coloring: Candles change color based on oscillator state for instant visual feedback
Oscillator Pane:
Normalized RSI Oscillator: Main signal line centered around zero with dynamic coloring
Threshold Lines: Horizontal reference lines for entry/exit levels
Zero Line: Central reference for oscillator neutrality
Color State Indication: Line colors change based on bullish/bearish conditions
📊 Professional Performance Metrics
The built-in analytics suite provides institutional-grade performance measurement:
Net Profit %: Total strategy return percentage
Maximum Drawdown %: Worst peak-to-trough decline
Win Rate %: Percentage of profitable trades
Profit Factor: Ratio of gross profits to gross losses
Sharpe Ratio: Risk-adjusted return measurement
Sortino Ratio: Downside-focused risk adjustment
Omega Ratio: Probability-weighted performance ratio
Half Kelly %: Optimal position sizing recommendation
Total Trades: Complete transaction count
🎯 Strategic Trading Applications
Long/Short Mode: ⚡
Maximizes profit potential by capturing both upward and downward price movements. The dual RSI technology helps identify when momentum is strengthening or weakening, allowing for optimal position switches between long and short.
Long/Cash Mode: 🛡️
Conservative approach ideal for retirement accounts or risk-averse traders. The indicator's adaptive nature helps identify the best times to be invested versus sitting in cash, protecting capital during adverse market conditions.
🚀 Unique Advantages
Traditional Indicators vs RSI Shifting Bands:
Static vs Dynamic: While most indicators use fixed parameters, RSI bands adapt in real-time
Lagging vs Leading: Dual RSI detects momentum transitions before they fully manifest
One-Size vs Adaptive: The same settings work across different market conditions
Simple vs Intelligent: Advanced momentum analysis provides superior market insight
💡 Professional Setup Guide
For Day Trading (Short-term):
RSI Length: 10-12
RSI Smoothing: 15-18
Base Length: 25-30
Thresholds: Long 85, Short 60
For Swing Trading (Medium-term):
RSI Length: 14-16 (default range)
RSI Smoothing: 20-25
Base Length: 40-50
Thresholds: Long 90, Short 56 (defaults)
For Position Trading (Long-term):
RSI Length: 18-21
RSI Smoothing: 25-30
Base Length: 60-80
Thresholds: Long 92, Short 50
🧠 Advanced Trading Techniques
RSI Divergence Analysis:
Watch for divergences between price action and smoothed RSI readings. When price makes new highs/lows but RSI doesn't confirm, it often signals upcoming reversals.
Band Width Interpretation:
Expanding Bands: Increasing momentum, expect larger price moves
Contracting Bands: Decreasing momentum, prepare for potential breakouts
Band Touches: Price touching outer bands often signals reversal opportunities
Multi-Timeframe Analysis:
Use RSI oscillator on higher timeframes for trend direction and lower timeframes for precise entry timing.
⚠️ Important Risk Disclaimers
Past performance is not indicative of future results. This indicator represents advanced technical analysis but should never be used as the sole basis for trading decisions.
Critical Risk Factors:
Market Conditions: No indicator performs equally well in all market environments
Backtesting Limitations: Historical performance may not reflect future market behavior
Momentum Risk: Adaptive indicators can be sensitive to extreme momentum conditions
Parameter Sensitivity: Different settings may produce significantly different results
Capital Risk: Always use appropriate position sizing and stop-loss protection
📚 Educational Benefits
This indicator provides exceptional learning opportunities for understanding:
Advanced RSI analysis and momentum measurement techniques
Adaptive indicator design and implementation
The relationship between momentum transitions and price movements
Professional risk management using Kelly Criterion principles
Modern oscillator interpretation and signal generation
🔍 Market Applications
The RSI Shifting Band Oscillator works across various markets:
Forex: Excellent for currency pair momentum analysis
Stocks: Individual equity and index trading
Commodities: Adaptive to commodity market momentum cycles
Cryptocurrencies: Handles extreme momentum variations effectively
Futures: Professional derivatives trading applications
🔧 Technical Innovation
The RSI Shifting Band Oscillator represents years of research into adaptive technical analysis. The proprietary dual RSI calculation method has been optimized for:
Computational Efficiency: Fast calculation even on high-frequency data
Noise Reduction: Advanced smoothing without excessive lag
Market Adaptability: Automatic adjustment to changing conditions
Signal Clarity: Clear, actionable trading signals
🔔 Updates and Evolution
The RSI Shifting Band Oscillator | QuantMAC continues to evolve with regular updates incorporating the latest research in adaptive technical analysis. The code is thoroughly documented for transparency and educational purposes.
Trading Notice: Financial markets involve substantial risk of loss. The RSI Shifting Band Oscillator is a sophisticated technical analysis tool designed to assist in trading decisions but cannot guarantee profitable outcomes.
---
Master The Markets With Adaptive Intelligence! 🎯📈

888 BOT #backtest█ 888 BOT #backtest (open source)
This is an Expert Advisor 'EA' or Automated trading script for ‘longs’ and ‘shorts’, which uses only a Take Profit or, in the worst case, a Stop Loss to close the trade.
It's a much improved version of the previous ‘Repanocha’. It doesn`t use 'Trailing Stop' or 'security()' functions (although using a security function doesn`t mean that the script repaints) and all signals are confirmed, therefore the script doesn`t repaint in alert mode and is accurate in backtest mode.
Apart from the previous indicators, some more and other functions have been added for Stop-Loss, re-entry and leverage.
It uses 8 indicators, (many of you already know what they are, but in case there is someone new), these are the following:
1. Jurik Moving Average
It's a moving average created by Mark Jurik for professionals which eliminates the 'lag' or delay of the signal. It's better than other moving averages like EMA , DEMA , AMA or T3.
There are two ways to decrease noise using JMA . Increasing the 'LENGTH' parameter will cause JMA to move more slowly and therefore reduce noise at the expense of adding 'lag'
The 'JMA LENGTH', 'PHASE' and 'POWER' parameters offer a way to select the optimal balance between 'lag' and over boost.
Green: Bullish , Red: Bearish .
2. Range filter
Created by Donovan Wall, its function is to filter or eliminate noise and to better determine the price trend in the short term.
First, a uniform average price range 'SAMPLING PERIOD' is calculated for the filter base and multiplied by a specific quantity 'RANGE MULTIPLIER'.
The filter is then calculated by adjusting price movements that do not exceed the specified range.
Finally, the target ranges are plotted to show the prices that will trigger the filter movement.
Green: Bullish , Red: Bearish .
3. Average Directional Index ( ADX Classic) and ( ADX Masanakamura)
It's an indicator designed by Welles Wilder to measure the strength and direction of the market trend. The price movement is strong when the ADX has a positive slope and is above a certain minimum level 'ADX THRESHOLD' and for a given period 'ADX LENGTH'.
The green color of the bars indicates that the trend is bullish and that the ADX is above the level established by the threshold.
The red color of the bars indicates that the trend is down and that the ADX is above the threshold level.
The orange color of the bars indicates that the price is not strong and will surely lateralize.
You can choose between the classic option and the one created by a certain 'Masanakamura'. The main difference between the two is that in the first it uses RMA () and in the second SMA () in its calculation.
4. Parabolic SAR
This indicator, also created by Welles Wilder, places points that help define a trend. The Parabolic SAR can follow the price above or below, the peculiarity that it offers is that when the price touches the indicator, it jumps to the other side of the price (if the Parabolic SAR was below the price it jumps up and vice versa) to a distance predetermined by the indicator. At this time the indicator continues to follow the price, reducing the distance with each candle until it is finally touched again by the price and the process starts again. This procedure explains the name of the indicator: the Parabolic SAR follows the price generating a characteristic parabolic shape, when the price touches it, stops and turns ( SAR is the acronym for 'stop and reverse'), giving rise to a new cycle. When the points are below the price, the trend is up, while the points above the price indicate a downward trend.
5. RSI with Volume
This indicator was created by LazyBear from the popular RSI .
The RSI is an oscillator-type indicator used in technical analysis and also created by Welles Wilder that shows the strength of the price by comparing individual movements up or down in successive closing prices.
LazyBear added a volume parameter that makes it more accurate to the market movement.
A good way to use RSI is by considering the 50 'RSI CENTER LINE' centerline. When the oscillator is above, the trend is bullish and when it is below, the trend is bearish .
6. Moving Average Convergence Divergence ( MACD ) and ( MAC-Z )
It was created by Gerald Appel. Subsequently, the histogram was added to anticipate the crossing of MA. Broadly speaking, we can say that the MACD is an oscillator consisting of two moving averages that rotate around the zero line. The MACD line is the difference between a short moving average 'MACD FAST MA LENGTH' and a long moving average 'MACD SLOW MA LENGTH'. It's an indicator that allows us to have a reference on the trend of the asset on which it is operating, thus generating market entry and exit signals.
We can talk about a bull market when the MACD histogram is above the zero line, along with the signal line, while we are talking about a bear market when the MACD histogram is below the zero line.
There is the option of using the MAC-Z indicator created by LazyBear, which according to its author is more effective, by using the parameter VWAP ( volume weighted average price ) 'Z-VWAP LENGTH' together with a standard deviation 'STDEV LENGTH' in its calculation.
7. Volume Condition
Volume indicates the number of participants in this war between bulls and bears, the more volume the more likely the price will move in favor of the trend. A low trading volume indicates a lower number of participants and interest in the instrument in question. Low volumes may reveal weakness behind a price movement.
With this condition, those signals whose volume is less than the volume SMA for a period 'SMA VOLUME LENGTH' multiplied by a factor 'VOLUME FACTOR' are filtered. In addition, it determines the leverage used, the more volume , the more participants, the more probability that the price will move in our favor, that is, we can use more leverage. The leverage in this script is determined by how many times the volume is above the SMA line.
The maximum leverage is 8.
8. Bollinger Bands
This indicator was created by John Bollinger and consists of three bands that are drawn superimposed on the price evolution graph.
The central band is a moving average, normally a simple moving average calculated with 20 periods is used. ('BB LENGTH' Number of periods of the moving average)
The upper band is calculated by adding the value of the simple moving average X times the standard deviation of the moving average. ('BB MULTIPLIER' Number of times the standard deviation of the moving average)
The lower band is calculated by subtracting the simple moving average X times the standard deviation of the moving average.
the band between the upper and lower bands contains, statistically, almost 90% of the possible price variations, which means that any movement of the price outside the bands has special relevance.
In practical terms, Bollinger bands behave as if they were an elastic band so that, if the price touches them, it has a high probability of bouncing.
Sometimes, after the entry order is filled, the price is returned to the opposite side. If price touch the Bollinger band in the same previous conditions, another order is filled in the same direction of the position to improve the average entry price, (% MINIMUM BETTER PRICE ': Minimum price for the re-entry to be executed and that is better than the price of the previous position in a given %) in this way we give the trade a chance that the Take Profit is executed before. The downside is that the position is doubled in size. 'ACTIVATE DIVIDE TP': Divide the size of the TP in half. More probability of the trade closing but less profit.
█ STOP LOSS and RISK MANAGEMENT.
A good risk management is what can make your equity go up or be liquidated.
The % risk is the percentage of our capital that we are willing to lose by operation. This is recommended to be between 1-5%.
% Risk: (% Stop Loss x % Equity per trade x Leverage) / 100
First the strategy is calculated with Stop Loss, then the risk per operation is determined and from there, the amount per operation is calculated and not vice versa.
In this script you can use a normal Stop Loss or one according to the ATR. Also activate the option to trigger it earlier if the risk percentage is reached. '% RISK ALLOWED'
'STOP LOSS CONFIRMED': The Stop Loss is only activated if the closing of the previous bar is in the loss limit condition. It's useful to prevent the SL from triggering when they do a ‘pump’ to sweep Stops and then return the price to the previous state.
█ BACKTEST
The objective of the Backtest is to evaluate the effectiveness of our strategy. A good Backtest is determined by some parameters such as:
- RECOVERY FACTOR: It consists of dividing the 'net profit' by the 'drawdown’. An excellent trading system has a recovery factor of 10 or more; that is, it generates 10 times more net profit than drawdown.
- PROFIT FACTOR: The ‘Profit Factor’ is another popular measure of system performance. It's as simple as dividing what win trades earn by what loser trades lose. If the strategy is profitable then by definition the 'Profit Factor' is going to be greater than 1. Strategies that are not profitable produce profit factors less than one. A good system has a profit factor of 2 or more. The good thing about the ‘Profit Factor’ is that it tells us what we are going to earn for each dollar we lose. A profit factor of 2.5 tells us that for every dollar we lose operating we will earn 2.5.
- SHARPE: (Return system - Return without risk) / Deviation of returns.
When the variations of gains and losses are very high, the deviation is very high and that leads to a very poor ‘Sharpe’ ratio. If the operations are very close to the average (little deviation) the result is a fairly high 'Sharpe' ratio. If a strategy has a 'Sharpe' ratio greater than 1 it is a good strategy. If it has a 'Sharpe' ratio greater than 2, it is excellent. If it has a ‘Sharpe’ ratio less than 1 then we don't know if it is good or bad, we have to look at other parameters.
- MATHEMATICAL EXPECTATION: (% winning trades X average profit) + (% losing trades X average loss).
To earn money with a Trading system, it is not necessary to win all the operations, what is really important is the final result of the operation. A Trading system has to have positive mathematical expectation as is the case with this script: ME = (0.87 x 30.74$) - (0.13 x 56.16$) = (26.74 - 7.30) = 19.44$ > 0
The game of roulette, for example, has negative mathematical expectation for the player, it can have positive winning streaks, but in the long term, if you continue playing you will end up losing, and casinos know this very well.
PARAMETERS
'BACKTEST DAYS': Number of days back of historical data for the calculation of the Backtest.
'ENTRY TYPE': For '% EQUITY' if you have $ 10,000 of capital and select 7.5%, for example, your entry would be $ 750 without leverage. If you select CONTRACTS for the 'BTCUSDT' pair, for example, it would be the amount in 'Bitcoins' and if you select 'CASH' it would be the amount in $ dollars.
'QUANTITY (LEVERAGE 1X)': The amount for an entry with X1 leverage according to the previous section.
'MAXIMUM LEVERAGE': It's the maximum allowed multiplier of the quantity entered in the previous section according to the volume condition.
The settings are for Bitcoin at Binance Futures (BTC: USDTPERP) in 15 minutes.
For other pairs and other timeframes, the settings have to be adjusted again. And within a month, the settings will be different because we all know the market and the trend are changing.

Scalping Strategy Signal v2 by [INFINITYTRADER]Overview
This Pine Script (v6) implements a scalping strategy that uses higher timeframe data (default: 4H) to generate entry and exit signals, originally designed for the 15-minute timeframe with an option for 30-minute charts. The "Scalping Strategy Signal v2 by " integrates moving averages, RSI, volume, ATR, and candlestick patterns to identify trading opportunities. It features adjustable risk management with ATR-based stop-loss, take-profit, and trailing stops, plus dynamic position sizing based on user-set capital. Trades trigger only on the higher timeframe candle close (e.g., 4H) to limit activity within the same period. This closed-source script offers a structured scalping approach, blending multiple entry methods and risk controls for adaptability across market conditions.
What Makes It Unique
Unlike typical scalping scripts relying on single-indicator triggers (e.g., RSI alone or basic MA crossovers), this strategy combines four distinct entry methods—standard MA crossovers, RSI-based momentum shifts, trend-following shorts, and candlestick pattern logic—evaluated on a 4H timeframe for confirmation. This multi-layered design, paired with re-entry logic after losses and a mix of manual, ATR-based, and trailing exits, aims to balance trade frequency and reliability. The higher timeframe filter adds precision not commonly found in simpler scalping tools, while the 30-minute option enhances consistency by reducing noise.
How It Works
Timeframe Logic
Runs on a base timeframe (designed for 15-minute charts, with a 30-minute option) while pulling data from a user-chosen higher timeframe (default: 4H) for signal accuracy.
Limits entries to the close of each 4H candle, ensuring one trade per period to avoid over-trading in volatile conditions.
Indicators and Data
Moving Averages : Employs 21-period and 50-period simple moving averages on the higher timeframe to detect trends and signal entries/exits.
Volume : Requires volume to exceed 70% of its 20-period average on the higher timeframe for momentum confirmation.
RSI : Uses a 14-period RSI for overbought/oversold filtering and a 6-period RSI for precise entry timing.
ATR : Applies a 14-period Average True Range on the higher timeframe to set adaptive stop-loss and take-profit levels.
Candlestick Patterns : Analyzes consecutive green or red 4H bars for trend continuation signals.
Why These Indicators
The blend of moving averages, RSI, volume, ATR, and candlestick patterns forms a robust scalping framework. Moving averages establish trend context, RSI filters momentum and avoids extremes, volume confirms market activity, ATR adjusts risk to volatility, and candlestick patterns enhance entry timing with price action insights. Together, they target small, frequent moves in flat or trending markets, with the 4H filter reducing false signals common in lower-timeframe scalping.
Entry Conditions
Four entry methods are evaluated at the 4H candle close:
Standard Long Entry: Price crosses above the 21-period moving average, volume exceeds 70% of its 20-period average, and the 1H 14-period RSI is below 70—confirms uptrend momentum.
Special Long Entry: The 6-period RSI crosses above 23, price is more than 1.5 times the ATR from the 21-period moving average, and price exceeds its prior close—targets oversold bounces with a stop-loss at the 4H candle’s low.
Short Entries:
- RSI-Based: The 6-period RSI crosses below 68 with volume support—catches overbought pullbacks.
- Trend-Based: Price crosses below the 21-period moving average, volume is above 70% of its average, and the 1H 14-period RSI is above 30—confirms downtrends.
Red/Green Bar Logic: Two consecutive green 4H bars for longs or red 4H bars for shorts—uses candlestick patterns for continuation, with a tight stop-loss from the base timeframe candle.
Re-Entry Logic
Long : After a losing special long, triggers when the 6-period RSI crosses 27 and price crosses the 21-period moving average.
Short : After a losing short, triggers when the 6-period RSI crosses 50 and price crosses below the 21-period moving average.
Purpose: Offers recovery opportunities with stricter conditions.
Exit Conditions
Manual Exits: Longs close if the 21-period MA crosses below the 50-period MA or the 1H 14-period RSI exceeds 68; shorts close if the 21-period MA crosses above the 50-period MA or RSI drops below 25.
ATR-Based TP/SL: Stop-loss is entry price ± ATR × 1.5 (default); take-profit is ± ATR × 4 (default), checked at 4H close.
Trailing Stop: Adjusts ±6x ATR from peak/trough, closing if price retraces within 1x ATR.
Special/Tight SL: Special longs exit if price opens below the 4H candle’s low; 4th method entries use the base timeframe candle’s low/high, checked every bar.
Position Sizing
Bases trade value on user-set capital (default: 100 USDT), dividing by the higher timeframe close price for dynamic sizing.
Visualization
Displays a table at the bottom-right with current/previous signals, TP/SL levels, equity, trading pair, and trade size—color-coded for clarity (green for buy, red for sell).
Inputs
Initial Capital (USDT): Sets trade value (default: 100, min: 1).
ATR Stop-Loss Multiplier: Adjusts SL distance (default: 1.5, min: 1).
ATR Take-Profit Multiplier: Adjusts TP distance (default: 4, min: 1).
Higher Timeframe: Selects analysis timeframe (options: 1m, 5m, 15m, 30m, 1H, 4H, D, W; default: 4H).
Usage Notes
Intended Timeframe: Designed for 15-minute charts with 4H confirmation for precision and frequency; 30-minute charts improve consistency by reducing noise.
Backtesting: Adjust ATR multipliers and capital to match your asset’s volatility and risk tolerance.
Risk Management: Combines manual, ATR, and trailing exits—monitor to avoid overexposure.
Limitations: 4H candle-close dependency may delay entries in fast markets; RSI/volume filters can reduce trades in low-momentum periods.
Backtest Observations
Tested on BTC/USDT (4H higher timeframe, default settings: Initial Capital: 100 USDT, ATR SL: 1.5x, ATR TP: 4x) across market conditions, comparing 15-minute and 30-minute charts:
Bull Market (Jul 2023 - Dec 2023):
15-Minute: 277 long, 219 short; Win Rate: 42.74%; P&L: 108%; Drawdown: 1.99%; Profit Factor: 3.074.
30-Minute: 257 long, 215 short; Win Rate: 49.58%; P&L: 116.85%; Drawdown: 2.34%; Profit Factor: 3.14.
Notes: Moving average crossovers and green bar patterns suited this bullish phase; 30-minute improved win rate and P&L by filtering weaker signals.
Bear Market (Jan 2022 - Jun 2022):
15-Minute: 262 long, 211 short; Win Rate: 44.4%; P&L: 239.80%; Drawdown: 3.74%; Profit Factor: 3.419.
30-Minute: 250 long, 200 short; Win Rate: 52.22%; P&L: 258.77%; Drawdown: 5.34%; Profit Factor: 3.461.
Notes: Red bar patterns and RSI shorts thrived in the downtrend; 30-minute cut choppy reversals for better consistency.
Flat Market (Jan 2021 - Jun 2021):
15-Minute: 280 long, 208 short; Win Rate: 51.84%; P&L: 340.33%; Drawdown: 9.59%; Profit Factor: 2.924.
30-Minute: 270 long, 209 short; Win Rate: 55.11%; P&L: 315.42%; Drawdown: 7.21%; Profit Factor: 2.598.
Notes: High trade frequency and P&L showed strength in ranges; 30-minute lowered drawdown for better risk control.
Results reflect historical performance on BTC/USDT with default settings—users should test on their assets and timeframes. Past performance does not guarantee future results and is shared only to illustrate the strategy’s behavior.
Why It Works Well in Flat Markets
A "flat market" lacks strong directional trends, with price oscillating around moving averages, as in Jan 2021 - Jun 2021 for BTC/USDT. This strategy excels here because its crossover-based entries trigger frequently in tight ranges. In trending markets, an exit might not be followed by a new entry without a pullback, but flat markets produce multiple crossovers, enabling more trades. ATR-based TP/SL and trailing stops capture these small swings, while RSI and volume filters ensure momentum, driving high P&L and win rates.
Technical Details
Built in Pine Script v6 for TradingView compatibility.
Prevents overlapping trades with long/short checks.
Handles edge cases like zero division and auto-detects the trading pair’s base currency (e.g., BTC from BTCUSDT).
This strategy suits scalpers seeking structured entries and risk management. Test on 15-minute or 30-minute charts to match your style and market conditions.

BullBear with Volume-Percentile TP - Strategy [presentTrading] Happy New Year, everyone! I hope we have a fantastic year ahead.
It's been a while since I published an open script, but it's time to return.
This strategy introduces an indicator called Bull Bear Power, combined with an advanced take-profit system, which is the main innovative and educational aspect of this script. I hope all of you find some useful insights here. Welcome to engage in meaningful exchanges. This is a versatile tool suitable for both novice and experienced traders.
█ Introduction and How it is Different
Unlike traditional strategies that rely solely on price or volume indicators, this approach combines Bull Bear Power (BBP) with volume percentile analysis to identify optimal entry and exit points. It features a dynamic take-profit mechanism based on ATR (Average True Range) multipliers adjusted by volume and percentile factors, ensuring adaptability to diverse market conditions. This multifaceted strategy not only improves signal accuracy but also optimizes risk management, distinguishing it from conventional trading methods.
BTCUSD 6hr performance
Disable the visualization of Bull Bear Power (BBP) to clearly view the Z-Score.
█ Strategy, How it Works: Detailed Explanation
The BBP Strategy with Volume-Percentile TP utilizes several interconnected components to analyze market data and generate trading signals. Here's an overview with essential equations:
🔶 Core Indicators and Calculations
1. Exponential Moving Average (EMA):
- **Purpose:** Smoothens price data to identify trends.
- **Formula:**
EMA_t = (Close_t * (2 / (lengthInput + 1))) + (EMA_(t-1) * (1 - (2 / (lengthInput + 1))))
- Usage: Baseline for Bull and Bear Power.
2. Bull and Bear Power:
- Bull Power: `BullPower = High_t - EMA_t`
- Bear Power: `BearPower = Low_t - EMA_t`
- BBP:** `BBP = BullPower + BearPower`
- Interpretation: Positive BBP indicates bullish strength, negative indicates bearish.
3. Z-Score Calculation:
- Purpose: Normalizes BBP to assess deviation from the mean.
- Formula:
Z-Score = (BBP_t - bbp_mean) / bbp_std
- Components:
- `bbp_mean` = SMA of BBP over `zLength` periods.
- `bbp_std` = Standard deviation of BBP over `zLength` periods.
- Usage: Identifies overbought or oversold conditions based on thresholds.
🔶 Volume Analysis
1. Volume Moving Average (`vol_sma`):
vol_sma = (Volume_1 + Volume_2 + ... + Volume_vol_period) / vol_period
2. Volume Multiplier (`vol_mult`):
vol_mult = Current Volume / vol_sma
- Thresholds:
- High Volume: `vol_mult > 2.0`
- Medium Volume: `1.5 < vol_mult ≤ 2.0`
- Low Volume: `1.0 < vol_mult ≤ 1.5`
🔶 Percentile Analysis
1. Percentile Calculation (`calcPercentile`):
Percentile = (Number of values ≤ Current Value / perc_period) * 100
2. Thresholds:
- High Percentile: >90%
- Medium Percentile: >80%
- Low Percentile: >70%
🔶 Dynamic Take-Profit Mechanism
1. ATR-Based Targets:
TP1 Price = Entry Price ± (ATR * atrMult1 * TP_Factor)
TP2 Price = Entry Price ± (ATR * atrMult2 * TP_Factor)
TP3 Price = Entry Price ± (ATR * atrMult3 * TP_Factor)
- ATR Calculation:
ATR_t = (True Range_1 + True Range_2 + ... + True Range_baseAtrLength) / baseAtrLength
2. Adjustment Factors:
TP_Factor = (vol_score + price_score) / 2
- **vol_score** and **price_score** are based on current volume and price percentiles.
Local performance
🔶 Entry and Exit Logic
1. Long Entry: If Z-Score crosses above 1.618, then Enter Long.
2. Short Entry: If Z-Score crosses below -1.618, then Enter Short.
3. Exiting Positions:
If Long and Z-Score crosses below 0:
Exit Long
If Short and Z-Score crosses above 0:
Exit Short
4. Take-Profit Execution:
- Set multiple exit orders at dynamically calculated TP levels based on ATR and adjusted by `TP_Factor`.
█ Trade Direction
The strategy determines trade direction using the Z-Score from the BBP indicator:
- Long Positions:
- Condition: Z-Score crosses above 1.618.
- Short Positions:
- Condition: Z-Score crosses below -1.618.
- Exiting Trades:
- Long Exit: Z-Score drops below 0.
- Short Exit: Z-Score rises above 0.
This approach aligns trades with prevailing market trends, increasing the likelihood of successful outcomes.
█ Usage
Implementing the BBP Strategy with Volume-Percentile TP in TradingView involves:
1. Adding the Strategy:
- Copy the Pine Script code.
- Paste it into TradingView's Pine Editor.
- Save and apply the strategy to your chart.
2. Configuring Settings:
- Adjust parameters like EMA length, Z-Score thresholds, ATR multipliers, volume periods, and percentile settings to match your trading preferences and asset behavior.
3. Backtesting:
- Use TradingView’s backtesting tools to evaluate historical performance.
- Analyze metrics such as profit factor, drawdown, and win rate.
4. Optimization:
- Fine-tune parameters based on backtesting results.
- Test across different assets and timeframes to enhance adaptability.
5. Deployment:
- Apply the strategy in a live trading environment.
- Continuously monitor and adjust settings as market conditions change.
█ Default Settings
The BBP Strategy with Volume-Percentile TP includes default parameters designed for balanced performance across various markets. Understanding these settings and their impact is essential for optimizing strategy performance:
Bull Bear Power Settings:
- EMA Length (`lengthInput`): 21
- **Effect:** Balances sensitivity and trend identification; shorter lengths respond quicker but may generate false signals.
- Z-Score Length (`zLength`): 252
- **Effect:** Long period for stable mean and standard deviation, reducing false signals but less responsive to recent changes.
- Z-Score Threshold (`zThreshold`): 1.618
- **Effect:** Higher threshold filters out weaker signals, focusing on significant market moves.
Take Profit Settings:
- Use Take Profit (`useTP`): Enabled (`true`)
- **Effect:** Activates dynamic profit-taking, enhancing profitability and risk management.
- ATR Period (`baseAtrLength`): 20
- **Effect:** Shorter period for sensitive volatility measurement, allowing tighter profit targets.
- ATR Multipliers:
- **Effect:** Define conservative to aggressive profit targets based on volatility.
- Position Sizes:
- **Effect:** Diversifies profit-taking across multiple levels, balancing risk and reward.
Volume Analysis Settings:
- Volume MA Period (`vol_period`): 100
- **Effect:** Longer period for stable volume average, reducing the impact of short-term spikes.
- Volume Multipliers:
- **Effect:** Determines volume conditions affecting take-profit adjustments.
- Volume Factors:
- **Effect:** Adjusts ATR multipliers based on volume strength.
Percentile Analysis Settings:
- Percentile Period (`perc_period`): 100
- **Effect:** Balances historical context with responsiveness to recent data.
- Percentile Thresholds:
- **Effect:** Defines price and volume percentile levels influencing take-profit adjustments.
- Percentile Factors:
- **Effect:** Modulates ATR multipliers based on price percentile strength.
Impact on Performance:
- EMA Length: Shorter EMAs increase sensitivity but may cause more false signals; longer EMAs provide stability but react slower to market changes.
- Z-Score Parameters:*Longer Z-Score periods create more stable signals, while higher thresholds reduce trade frequency but increase signal reliability.
- ATR Multipliers and Position Sizes: Higher multipliers allow for larger profit targets with increased risk, while diversified position sizes help in securing profits at multiple levels.
- Volume and Percentile Settings: These adjustments ensure that take-profit targets adapt to current market conditions, enhancing flexibility and performance across different volatility environments.
- Commission and Slippage: Accurate settings prevent overestimation of profitability and ensure the strategy remains viable after accounting for trading costs.
Conclusion
The BBP Strategy with Volume-Percentile TP offers a robust framework by combining BBP indicators with volume and percentile analyses. Its dynamic take-profit mechanism, tailored through ATR adjustments, ensures that traders can effectively capture profits while managing risks in varying market conditions.

TitanGrid L/S SuperEngineTitanGrid L/S SuperEngine
Experimental Trend-Aligned Grid Signal Engine for Long & Short Execution
🔹 Overview
TitanGrid is an advanced, real-time signal engine built around a tactical grid structure.
It manages Long and Short trades using trend-aligned entries, layered scaling, and partial exits.
Unlike traditional strategy() -based scripts, TitanGrid runs as an indicator() , but includes its own full internal simulation engine.
This allows it to track capital, equity, PnL, risk exposure, and trade performance bar-by-bar — effectively simulating a custom backtest, while remaining compatible with real-time alert-based execution systems.
The concept was born from the fusion of two prior systems:
Assassin’s Grid (grid-based execution and structure) + Super 8 (trend-filtering, smart capital logic), both developed under the AssassinsGrid framework.
🔹 Disclaimer
This is an experimental tool intended for research, testing, and educational use.
It does not provide guaranteed outcomes and should not be interpreted as financial advice.
Use with demo or simulated accounts before considering live deployment.
🔹 Execution Logic
Trend direction is filtered through a custom SuperTrend engine. Once confirmed:
• Long entries trigger on pullbacks, exiting progressively as price moves up
• Short entries trigger on rallies, exiting as price declines
Grid levels are spaced by configurable percentage width, and entries scale dynamically.
🔹 Stop Loss Mechanism
TitanGrid uses a dual-layer stop system:
• A static stop per entry, placed at a fixed percentage distance matching the grid width
• A trend reversal exit that closes the entire position if price crosses the SuperTrend in the opposite direction
Stops are triggered once per cycle, ensuring predictable and capital-aware behavior.
🔹 Key Features
• Dual-side grid logic (Long-only, Short-only, or Both)
• SuperTrend filtering to enforce directional bias
• Adjustable grid spacing, scaling, and sizing
• Static and dynamic stop-loss logic
• Partial exits and reset conditions
• Webhook-ready alerts (browser-based automation compatible)
• Internal simulation of equity, PnL, fees, and liquidation levels
• Real-time dashboard for full transparency
🔹 Best Use Cases
TitanGrid performs best in structured or mean-reverting environments.
It is especially well-suited to assets with the behavioral profile of ETH — reactive, trend-intraday, and prone to clean pullback formations.
While adaptable to multiple timeframes, it shows strongest performance on the 15-minute chart , offering a balance of signal frequency and directional clarity.
🔹 License
Published under the Mozilla Public License 2.0 .
You are free to study, adapt, and extend this script.
🔹 Panel Reference
The real-time dashboard displays performance metrics, capital state, and position behavior:
• Asset Type – Automatically detects the instrument class (e.g., Crypto, Stock, Forex) from symbol metadata
• Equity – Total simulated capital: realized PnL + floating PnL + remaining cash
• Available Cash – Capital not currently allocated to any position
• Used Margin – Capital locked in open trades, based on position size and leverage
• Net Profit – Realized gain/loss after commissions and fees
• Raw Net Profit – Gross result before trading costs
• Floating PnL – Unrealized profit or loss from active positions
• ROI – Return on initial capital, including realized and floating PnL. Leverage directly impacts this metric, amplifying both gains and losses relative to account size.
• Long/Short Size & Avg Price – Open position sizes and volume-weighted average entry prices
• Leverage & Liquidation – Simulated effective leverage and projected liquidation level
• Hold – Best-performing hold side (Long or Short) over the session
• Hold Efficiency – Performance efficiency during holding phases, relative to capital used
• Profit Factor – Ratio of gross profits to gross losses (realized)
• Payoff Ratio – Average profit per win / average loss per loss
• Win Rate – Percent of profitable closes (including partial exits)
• Expectancy – Net average result per closed trade
• Max Drawdown – Largest recorded drop in equity during the session
• Commission Paid – Simulated trading costs: maker, taker, funding
• Long / Short Trades – Count of entry signals per side
• Time Trading – Number of bars spent in active positions
• Volume / Month – Extrapolated 30-day trading volume estimate
• Min Capital – Lowest equity level recorded during the session
🔹 Reference Ranges by Strategy Type
Use the following metrics as reference depending on the trading style:
Grid / Mean Reversion
• Profit Factor: 1.2 – 2.0
• Payoff Ratio: 0.5 – 1.2
• Win Rate: 50% – 70% (based on partial exits)
• Expectancy: 0.05% – 0.25%
• Drawdown: Moderate to high
• Commission Impact: High
Trend-Following
• Profit Factor: 1.5 – 3.0
• Payoff Ratio: 1.5 – 3.5
• Win Rate: 30% – 50%
• Expectancy: 0.3% – 1.0%
• Drawdown: Low to moderate
Scalping / High-Frequency
• Profit Factor: 1.1 – 1.6
• Payoff Ratio: 0.3 – 0.8
• Win Rate: 80% – 95%
• Expectancy: 0.01% – 0.05%
• Volume / Month: Very high
Breakout Strategies
• Profit Factor: 1.4 – 2.2
• Payoff Ratio: 1.2 – 2.0
• Win Rate: 35% – 60%
• Expectancy: 0.2% – 0.6%
• Drawdown: Can be sharp after failed breakouts
🔹 Note on Performance Simulation
TitanGrid includes internal accounting of fees, slippage, and funding costs.
While its logic is designed for precision and capital efficiency, performance is naturally affected by exchange commissions.
In frictionless environments (e.g., zero-fee simulation), its high-frequency logic could — in theory — extract substantial micro-edges from the market.
However, real-world conditions introduce limits, and all results should be interpreted accordingly.

[3Commas] Alligator StrategyThe Alligator Strategy
🔷 What it does: This script implements the Alligator Strategy, a trend-following method created by Bill Williams. It uses three customizable moving averages (SMMAs or RMAs) "Jaws," "Teeth," and "Lips" to identify market trends and potential trade opportunities. Additionally, it includes built-in stop-loss and take-profit options for enhanced risk management.
🔷 Who is it for:
Trend Traders: Those who prefer trading in markets with clear directional movement.
Advanced Users: Traders who require customizable tools and dynamic risk management features.
Beginners: Accessible to those new to trading, thanks to its intuitive visual representation of trends and pre-configured settings.
Bot Users: Supports direct signal integration for bot automation, including entries, take-profits, and stop-losses.
🔷 How does it work: The Alligator Jaws, Teeth, and Lips are smoothed moving averages (SMA, EMA, RMA, or WMA) calculated based on the selected source price ( hl2 = (high+low)/2 by default). Their lengths and offsets are customizable:
Jaws: Length 21 , offset 13.
Teeth: Length 13, offset 8.
Lips: Length 8 , offset 5.
When the lines align and spread apart (e.g., Lips > Teeth > Jaws for an uptrend), the strategy identifies a trending market.
Entry Conditions:
Long Trades: Triggered when Close > Lips > Teeth > Jaws.
Short Trades: Triggered when Close < Lips < Teeth < Jaws.
🔷 Why it’s unique:
Customization: Flexible settings for moving average types and lengths to adapt to different market conditions and strategy tester configurations.
Built-in Filters: Trend filters that can reduce false signals in certain scenarios, making it more reliable for trending markets.
Take Profit and Stop Loss:
Configurable as either percentage-based or dynamic.
Stop-loss levels adjust dynamically using the Alligator lines.
Fast exit logic moves the stop-loss closer to the price when trades are in profit.
3Commas Bot Compatibility: Designed for automated trading, allowing traders to configure and execute the strategy seamlessly.
🔷 Considerations Before Using the Indicator
🔸Why the Forward Offset: By shifting the averages forward, the Alligator helps traders focus on established trends while filtering out short-term market noise.
The standard configurations of 13-8, 8-5, and 5-3 were selected based on Bill Williams’ studies of market behavior. However, these values can be adjusted to suit different market conditions:
Volatile Markets: Faster settings (e.g., 10-6, 6-4, 3-2) may provide earlier signals.
Less Volatile Markets: Slower settings (e.g., 21-13, 13-8, 8-5) can help avoid noise and reduce false signals.
🔸Best Timeframes to Use: The Alligator can be applied across all timeframes, but certain timeframes offer better reliability.
Higher Timeframes (H4, D1, W1): Ideal for identifying significant trends and for swing or position trading.
Lower Timeframes: Not recommended due to increased noise but may work for scalping with additional confirmation tools.
🔸Disadvantages of the Alligator Strategy:
Exhausted Entry Levels: High buying levels or low selling levels can lead to momentum exhaustion and potential pullbacks.
False Signals in Ranges: Consolidating markets can produce unreliable signals.
Lagging Indicator: As it is based on moving averages, it may delay reacting to sudden price changes.
🔸Advantages of the Alligator Strategy:
Trend Focused: Simplifies the identification of trending markets.
Noise Reduction: Forward shifts and smoothed averages help filter out short-term price fluctuations.
Broad Applicability: Suitable for forex, crypto, stocks, and commodities.
🔸Important Considerations:
While the Alligator Strategy provides a systematic way to analyze markets, it does not guarantee successful outcomes. Results in trading depend on multiple factors, including market conditions, trader discipline, and risk management. Past performance of the strategy does not ensure future success, and traders should always approach the market with caution.
Risk Management: Define stop-loss levels, position size, and profit targets before entering any trade. Be prepared for the possibility of losses and ensure that your approach aligns with your overall trading plan.
🔷 STRATEGY PROPERTIES
Symbol: BINANCE:BTCUSDT (Spot).
Timeframe: 1D (Daily Timeframe).
Test Period: All historical data available.
Initial Capital: 10000 USDT.
Order Size per Trade: 1% of Capital, you can use a higher value e.g. 5%, be cautious that the Max Drawdown does not exceed 10%, as it would indicate a very risky trading approach.
Commission: Binance commission 0.1%, adjust according to the exchange being used, lower numbers will generate unrealistic results. By using low values e.g. 5%, it allows us to adapt over time and check the functioning of the strategy.
Slippage: 5 ticks, for pairs with low liquidity or very large orders, this number should be increased as the order may not be filled at the desired level.
Margin for Long and Short Positions: 100%.
Indicator Settings: Default Configuration.
Alligator: Source hl2 | Calculation RMA | Jaw 21-13, Teeth 13-8, Lips 8-5.
Strategy: Long & Short.
Max Stop Loss per Trade: 10% of Trade Size.
Exit trades on opposite signal: Enable.
Alligator Stop Loss: Enable.
Alligator Fast Exit: Enable.
🔷 STRATEGY RESULTS
⚠️ Remember, past results do not guarantee future performance.
Net Profit: +355.68 USDT (+3.56%).
Total Closed Trades: 103.
Percent Profitable: 47.57%.
Profit Factor: 1.927.
Max Drawdown: -57.99 USDT (-0.56%).
Average Trade: +3.45 USDT (+3.41%).
Average # Bars in Trades: 16.
🔷 HOW TO USE
🔸Adjust the Alligator Settings:
The default values generally work well: Source hl2 | Calculation RMA | Jaw 21-13, Teeth 13-8, Lips 8-5. However, if you want to use it on timeframes smaller than 4H (4 hours), consider increasing the values to better filter market noise.
Please review the "Indicator Settings" section for configuration.
🔸Choose a Symbol that Typically Trends:
Select an asset that tends to create trends. However, the Strategy Tester results may display poor performance, making it less suitable for sending signals to bots.
🔸Add Trend Filters:
You can enable trend filters like MA and SuperTrend. By default, these are disabled as they are often unnecessary, but you can experiment with their configuration to see if they optimize the strategy's results.
Please review the "Indicator Settings" section for configuration.
🔸Enable Stop Loss Levels:
Activate Stop Loss features, such as Stop Loss % or Alligator Stop Loss. If both are enabled, the one closest to the price during the trade will be applied.
Please review the "Indicator Settings" section for configuration.
🔸Enable Take Profit Levels:
Activate Take Profit options, such as Take Profit % or Alligator Fast Exit. If both are enabled, the one that triggers first will be executed.
Please review the "Indicator Settings" section for configuration.
This is an example with the default settings and how Alligator Stop Loss and Alligator Fast Exit are activated:
In this example, we additionally enable the Take Profit at 10%. We can observe that the Alligator Stop Loss is the active one since it is closer to the price. When the price moves 10% in favor or against the trade, the position is closed. Although the Alligator Fast Exit is enabled, it does not activate because the trades are closed beforehand.
🔸Results Review:
It is important to check the Max Drawdown. This value should ideally not exceed 10% of your capital. Consider adjusting the trade size to ensure this threshold is not surpassed.
Remember to include the correct values for commission and slippage according to the symbol and exchange where you are conducting the tests. Otherwise, the results will not be realistic.
If you are satisfied with the results, you may consider automating your trades. However, it is strongly recommended to use a small amount of capital or a demo account to test proper execution before committing real funds.
🔸Create alerts to trigger the DCA Bot
Verify Messages: Ensure the message matches the one specified by the DCA Bot.
Multi-Pair Configuration: For multi-pair setups, enable the option to add the symbol in the correct format.
Signal Settings: Enable whether you want to receive long or short signals (Entry | TP | SL), copy and paste the the messages for the DCA Bots configured in 3Commas.
Alert Setup:
When creating an alert, set the condition to the indicator and choose "alert() function call only.
Enter any desired Alert Name.
Open the Notifications tab, enable Webhook URL, and paste the Webhook URL from 3Commas.
For more details, refer to the 3Commas section: "How to use TradingView Custom Signals.
Finalize Alerts: Click Create, you're done! Alerts will now be sent automatically in the correct format to 3Commas.
🔷 INDICATOR SETTINGS
🔸Alligator Settings
MA's source: Source price for Alligator moving averages.
MA's Type: Type of calculation for MA's.
Jaw and Offset: Jaw length and offset to the right.
Teeth and Offset: Teethlength and offset to the right.
Lips and Offset: Lips length and offset to the right.
🔸Alligator Style
Plot Alligator: Show Alligator Ribbon.
Plot MA's: Show Alligator MA's.
Colors: Main and Gradient Colors for Bullish Alligator, Berish Alligator, Neutral Alligator. For gradient colors it is recommended to use an opacity of 15.
🔸MA & SuperTrend Filters
MA & Plot: Activate MA Filter and Plot MA on the chart.
Long Entries: When activated, it will only execute entries if the price is above the MA
Short Entries: When activated, it will only execute entries if the price is below the MA.
Source: Source price for moving average calculations.
Length: Candles to be used by the MA calculations.
Type: Type of calculation for MA.
Timeframe: Here you can select a larger timeframe for the filter.
ST & Plot: Activate SuperTrend Filter and Plot SuperTrend on the chart.
Long Entries: When activated, it will only execute entries if the price is above the SuperTrend.
Short Entries: When activated, it will only execute entries if the price is below the SuperTrend.
Source: Source price for SuperTrend calculations.
Length: Candles to be used by the SuperTrend calculations.
Factor: ATR multiplier of the SuperTrend.
Timeframe: Here you can select a larger timeframe for the filter.
🔸Strategy Tester
Strategy: Order Type direction in which trades are executed.
Take Profit %: When activated, the entered value will be used as the Take Profit in percentage from the entry price level.
Stop Loss %: When activated, the entered value will be used as the Stop Loss in percentage from the entry price level. If Alligator Stop Loss is activated, the closest one to the price will be used.
Exit trades on opposite signal: This option closes the trade if the opposite condition is met. For instance, if we are in a long position and a sell signal is triggered, the long position will be closed, and a short position will be opened. The same applies inversely.
Alligator Stop Loss: In a long trade, the lower part of the Alligator indicator will be used as a dynamic stop loss. Similarly, in a short trade, the upper part of the indicator will be used.
Alligator Fast Exit: Its purpose is to attempt to protect movements in favor of the trade's direction. In the case of long trades, once the price and the upper part of the Alligator indicator are above the trade's entry price, the stop loss will be moved to the upper part. For short trades, once the price and the lower part of the Alligator indicator are below the trade's entry price, the stop loss will be moved to the lower part of the Alligator indicator.
Alligator Squeeze Entry: When activated, entries will only be executed if they meet the condition after a neutral zone of the Alligator indicator.
Alligator Squeeze Exit: When this option is activated, any open trades will be closed when the Alligator indicator enters a neutral mode.
Use Custom Test Period: When enabled signals only works in the selected time window. If disabled it will use all historical data available on the chart.
Test Start and End: Once the Custom Test Period is enabled, here you select the start and end date that you want to analyze.
🔸3Commas DCA Bot Signals
Check Messages: Enable the table to review the messages to be sent to the bot.
Entry | TP | SL: Enable this options to send Buy Entry, Take Profit (TP), and Stop Loss (SL) signals to 3Commas.
Deal Entry and Deal Exit : Copy and paste the message for the deal start signal and close order at Market Price of the DCA Bot you created in 3Commas. This is the message that will be sent with the alert to the Bot, you must verify that it is the same as the 3Commas bot so that it can process properly so that it executes and starts the trade.
DCA Bot Multi-Pair: You must activate it if you want to use the signals in a DCA Bot Multi-pair in the text box you must enter (using the 3Commas format) the symbol in which you are creating the alert, you can check the format of each symbol when you create the bot.
🔷 CONCLUSION
The Alligator Strategy is a valuable tool for identifying potential trends and improving decision-making. However, no trading strategy is foolproof. Careful consideration of market conditions, proper risk management, and personal trading goals are essential. Use the Alligator as part of a broader trading system, and remember that consistent learning and discipline are key to success in trading.
👨🏻💻💭 We hope this tool helps enhance your trading. Your feedback is invaluable, so feel free to share any suggestions for improvements or new features you'd like to see implemented.
____________________________________________________________________
The information and publications within the 3Commas TradingView account are not meant to be and do not constitute financial, investment, trading, or other types of advice or recommendations supplied or endorsed by 3Commas and any of the parties acting on behalf of 3Commas, including its employees, contractors, ambassadors, etc.

Optimized Zhaocaijinbao strategyIntroduction:
The Optimized Zhaocaijinbao strategy is a mid and long-term quantitative trading strategy that combines momentum and trend factors. It generates buy and sell signals by using a combination of exponential moving averages, moving averages, volume and slope indicators. It generates buy signals when the stock is above the 35-day moving average, the trading volume is higher than the 20-day moving average, and the stock is in an upward trend on a weekly timeframe."招财进宝" is a Chinese phrase that can be translated to "Attract Wealth and Bring in Treasure" in English. It is a common expression used to wish for good luck and prosperity in various contexts, such as in business or personal finances.
Highlights:
The strategy has several special optimizations that make it unique.
Firstly, the strategy is optimized for T+1 trading in the Chinese stock market and is only suitable for long positions. The optimizations are also applicable to international stock markets.
Secondly, the trend strategy is optimized to only show indicators on the right side and oscillations. This helps to prevent false signals in choppy markets.
Thirdly, the strategy uses a risk factor for dynamic position sizing to ensure position sizes are adjusted according to the current net asset value and risk preferences. This helps to lower drawdown risks.
The strategy has good resilience even without using stop loss modules in backtesting, making it suitable for trading hourly, 2-hourly, and daily K-line charts (depending on the stock being traded). We recommend experimenting with backtesting using SSE 1-hour or 2-hour or daily Kline charts.
Backtesting outcomes:
The strategy was backtested over the period from October 13th, 2005 to April 14th, 2023, using daily candlestick charts for the commodity code SSE:600763, with a currency of CNY and tick size of 0.01. The strategy used an initial capital of 1,000,000 CNY, with order sizes set to 10% equity and a pyramid of 1 order. The strategy also had a Max Position Size of 0.01 and a Risk Factor of 2.
Here is a summary of the performance of the trading strategy:
Total net profit: 288,577.32 CNY, representing a return of 128.86%
Total number of closed trades: 61
Winning trades: 37, representing a win rate of 60.66%
Profit factor: 2.415
Largest losing trade: 222,021.46 CNY, representing a loss of 14.08%
Average trade: 21,124.22 CNY, representing a return of 3.1%
Average holding period for all trades: 12 days
Conclusion:
In conclusion, the Optimized Zhaocaijinbao strategy is a mid and long-term quantitative trading strategy that combines momentum and trend factors. It is suitable for both Chinese stocks and global stocks. While the Optimized Zhaocaijinbao strategy has performed well in backtesting, it is important to note that past performance is not a guarantee of future results. Traders should conduct their own research and analysis and exercise caution when using any trading strategy.

Titan Investments|Quantitative THEMIS|Pro|BINANCE:BTCUSDTP:4hInvestment Strategy (Quantitative Trading)
| 🛑 | Watch "LIVE" and 'COPY' this strategy in real time:
🔗 Link: www.tradingview.com
Hello, welcome, feel free 🌹💐
Since the stone age to the most technological age, one thing has not changed, that which continues impress human beings the most, is the other human being!
Deep down, it's all very simple or very complicated, depends on how you look at it.
I believe that everyone was born to do something very well in life.
But few are those who have, let's use the word 'luck' .
Few are those who have the 'luck' to discover this thing.
That is why few are happy and successful in their jobs and professions.
Thank God I had this 'luck' , and discovered what I was born to do well.
And I was born to program. 👨💻
📋 Summary : Project Titan
0️⃣ : 🦄 Project Titan
1️⃣ : ⚖️ Quantitative THEMIS
2️⃣ : 🏛️ Titan Community
3️⃣ : 👨💻 Who am I ❔
4️⃣ : ❓ What is Statistical/Probabilistic Trading ❓
5️⃣ : ❓ How Statistical/Probabilistic Trading works ❓
6️⃣ : ❓ Why use a Statistical/Probabilistic system ❓
7️⃣ : ❓ Why the human brain is not prepared to do Trading ❓
8️⃣ : ❓ What is Backtest ❓
9️⃣ : ❓ How to build a Consistent system ❓
🔟 : ❓ What is a Quantitative Trading system ❓
1️⃣1️⃣ : ❓ How to build a Quantitative Trading system ❓
1️⃣2️⃣ : ❓ How to Exploit Market Anomalies ❓
1️⃣3️⃣ : ❓ What Defines a Robust, Profitable and Consistent System ❓
1️⃣4️⃣ : 🔧 Fixed Technical
1️⃣5️⃣ : ❌ Fixed Outputs : 🎯 TP(%) & 🛑SL(%)
1️⃣6️⃣ : ⚠️ Risk Profile
1️⃣7️⃣ : ⭕ Moving Exits : (Indicators)
1️⃣8️⃣ : 💸 Initial Capital
1️⃣9️⃣ : ⚙️ Entry Options
2️⃣0️⃣ : ❓ How to Automate this Strategy ❓ : 🤖 Automation : 'Third-Party Services'
2️⃣1️⃣ : ❓ How to Automate this Strategy ❓ : 🤖 Automation : 'Exchanges
2️⃣2️⃣ : ❓ How to Automate this Strategy ❓ : 🤖 Automation : 'Messaging Services'
2️⃣3️⃣ : ❓ How to Automate this Strategy ❓ : 🤖 Automation : '🧲🤖Copy-Trading'
2️⃣4️⃣ : ❔ Why be a Titan Pro 👽❔
2️⃣5️⃣ : ❔ Why be a Titan Aff 🛸❔
2️⃣6️⃣ : 📋 Summary : ⚖️ Strategy: Titan Investments|Quantitative THEMIS|Pro|BINANCE:BTCUSDTP:4h
2️⃣7️⃣ : 📊 PERFORMANCE : 🆑 Conservative
2️⃣8️⃣ : 📊 PERFORMANCE : Ⓜ️ Moderate
2️⃣9️⃣ : 📊 PERFORMANCE : 🅰 Aggressive
3️⃣0️⃣ : 🛠️ Roadmap
3️⃣1️⃣ : 🧻 Notes ❕
3️⃣2️⃣ : 🚨 Disclaimer ❕❗
3️⃣3️⃣ : ♻️ ® No Repaint
3️⃣4️⃣ : 🔒 Copyright ©️
3️⃣5️⃣ : 👏 Acknowledgments
3️⃣6️⃣ : 👮 House Rules : 📺 TradingView
3️⃣7️⃣ : 🏛️ Become a Titan Pro member 👽
3️⃣8️⃣ : 🏛️ Be a member Titan Aff 🛸
0️⃣ : 🦄 Project Titan
This is the first real, 100% automated Quantitative Strategy made available to the public and the pinescript community for TradingView.
You will be able to automate all signals of this strategy for your broker , centralized or decentralized and also for messaging services : Discord, Telegram or Twitter .
This is the first strategy of a larger project, in 2023, I will provide a total of 6 100% automated 'Quantitative' strategies to the pinescript community for TradingView.
The future strategies to be shared here will also be unique , never before seen, real 'Quantitative' bots with real, validated results in real operation.
Just like the 'Quantitative THEMIS' strategy, it will be something out of the loop throughout the pinescript/tradingview community, truly unique tools for building mutual wealth consistently and continuously for our community.
1️⃣ : ⚖️ Quantitative THEMIS : Titan Investments|Quantitative THEMIS|Pro|BINANCE:BTCUSDTP:4h
This is a truly unique and out of the curve strategy for BTC /USD .
A truly real strategy, with real, validated results and in real operation.
A unique tool for building mutual wealth, consistently and continuously for the members of the Titan community.
Initially we will operate on a monthly, quarterly, annual or biennial subscription service.
Our goal here is to build a great community, in exchange for an extremely fair value for the use of our truly unique tools, which bring and will bring real results to our community members.
With this business model it will be possible to provide all Titan users and community members with the purest and highest degree of sophistication in the market with pinescript for tradingview, providing unique and truly profitable strategies.
My goal here is to offer the best to our members!
The best 'pinescript' tradingview service in the world!
We are the only Start-Up in the world that will decentralize real and full access to truly real 'quantitative' tools that bring and will bring real results for mutual and ongoing wealth building for our community.
2️⃣ : 🏛️ Titan Community : 👽 Pro 🔁 Aff 🛸
Become a Titan Pro 👽
To get access to the strategy: "Quantitative THEMIS" , and future Titan strategies in a 100% automated way, along with all tutorials for automation.
Pro Plans: 30 Days, 90 Days, 12 Months, 24 Months.
👽 Pro 🅼 Monthly
👽 Pro 🆀 Quarterly
👽 Pro🅰 Annual
👽 Pro👾Two Years
You will have access to a truly unique system that is out of the curve .
A 100% real, 100% automated, tested, validated, profitable, and in real operation strategy.
Become a Titan Affiliate 🛸
By becoming a Titan Affiliate 🛸, you will automatically receive 50% of the value of each new subscription you refer .
You will receive 50% for any of the above plans that you refer .
This way we will encourage our community to grow in a fair and healthy way, because we know what we have in our hands and what we deliver real value to our users.
We are at the highest level of sophistication in the market, the consistency here and the results here speak for themselves.
So growing our community means growing mutual wealth and raising collective conscience.
Wealth must be created not divided.
And here we are creating mutual wealth on all ends and in all ways.
A non-zero sum system, where everybody wins.
3️⃣ : 👨💻 Who am I ❔
My name is FilipeSoh I am 26 years old, Technical Analyst, Trader, Computer Engineer, pinescript Specialist, with extensive experience in several languages and technologies.
For the last 4 years I have been focusing on developing, editing and creating pinescript indicators and strategies for Tradingview for people and myself.
Full-time passionate workaholic pinescript developer with over 10,000 hours of pinescript development.
• Pinescript expert ▬Tradingview.
• Specialist in Automated Trading
• Specialist in Quantitative Trading.
• Statistical/Probabilistic Trading Specialist - Mark Douglas Scholl.
• Inventor of the 'Classic Forecast' Indicators.
• Inventor of the 'Backtest Table'.
4️⃣ : ❓ What is Statistical/Probabilistic Trading ❓
Statistical/probabilistic trading is the only way to get a positive mathematical expectation regarding the market and consequently that is the only way to make money consistently from it.
I will present below some more details about the Quantitative THEMIS strategy, it is a real strategy, tested, validated and in real operation, 'Skin in the Game' , a consistent way to make money with statistical/probabilistic trading in a 100% automated.
I am a Technical Analyst , I used to be a Discretionary Trader , today I am 100% a Statistical Trader .
I've gotten rich and made a lot of money, and I've also lost a lot with 'leverage'.
That was a few years ago.
The book that changed everything for me was "Trading in The Zone" by Mark Douglas.
That's when I understood that the market is just a game of statistics and probability, like a casino!
It was then that I understood that the human brain is not prepared for trading, because it involves triggers and mental emotions.
And emotions in trading and in making trading decisions do not go well together, not in the long run, because you always have the burden of being wrong with the outcome of that particular position.
But remembering that the market is just a statistical game!
5️⃣ : ❓ How Statistical/Probabilistic Trading works ❓
Let's use a 'coin' as an example:
If we toss a 'coin' up 10 times.
Do you agree that it is impossible for us to know exactly the result of the 'plays' before they actually happen?
As in the example above, would you agree, that we cannot "guess" the outcome of a position before it actually happens?
As much as we cannot "guess" whether the coin will drop heads or tails on each flip.
We can analyze the "backtest" of the 10 moves made with that coin:
If we analyze the 10 moves and count the number of times the coin fell heads or tails in a specific sequence, we then have a percentage of times the coin fell heads or tails, so we have a 'backtest' of those moves.
Then on the next flip we can now assume a point or a favorable position for one side, the side with the highest probability .
In a nutshell, this is more or less how probabilistic statistical trading works.
As Statistical Traders we can never say whether such a Trader/Position we take will be a winner or a loser.
But still we can have a positive and consistent result in a "sequence" of trades, because before we even open a position, backtests have already been performed so we identify an anomaly and build a system that will have a positive statistical advantage in our favor over the market.
The advantage will not be in one trade itself, but in the "sequence" of trades as a whole!
Because our system will work like a casino, having a positive mathematical expectation relative to the players/market.
Design, develop, test models and systems that can take advantage of market anomalies, until they change.
Be the casino! - Mark Douglas
6️⃣ : ❓ Why use a Statistical/Probabilistic system ❓
In recent years I have focused and specialized in developing 100% automated trading systems, essentially for the cryptocurrency market.
I have developed many extremely robust and efficient systems, with positive mathematical expectation towards the market.
These are not complex systems per se , because here we want to avoid 'over-optimization' as much as possible.
As Da Vinci said: "Simplicity is the highest degree of sophistication".
I say this because I have tested, tried and developed hundreds of systems/strategies.
I believe I have programmed more than 10,000 unique indicators/strategies, because this is my passion and purpose in life.
I am passionate about what I do, completely!
I love statistical trading because it is the only way to get consistency in the long run!
This is why I have studied, applied, developed, and specialized in 100% automated cryptocurrency trading systems.
The reason why our systems are extremely "simple" is because, as I mentioned before, in statistical trading we want to exploit the market anomaly to the maximum, that is, this anomaly will change from time to time, usually we can exploit a trading system efficiently for about 6 to 12 months, or for a few years, that is; for fixed 'scalpers' systems.
Because at some point these anomalies will be identified , and from the moment they are identified they will be exploited and will stop being anomalies .
With the system presented here; you can even copy the indicators and input values shared here;
However; what I have to offer you is: it is me , our team , and our community !
That is, we will constantly monitor this system, for life , because our goal here is to create a unique , perpetual , profitable , and consistent system for our community.
Myself , our team and our community will keep this script periodically updated , to ensure the positive mathematical expectation of it.
So we don't mind sharing the current parameters and values , because the real value is also in the future updates that this system will receive from me and our team , guided by our culture and our community of real users !
As we are hosted on 'tradingview', all future updates for this strategy, will be implemented and updated automatically on your tradingview account.
What we want here is: to make sure you get gains from our system, because if you get gains , our ecosystem will grow as a whole in a healthy and scalable way, so we will be generating continuous mutual wealth and raising the collective consciousness .
People Need People: 3️⃣🅿
7️⃣ : ❓ Why the human brain is not prepared to do Trading ❓
Today my greatest skill is to develop statistically profitable and 100% automated strategies for 'pinescript' tradingview.
Note that I said: 'profitable' because in fact statistical trading is the only way to make money in a 'consistent' way from the market.
And consequently have a positive wealth curve every cycle, because we will be based on mathematics, not on feelings and news.
Because the human brain is not prepared to do trading.
Because trading is connected to the decision making of the cerebral cortex.
And the decision making is automatically linked to emotions, and emotions don't match with trading decision making, because in those moments, we can feel the best and also the worst sensations and emotions, and this certainly affects us and makes us commit grotesque mistakes!
That's why the human brain is not prepared to do trading.
If you want to participate in a fully automated, profitable and consistent trading system; be a Titan Pro 👽
I believe we are walking an extremely enriching path here, not only in terms of financial returns for our community, but also in terms of knowledge about probabilistic and automated statistical trading.
You will have access to an extremely robust system, which was built upon very strong concepts and foundations, and upon the world's main asset in a few years: Bitcoin .
We are the tip of the best that exists in the cryptocurrency market when it comes to probabilistic and automated statistical trading.
Result is result! Me being dressed or naked.
This is just the beginning!
But there is a way to consistently make money from the market.
Being the Casino! - Mark Douglas
8️⃣ : ❓ What is Backtest ❓
Imagine the market as a purely random system, but even in 'randomness' there are patterns.
So now imagine the market and statistical trading as follows:
Repeating the above 'coin' example, let's think of it as follows:
If we toss a coin up 10 times again.
It is impossible to know which flips will have heads or tails, correct?
But if we analyze these 10 tosses, then we will have a mathematical statistic of the past result, for example, 70 % of the tosses fell 'heads'.
That is:
7 moves fell on "heads" .
3 moves fell on "tails" .
So based on these conditions and on the generic backtest presented here, we could adopt " heads " as our system of moves, to have a statistical and probabilistic advantage in relation to the next move to be performed.
That is, if you define a system, based on backtests , that has a robust positive mathematical expectation in relation to the market you will have a profitable system.
For every move you make you will have a positive statistical advantage in your favor over the market before you even make the move.
Like a casino in relation to all its players!
The casino does not have an advantage over one specific player, but over all players, because it has a positive mathematical expectation about all the moves that night.
The casino will always have a positive statistical advantage over its players.
Note that there will always be real players who will make real, million-dollar bankrolls that night, but this condition is already built into the casino's 'strategy', which has a pre-determined positive statistical advantage of that night as a whole.
Statistical trading is the same thing, as long as you don't understand this you will keep losing money and consistently.
9️⃣ : ❓ How to build a Consistent system ❓
See most traders around the world perform trades believing that that specific position taken will make them filthy rich, because they simply believe faithfully that the position taken will be an undoubted winner, based on a trader's methodology: 'trading a trade' without analyzing the whole context, just using 'empirical' aspects in their system.
But if you think of trading, as a sequence of moves.
You see, 'a sequence' !
When we think statistically, it doesn't matter your result for this , or for the next specific trade , but the final sequence of trades as a whole.
As the market has a random system of results distribution , if your system has a positive statistical advantage in relation to the market, at the end of that sequence you'll have the biggest probability of having a winning bank.
That's how you do real trading!
And with consistency!
Trading is a long term game, but when you change the key you realize that it is a simple game to make money in a consistent way from the market, all you need is patience.
Even more when we are based on Bitcoin, which has its 'Halving' effect where, in theory, we will never lose money in 3 to 4 years intervals, due to its scarcity and the fact that Bitcoin is the 'discovery of digital scarcity' which makes it the digital gold, we believe in this thesis and we follow Satoshi's legacy.
So align Bitcoin with a probabilistic statistical trading system with a positive mathematical expectation of the market and 100% automated with the long term, and all you need is patience, and you will become rich.
In fact Bitcoin by itself is already a path, buy, wait for each halving and your wealth will be maintained.
No inflation, unlike fiat currencies.
This is a complete and extremely robust strategy, with the most current possible and 'not possible' techniques involved and applied here.
Today I am at another level in developing 100% automated 'quantitative' strategies.
I was born for this!
🔟 : ❓ What is a Quantitative Trading system ❓
In addition to having access to a revolutionary strategy you will have access to disruptive 100% multifunctional tables with the ability to perform 'backtests' for better tracking and monitoring of your system on a customized basis.
I would like to emphasize one thing, and that is that you keep this in mind.
Today my greatest skill in 'pinescript' is to build indicators, but mainly strategies, based on statistical and probabilistic trading, with a postive mathematical expectation in relation to the market, in a 100% automated way.
This with the goal of building a consistent and continuous positive equity curve through mathematics using data, converting it into statistical / probabilistic parameters and applying them to a Quantitative model.
Before becoming a Quantitative Trader , I was a Technical Analyst and a Discretionary Trader .
First as a position trader and then as a day trader.
Before becoming a Trader, I trained myself as a Technical Analyst , to masterly understand the shape and workings of the market in theory.
But everything changed when I met 'Mark Douglas' , when I got to know his works, that's when my head exploded 🤯, and I started to understand the market for good!
The market is nothing more than a 'random' system of distributing results.
See that I said: 'random' .
Do yourself a mental exercise.
Is there really such a thing as random ?
I believe not, as far as we know maybe the 'singularity'.
So thinking this way, to translate, the market is nothing more than a game of probability, statistics and pure mathematics.
Like a casino!
What happens is that most traders, whenever they take a position, take it with all the empirical certainty that such position will win or lose, and do not take into consideration the total sequence of results to understand their place in the market.
Understanding your place in the market gives you the ability to create and design systems that can exploit the present market anomaly, and thus make money statistically, consistently, and 100% automated.
Thinking of it this way, it is easy to make money from the market.
There are many ways to make money from the market, but the only consistent way I know of is through 'probabilistic and automated statistical trading'.
1️⃣1️⃣ : ❓ How to build a Quantitative Trading system ❓
There are some fundamental points that must be addressed here in order to understand what makes up a system based on statistics and probability applied to a quantitative model.
When we talk about 'discretionary' trading, it is a trading system based on human decisions after the defined 'empirical' conditions are met.
It is quite another thing to build a fully automated system without any human interference/interaction .
That said:
Building a statistically profitable system is perfectly possible, but this is a high level task , but with possible high rewards and consistent gains.
Here you will find a real "Skin In The Game" strategy.
With all due respect, but the vast majority of traders who post strategies on TradingView do not understand what they are doing.
Most of them do not understand the minimum complexity involved in the main variable for the construction of a real strategy, the mother variable: "strategy".
I say this by my own experience, because I have analyzed practically all the existing publications of TradingView + 200,000 indicators and strategies.
I breathe pinescript, I eat pinescript, I sleep pinescript, I bathe pinescript, I live TradingView.
But the main advantage for the TradingView users, is that all entry and exit orders made by this strategy can be checked and analyzed thoroughly, to validate and prove the veracity of this strategy, because this is a 100% real strategy.
Here there is a huge world of possibilities, but only one way to build a 'pinescript strategy' that will work correctly aligned to the real world with real results .
There are some fundamental points to take into consideration when building a profitable trading system:
The most important of these for me is: 'DrawDown' .
Followed by: 'Hit Rate' .
And only after that we use the parameter: 'Profit'.
See, this is because here, we are dealing with the 'imponderable' , and anything can happen in this scenario.
But there is one thing that makes us sleep peacefully at night, and that is: controlling losses .
That is, in other words: controlling the DrawDown .
The amateur is concerned with 'winning', the professional is concerned with conserving capital.
If we have the losses under control, then we can move on to the other two parameters: hit rate and profit.
See, the second most important factor in building a system is the hit rate.
I say this from my own experience.
I have worked with many systems with a 'low hit rate', but extremely profitable.
For example: systems with hit rates of 40 to 50%.
But as much as statistically and mathematically the profit is rewarding, operating systems with a low hit rate is always very stressful psychologically.
That's why there are two big reasons why when I build an automated trading system, I focus on the high hit rate of the system, they are
1 - To reduce psychological damage as much as possible .
2 - And more important , when we create a system with a 'high hit rate' , there is a huge intrinsic advantage here, that most statistic traders don't take in consideration.
That is: knowing more quickly when the system stops being functional.
The main advantage of a system with a high hit rate is: to identify when the system stops being functional and stop exploiting the market's anomaly.
Look: When we are talking about trading and random distribution of results on the market, do you agree that when we create a trading system, we are focused on exploring some anomaly of that market?
When that anomaly is verified by the market, it will stop being functional with time.
That's why trading systems, 'scalpers', especially for cryptocurrencies, need constant monitoring, quarterly, semi-annually or annually.
Because market movements change from time to time.
Because we go through different cycles from time to time, such as congestion cycles, accumulation , distribution , volatility , uptrends and downtrends .
1️⃣2️⃣ : ❓ How to Exploit Market Anomalies ❓
You see there is a very important point that must be stressed here.
As we are always trying to exploit an 'anomaly' in the market.
So the 'number' of indicators/tools that will integrate the system is of paramount importance.
But most traders do not take this into consideration.
To build a professional, robust, consistent, and profitable system, you don't need to use hundreds of indicators to build your setup.
This will actually make it harder to read when the setup stops working and needs some adjustment.
So focusing on a high hit rate is very important here, this is a fundamental principle that is widely ignored , and with a high hit rate, we can know much more accurately when the system is no longer functional much faster.
As Darwin said: "It is not the strongest or the most intelligent that wins the game of life, it is the most adapted.
So simple systems, as contradictory as it may seem, are more efficient, because they help to identify inflection points in the market much more quickly.
1️⃣3️⃣ : ❓ What Defines a Robust, Profitable and Consistent System ❓
See I have built, hundreds of thousands of indicators and 'pinescript' strategies, hundreds of thousands.
This is an extremely professional, robust and profitable system.
Based on the currency pairs: BTC /USDT
There are many ways and avenues to build a profitable trading setup/system.
And actually this is not a difficult task, taking in consideration, as the main factor here, that our trading and investment plan is for the long term, so consequently we will face scenarios with less noise.
He who is in a hurry eats raw.
As mentioned before.
Defining trends in pinescript is technically a simple task, the hardest task is to determine congestion zones with low volume and volatility, it's in these moments that many false signals are generated, and consequently is where most setups face their maximum DrawDown.
That's why this strategy was strictly and thoroughly planned, built on a very solid foundation, to avoid as much noise as possible, for a positive and consistent equity curve in each market cycle, 'Consistency' is our 'Mantra' around here.
1️⃣4️⃣ : 🔧 Fixed Technical
• Strategy: Titan Investments|Quantitative THEMIS|Pro|BINANCE:BTCUSDTP:4h
• Pair: BTC/USDTP
• Time Frame: 4 hours
• Broker: Binance (Recommended)
For a more conservative scenario, we have built the Quantitative THEMIS for the 4h time frame, with the main focus on consistency.
So we can avoid noise as much as possible!
1️⃣5️⃣ : ❌ Fixed Outputs : 🎯 TP(%) & 🛑SL(%)
In order to build a 'perpetual' system specific to BTC/USDT, it took a lot of testing, and more testing, and a lot of investment and research.
There is one initial and fundamental point that we can address to justify the incredible consistency presented here.
That fundamental point is our exit via Take Profit or Stop Loss percentage (%).
🎯 Take Profit (%)
🛑 Stop Loss (%)
See, today I have been testing some more advanced backtesting models for some cryptocurrency systems.
In which I perform 'backtest of backtest', i.e. we use a set of strategies each focused on a principle, operating individually, but they are part of something unique, i.e. we do 'backtests' of 'backtests' together.
What I mean is that we do a lot of backtesting around here.
I can assure you, that always the best output for a trading system is to set fixed output values!
In other words:
🎯 Take Profit (%)
🛑 Stop Loss (%)
This happens because statistically setting fixed exit structures in the vast majority of times, presents a superior result on the capital/equity curve, throughout history and for the vast majority of setups compared to other exit methods.
This is due to a mathematical principle of simplicity, 'avoiding more noise'.
Thus whenever the Quantitative THEMIS strategy takes a position it has a target and a defined maximum stop percentage.
1️⃣6️⃣ : ⚠️ Risk Profile
The strategy, currently has 3 risk profiles ⚠️ patterns for 'fixed percentage exits': Take Profit (%) and Stop Loss (%) .
They are: ⚠️ Rich's Profiles
✔️🆑 Conservative: 🎯 TP=2.7 % 🛑 SL=2.7 %
❌Ⓜ️ Moderate: 🎯 TP=2.8 % 🛑 SL=2.7 %
❌🅰 Aggressive: 🎯 TP=1.6 % 🛑 SL=6.9 %
You will be able to select and switch between the above options and profiles through the 'input' menu of the strategy by navigating to the "⚠️ Risk Profile" menu.
You can then select, test and apply the Risk Profile above that best suits your risk management, expectations and reality , as well as customize all the 'fixed exit' values through the TP and SL menus below.
1️⃣7️⃣ : ⭕ Moving Exits : (Indicators)
The strategy currently also has 'Moving Exits' based on indicator signals.
These are Moving Exits (Indicators)
📈 LONG : (EXIT)
🧃 (MAO) Short : true
📉 SHORT : (EXIT)
🧃 (MAO) Long: false
You can select and toggle between the above options through the 'input' menu of the strategy by navigating to the "LONG : Exit" and "SHORT : Exit" menu.
1️⃣8️⃣ : 💸 Initial Capital
By default the "Initial Capital" set for entries and backtests of this strategy is: 10000 $
You can set another value for the 'Starting Capital' through the tradingview menu under "properties" , and edit the value of the "Initial Capital" field.
This way you can set and test other 'Entry Values' for your trades, tests and backtests.
1️⃣9️⃣ : ⚙️ Entry Options
By default the 'order size' set for this strategy is 100 % of the 'initial capital' on each new trade.
You can set and test other entry options like : contracts , cash , % of equity
You should make these changes directly in the input menu of the strategy by navigating to the menu "⚙️ Properties : TradingView" below.
⚙️ Properties : (TradingView)
📊 Strategy Type: strategy.position_size != 1
📝💲 % Order Type: % of equity
📝💲 % Order Size: 100
Leverage: 1
So you can define and test other 'Entry Options' for your trades, tests and backtests.
2️⃣0️⃣ : ❓ How to Automate this Strategy ❓ : 🤖 Automation : 'Third-Party Services'
It is possible to automate the signals of this strategy for any centralized or decentralized broker, as well as for messaging services: Discord, Telegram and Twitter.
All in an extremely simple and uncomplicated way through the tutorials available in PDF /VIDEO for our Titan Pro 👽 subscriber community.
With our tutorials in PDF and Video it will be possible to automate the signals of this strategy for the chosen service in an extremely simple way with less than 10 steps only.
Tradingview naturally doesn't count with native integration between brokers and tradingview.
But it is possible to use 'third party services' to do the integration and automation between Tradingview and your centralized or decentralized broker.
Here are the standard, available and recommended 'third party services' to automate the signals from the 'Quantitative THEMIS' strategy on the tradingview for your broker:
1) Wundertrading (Recommended):
2) 3commas:
3) Zignaly:
4) Aleeert.com (Recommended):
5) Alertatron:
Note! 'Third party services' cannot perform 'withdrawals' via their key 'API', they can only open positions, so your funds will always be 'safe' in your brokerage firm, being traded via the 'API', when they receive an entry and exit signal from this strategy.
2️⃣1️⃣ : ❓ How to Automate this Strategy ❓ : 🤖 Automation : 'Exchanges
You can automate this strategy for any of the brokers below, through your broker's 'API' by connecting it to the 'third party automation services' for tradingview available and mentioned in the menu above:
1) Binance (Recommended)
2) Bitmex
3) Bybit
4) KuCoin
5) Deribit
6) OKX
7) Coinbase
8) Huobi
9) Bitfinex
10) Bitget
11) Bittrex
12) Bitstamp
13) Gate. io
14) Kraken
15) Gemini
16) Ascendex
17) VCCE
2️⃣2️⃣ : ❓ How to Automate this Strategy ❓ : 🤖 Automation : 'Messaging Services'
You can also automate and monitor the signals of this strategy much more efficiently by sending them to the following popular messaging services:
1) Discord
2) Telegram
3) Twitter
2️⃣3️⃣ : ❓ How to Automate this Strategy ❓ : 🤖 Automation : '🧲🤖Copy-Trading'
It will also be possible to copy/replicate the entries and exits of this strategy to your broker in an extremely simple and agile way, through the available copy-trader services.
This way it will be possible to replicate the signals of this strategy at each entry and exit to your broker through the API connecting it to the integrated copy-trader services available through the tradingview automation services below:
1) Wundetrading:
2) Zignaly:
2️⃣4️⃣ : ❔ Why be a Titan Pro 👽❔
I believe that today I am at another level in 'pinescript' development.
I consider myself today a true unicorn as a pinescript developer, someone unique and very rare.
If you choose another tool or another pinescript service, this tool will be just another one, with no real results.
But if you join our Titan community, you will have access to a unique tool! And you will get real results!
I already earn money consistently with statistical and automated trading and as an expert pinescript developer.
I am here to evolve my skills as much as possible, and one day become a pinescript 'Wizard'.
So excellence, quality and professionalism will always be my north here.
You will never find a developer like me, and who will take so seriously such a revolutionary project as this one. A Maverick! ▬ The man never stops!
Here you will find the highest degree of sophistication and development in the market for 'pinescript'.
You will get the best of me and the best of pinescript possible.
Let me show you how a professional in my field does it.
Become a Titan Pro Member 👽 and get Full Access to this strategy and all the Automation Tutorials.
Be the Titan in your life!
2️⃣5️⃣ : ❔ Why be a Titan Aff 🛸❔
Get financial return for your referrals, Decentralize the World, and raise the collective consciousness.
2️⃣6️⃣ : 📋 Summary : ⚖️ Strategy: Titan Investments|Quantitative THEMIS|Pro|BINANCE:BTCUSDTP:4h
® Titan Investimentos | Quantitative THEMIS ⚖️ | Pro 👽 2.6 | Dev: © FilipeSoh 🧙 | 🤖 100% Automated : Discord, Telegram, Twitter, Wundertrading, 3commas, Zignaly, Aleeert, Alertatron, Uniswap-v3 | BINANCE:BTCUSDTPERP 4h
🛒 Subscribe this strategy ❗️ Be a Titan Member 🏛️
🛒 Titan Pro 👽 🏛️ Titan Pro 👽 Version with ✔️100% Integrated Automation 🤖 and 📚 Automation Tutorials ✔️100% available at: (PDF/VIDEO)
🛒 Titan Affiliate 🛸 🏛️ Titan Affiliate 🛸 (Subscription Sale) 🔥 Receive 50% commission
📋 Summary : QT THEMIS ⚖️
🕵️♂️ Check This Strategy..................................................................0
🦄 ® Titan Investimentos...............................................................1
👨💻 © Developer..........................................................................2
📚 Signal Automation Tutorials : (PDF/VIDEO).......................................3
👨🔧 Revision...............................................................................4
📊 Table : (BACKTEST)..................................................................5
📊 Table : (INFORMATIONS).............................................................6
⚙️ Properties : (TRADINGVIEW)........................................................7
📆 Backtest : (TRADINGVIEW)..........................................................8
⚠️ Risk Profile...........................................................................9
🟢 On 🔴 Off : (LONG/SHORT).......................................................10
📈 LONG : (ENTRY)....................................................................11
📉 SHORT : (ENTRY)...................................................................12
📈 LONG : (EXIT).......................................................................13
📉 SHORT : (EXIT)......................................................................14
🧩 (EI) External Indicator.............................................................15
📡 (QT) Quantitative...................................................................16
🎠 (FF) Forecast......................................................................17
🅱 (BB) Bollinger Bands................................................................18
🧃 (MAP) Moving Average Primary......................................................19
🧃 (MAP) Labels.........................................................................20
🍔 (MAQ) Moving Average Quaternary.................................................21
🍟 (MACD) Moving Average Convergence Divergence...............................22
📣 (VWAP) Volume Weighted Average Price........................................23
🪀 (HL) HILO..........................................................................24
🅾 (OBV) On Balance Volume.........................................................25
🥊 (SAR) Stop and Reverse...........................................................26
🛡️ (DSR) Dynamic Support and Resistance..........................................27
🔊 (VD) Volume Directional..........................................................28
🧰 (RSI) Relative Momentum Index.................................................29
🎯 (TP) Take Profit %..................................................................30
🛑 (SL) Stop Loss %....................................................................31
🤖 Automation Selected...............................................................32
📱💻 Discord............................................................................33
📱💻 Telegram..........................................................................34
📱💻 Twitter...........................................................................35
🤖 Wundertrading......................................................................36
🤖 3commas............................................................................37
🤖 Zignaly...............................................................................38
🤖 Aleeert...............................................................................39
🤖 Alertatron...........................................................................40
🤖 Uniswap-v3..........................................................................41
🧲🤖 Copy-Trading....................................................................42
♻️ ® No Repaint........................................................................43
🔒 Copyright ©️..........................................................................44
🏛️ Be a Titan Member..................................................................45
Nº Active Users..........................................................................46
⏱ Time Left............................................................................47
| 0 | 🕵️♂️ Check This Strategy
🕵️♂️ Version Demo: 🐄 Version with ❌non-integrated automation 🤖 and 📚 Tutorials for automation ❌not available
🕵️♂️ Version Pro: 👽 Version with ✔️100% Integrated Automation 🤖 and 📚 Automation Tutorials ✔️100% available at: (PDF/VIDEO)
| 1 | 🦄 ® Titan Investimentos
Decentralizing the World 🗺
Raising the Collective Conscience 🗺
🦄Site:
🦄TradingView: www.tradingview.com
🦄Discord:
🦄Telegram:
🦄Youtube:
🦄Twitter:
🦄Instagram:
🦄TikTok:
🦄Linkedin:
🦄E-mail:
| 2 | 👨💻 © Developer
🧠 Developer: @FilipeSoh🧙
📺 TradingView: www.tradingview.com
☑️ Linkedin:
✅ Fiverr:
✅ Upwork:
🎥 YouTube:
🐤 Twitter:
🤳 Instagram:
| 3 | 📚 Signal Automation Tutorials : (PDF/VIDEO)
📚 Discord: 🔗 Link: 🔒Titan Pro👽
📚 Telegram: 🔗 Link: 🔒Titan Pro👽
📚 Twitter: 🔗 Link: 🔒Titan Pro👽
📚 Wundertrading: 🔗 Link: 🔒Titan Pro👽
📚 3comnas: 🔗 Link: 🔒Titan Pro👽
📚 Zignaly: 🔗 Link: 🔒Titan Pro👽
📚 Aleeert: 🔗 Link: 🔒Titan Pro👽
📚 Alertatron: 🔗 Link: 🔒Titan Pro👽
📚 Uniswap-v3: 🔗 Link: 🔒Titan Pro👽
📚 Copy-Trading: 🔗 Link: 🔒Titan Pro👽
| 4 | 👨🔧 Revision
👨🔧 Start Of Operations: 01 Jan 2019 21:00 -0300 💡 Start Of Operations (Skin in the game) : Revision 1.0
👨🔧 Previous Review: 01 Jan 2022 21:00 -0300 💡 Previous Review : Revision 2.0
👨🔧 Current Revision: 01 Jan 2023 21:00 -0300 💡 Current Revision : Revision 2.6
👨🔧 Next Revision: 28 May 2023 21:00 -0300 💡 Next Revision : Revision 2.7
| 5 | 📊 Table : (BACKTEST)
📊 Table: true
🖌️ Style: label.style_label_left
📐 Size: size_small
📏 Line: defval
🎨 Color: #131722
| 6 | 📊 Table : (INFORMATIONS)
📊 Table: false
🖌️ Style: label.style_label_right
📐 Size: size_small
📏 Line: defval
🎨 Color: #131722
| 7 | ⚙️ Properties : (TradingView)
📊 Strategy Type: strategy.position_size != 1
📝💲 % Order Type: % of equity
📝💲 % Order Size: 100 %
🚀 Leverage: 1
| 8 | 📆 Backtest : (TradingView)
🗓️ Mon: true
🗓️ Tue: true
🗓️ Wed: true
🗓️ Thu: true
🗓️ Fri: true
🗓️ Sat: true
🗓️ Sun: true
📆 Range: custom
📆 Start: UTC 31 Oct 2008 00:00
📆 End: UTC 31 Oct 2030 23:45
📆 Session: 0000-0000
📆 UTC: UTC
| 9 | ⚠️ Risk Profile
✔️🆑 Conservative: 🎯 TP=2.7 % 🛑 SL=2.7 %
❌Ⓜ️ Moderate: 🎯 TP=2.8 % 🛑 SL=2.7 %
❌🅰 Aggressive: 🎯 TP=1.6 % 🛑 SL=6.9 %
| 10 | 🟢 On 🔴 Off : (LONG/SHORT)
🟢📈 LONG: true
🟢📉 SHORT: true
| 11 | 📈 LONG : (ENTRY)
📡 (QT) Long: true
🧃 (MAP) Long: false
🅱 (BB) Long: false
🍟 (MACD) Long: false
🅾 (OBV) Long: false
| 12 | 📉 SHORT : (ENTRY)
📡 (QT) Short: true
🧃 (MAP) Short: false
🅱 (BB) Short: false
🍟 (MACD) Short: false
🅾 (OBV) Short: false
| 13 | 📈 LONG : (EXIT)
🧃 (MAP) Short: true
| 14 | 📉 SHORT : (EXIT)
🧃 (MAP) Long: false
| 15 | 🧩 (EI) External Indicator
🧩 (EI) Connect your external indicator/filter: false
🧩 (EI) Connect your indicator here (Study mode only): close
🧩 (EI) Connect your indicator here (Study mode only): close
| 16 | 📡 (QT) Quantitative
📡 (QT) Quantitative: true
📡 (QT) Market: BINANCE:BTCUSDTPERP
📡 (QT) Dice: openai
| 17 | 🎠 (FF) Forecast
🎠 (FF) Include current unclosed current candle: true
🎠 (FF) Forecast Type: flat
🎠 (FF) Nº of candles to use in linear regression: 3
| 18 | 🅱 (BB) Bollinger Bands
🅱 (BB) Bollinger Bands: true
🅱 (BB) Type: EMA
🅱 (BB) Period: 20
🅱 (BB) Source: close
🅱 (BB) Multiplier: 2
🅱 (BB) Linewidth: 0
🅱 (BB) Color: #131722
| 19 | 🧃 (MAP) Moving Average Primary
🧃 (MAP) Moving Average Primary: true
🧃 (MAP) BarColor: false
🧃 (MAP) Background: false
🧃 (MAP) Type: SMA
🧃 (MAP) Source: open
🧃 (MAP) Period: 100
🧃 (MAP) Multiplier: 2.0
🧃 (MAP) Linewidth: 2
🧃 (MAP) Color P: #42bda8
🧃 (MAP) Color N: #801922
| 20 | 🧃 (MAP) Labels
🧃 (MAP) Labels: true
🧃 (MAP) Style BUY ZONE: shape.labelup
🧃 (MAP) Color BUY ZONE: #42bda8
🧃 (MAP) Style SELL ZONE: shape.labeldown
🧃 (MAP) Color SELL ZONE: #801922
| 21 | 🍔 (MAQ) Moving Average Quaternary
🍔 (MAQ) Moving Average Quaternary: true
🍔 (MAQ) BarColor: false
🍔 (MAQ) Background: false
🍔 (MAQ) Type: SMA
🍔 (MAQ) Source: close
🍔 (MAQ) Primary: 14
🍔 (MAQ) Secondary: 22
🍔 (MAQ) Tertiary: 44
🍔 (MAQ) Quaternary: 16
🍔 (MAQ) Linewidth: 0
🍔 (MAQ) Color P: #42bda8
🍔 (MAQ) Color N: #801922
| 22 | 🍟 (MACD) Moving Average Convergence Divergence
🍟 (MACD) Macd Type: EMA
🍟 (MACD) Signal Type: EMA
🍟 (MACD) Source: close
🍟 (MACD) Fast: 12
🍟 (MACD) Slow: 26
🍟 (MACD) Smoothing: 9
| 23 | 📣 (VWAP) Volume Weighted Average Price
📣 (VWAP) Source: close
📣 (VWAP) Period: 340
📣 (VWAP) Momentum A: 84
📣 (VWAP) Momentum B: 150
📣 (VWAP) Average Volume: 1
📣 (VWAP) Multiplier: 1
📣 (VWAP) Diviser: 2
| 24 | 🪀 (HL) HILO
🪀 (HL) Type: SMA
🪀 (HL) Function: Maverick🧙
🪀 (HL) Source H: high
🪀 (HL) Source L: low
🪀 (HL) Period: 20
🪀 (HL) Momentum: 26
🪀 (HL) Diviser: 2
🪀 (HL) Multiplier: 1
| 25 | 🅾 (OBV) On Balance Volume
🅾 (OBV) Type: EMA
🅾 (OBV) Source: close
🅾 (OBV) Period: 16
🅾 (OBV) Diviser: 2
🅾 (OBV) Multiplier: 1
| 26 | 🥊 (SAR) Stop and Reverse
🥊 (SAR) Source: close
🥊 (SAR) High: 1.8
🥊 (SAR) Mid: 1.6
🥊 (SAR) Low: 1.6
🥊 (SAR) Diviser: 2
🥊 (SAR) Multiplier: 1
| 27 | 🛡️ (DSR) Dynamic Support and Resistance
🛡️ (DSR) Source D: close
🛡️ (DSR) Source R: high
🛡️ (DSR) Source S: low
🛡️ (DSR) Momentum R: 0
🛡️ (DSR) Momentum S: 2
🛡️ (DSR) Diviser: 2
🛡️ (DSR) Multiplier: 1
| 28 | 🔊 (VD) Volume Directional
🔊 (VD) Type: SMA
🔊 (VD) Period: 68
🔊 (VD) Momentum: 3.8
🔊 (VD) Diviser: 2
🔊 (VD) Multiplier: 1
| 29 | 🧰 (RSI) Relative Momentum Index
🧰 (RSI) Type UP: EMA
🧰 (RSI) Type DOWN: EMA
🧰 (RSI) Source: close
🧰 (RSI) Period: 29
🧰 (RSI) Smoothing: 22
🧰 (RSI) Momentum R: 64
🧰 (RSI) Momentum S: 142
🧰 (RSI) Diviser: 2
🧰 (RSI) Multiplier: 1
| 30 | 🎯 (TP) Take Profit %
🎯 (TP) Take Profit: false
🎯 (TP) %: 2.2
🎯 (TP) Color: #42bda8
🎯 (TP) Linewidth: 1
| 31 | 🛑 (SL) Stop Loss %
🛑 (SL) Stop Loss: false
🛑 (SL) %: 2.7
🛑 (SL) Color: #801922
🛑 (SL) Linewidth: 1
| 32 | 🤖 Automation : Discord | Telegram | Twitter | Wundertrading | 3commas | Zignaly | Aleeert | Alertatron | Uniswap-v3
🤖 Automation Selected : Discord
| 33 | 🤖 Discord
🔗 Link Discord: discord.com
🔗 Link 📚 Automation: 🔒Titan Pro👽
📱💻 Discord ▬ Enter Long: 🔒Titan Pro👽
📱💻 Discord ▬ Exit Long: 🔒Titan Pro👽
📱💻 Discord ▬ Enter Short: 🔒Titan Pro👽
📱💻 Discord ▬ Exit Short: 🔒Titan Pro👽
| 34 | 🤖 Telegram
🔗 Link Telegram: telegram.org
🔗 Link 📚 Automation: 🔒Titan Pro👽
📱💻 Telegram ▬ Enter Long: 🔒Titan Pro👽
📱💻 Telegram ▬ Exit Long: 🔒Titan Pro👽
📱💻 Telegram ▬ Enter Short: 🔒Titan Pro👽
📱💻 Telegram ▬ Exit Short: 🔒Titan Pro👽
| 35 | 🤖 Twitter
🔗 Link Twitter: twitter.com
🔗 Link 📚 Automation: 🔒Titan Pro👽
📱💻 Twitter ▬ Enter Long: 🔒Titan Pro👽
📱💻 Twitter ▬ Exit Long: 🔒Titan Pro👽
📱💻 Twitter ▬ Enter Short: 🔒Titan Pro👽
📱💻 Twitter ▬ Exit Short: 🔒Titan Pro👽
| 36 | 🤖 Wundertrading : Binance | Bitmex | Bybit | KuCoin | Deribit | OKX | Coinbase | Huobi | Bitfinex | Bitget
🔗 Link Wundertrading: wundertrading.com
🔗 Link 📚 Automation: 🔒Titan Pro👽
📱💻 Wundertrading ▬ Enter Long: 🔒Titan Pro👽
📱💻 Wundertrading ▬ Exit Long: 🔒Titan Pro👽
📱💻 Wundertrading ▬ Enter Short: 🔒Titan Pro👽
📱💻 Wundertrading ▬ Exit Short: 🔒Titan Pro👽
| 37 | 🤖 3commas : Binance | Bybit | OKX | Bitfinex | Coinbase | Deribit | Bitmex | Bittrex | Bitstamp | Gate.io | Kraken | Gemini | Huobi | KuCoin
🔗 Link 3commas: 3commas.io
🔗 Link 📚 Automation: 🔒Titan Pro👽
📱💻 3commas ▬ Enter Long: 🔒Titan Pro👽
📱💻 3commas ▬ Exit Long: 🔒Titan Pro👽
📱💻 3commas ▬ Enter Short: 🔒Titan Pro👽
📱💻 3commas ▬ Exit Short: 🔒Titan Pro👽
| 38 | 🤖 Zignaly : Binance | Ascendex | Bitmex | Kucoin | VCCE
🔗 Link Zignaly: zignaly.com
🔗 Link 📚 Automation: 🔒Titan Pro👽
🤖 Type Automation: Profit Sharing
🤖 Type Provider: Webook
🔑 Key: 🔒Titan Pro👽
🤖 pair: BTCUSDTP
🤖 exchange: binance
🤖 exchangeAccountType: futures
🤖 orderType: market
🚀 leverage: 1x
% positionSizePercentage: 100 %
💸 positionSizeQuote: 10000 $
🆔 signalId: @Signal1234
| 39 | 🤖 Aleeert : Binance
🔗 Link Aleeert: aleeert.com
🔗 Link 📚 Automation: 🔒Titan Pro👽
📱💻 Aleeert ▬ Enter Long: 🔒Titan Pro👽
📱💻 Aleeert ▬ Exit Long: 🔒Titan Pro👽
📱💻 Aleeert ▬ Enter Short: 🔒Titan Pro👽
📱💻 Aleeert ▬ Exit Short: 🔒Titan Pro👽
| 40 | 🤖 Alertatron : Binance | Bybit | Deribit | Bitmex
🔗 Link Alertatron: alertatron.com
🔗 Link 📚 Automation: 🔒Titan Pro👽
📱💻 Alertatron ▬ Enter Long: 🔒Titan Pro👽
📱💻 Alertatron ▬ Exit Long: 🔒Titan Pro👽
📱💻 Alertatron ▬ Enter Short: 🔒Titan Pro👽
📱💻 Alertatron ▬ Exit Short: 🔒Titan Pro👽
| 41 | 🤖 Uniswap-v3
🔗 Link Alertatron: uniswap.org
🔗 Link 📚 Automation: 🔒Titan Pro👽
📱💻 Uniswap-v3 ▬ Enter Long: 🔒Titan Pro👽
📱💻 Uniswap-v3 ▬ Exit Long: 🔒Titan Pro👽
📱💻 Uniswap-v3 ▬ Enter Short: 🔒Titan Pro👽
📱💻 Uniswap-v3 ▬ Exit Short: 🔒Titan Pro👽
| 42 | 🧲🤖 Copy-Trading : Zignaly | Wundertrading
🔗 Link 📚 Copy-Trading: 🔒Titan Pro👽
🧲🤖 Copy-Trading ▬ Zignaly: 🔒Titan Pro👽
🧲🤖 Copy-Trading ▬ Wundertrading: 🔒Titan Pro👽
| 43 | ♻️ ® Don't Repaint!
♻️ This Strategy does not Repaint!: ® Signs Do not repaint❕
♻️ This is a Real Strategy!: Quality : ® Titan Investimentos
📋️️ Get more information about Repainting here:
| 44 | 🔒 Copyright ©️
🔒 Copyright ©️: Copyright © 2023-2024 All rights reserved, ® Titan Investimentos
🔒 Copyright ©️: ® Titan Investimentos
🔒 Copyright ©️: Unique and Exclusive Strategy. All rights reserved
| 45 | 🏛️ Be a Titan Members
🏛️ Titan Pro 👽 Version with ✔️100% Integrated Automation 🤖 and 📚 Automation Tutorials ✔️100% available at: (PDF/VIDEO)
🏛️ Titan Affiliate 🛸 (Subscription Sale) 🔥 Receive 50% commission
| 46 | ⏱ Time Left
Time Left Titan Demo 🐄: ⏱♾ | ⏱ : ♾ Titan Demo 🐄 Version with ❌non-integrated automation 🤖 and 📚 Tutorials for automation ❌not available
Time Left Titan Pro 👽: 🔒Titan Pro👽 | ⏱ : Pro Plans: 30 Days, 90 Days, 12 Months, 24 Months. (👽 Pro 🅼 Monthly, 👽 Pro 🆀 Quarterly, 👽 Pro🅰 Annual, 👽 Pro👾Two Years)
| 47 | Nº Active Users
Nº Active Subscribers Titan Pro 👽: 5️⃣6️⃣ | 1✔️ 5✔️ 10✔️ 100❌ 1K❌ 10K❌ 50K❌ 100K❌ 1M❌ 10M❌ 100M❌ : ⏱ Active Users is updated every 24 hours (Check on indicator)
Nº Active Affiliates Titan Aff 🛸: 6️⃣ | 1✔️ 5✔️ 10❌ 100❌ 1K❌ 10K❌ 50K❌ 100K❌ 1M❌ 10M❌ 100M❌ : ⏱ Active Users is updated every 24 hours (Check on indicator)
2️⃣7️⃣ : 📊 PERFORMANCE : 🆑 Conservative
📊 Exchange: Binance
📊 Pair: BINANCE: BTCUSDTPERP
📊 TimeFrame: 4h
📊 Initial Capital: 10000 $
📊 Order Type: % equity
📊 Size Per Order: 100 %
📊 Commission: 0.03 %
📊 Pyramid: 1
• ⚠️ Risk Profile: 🆑 Conservative: 🎯 TP=2.7 % | 🛑 SL=2.7 %
• 📆All years: 🆑 Conservative: 🚀 Leverage 1️⃣x
📆 Start: September 23, 2019
📆 End: January 11, 2023
📅 Days: 1221
📅 Bars: 7325
Net Profit:
🟢 + 1669.89 %
💲 + 166989.43 USD
Total Close Trades:
⚪️ 369
Percent Profitable:
🟡 64.77 %
Profit Factor:
🟢 2.314
DrawDrown Maximum:
🔴 -24.82 %
💲 -10221.43 USD
Avg Trade:
💲 + 452.55 USD
✔️ Trades Winning: 239
❌ Trades Losing: 130
✔️ Average Gross Win: + 12.31 %
❌ Average Gross Loss: - 9.78 %
✔️ Maximum Consecutive Wins: 9
❌ Maximum Consecutive Losses: 6
% Average Gain Annual: 499.33 %
% Average Gain Monthly: 41.61 %
% Average Gain Weekly: 9.6 %
% Average Gain Day: 1.37 %
💲 Average Gain Annual: 49933 $
💲 Average Gain Monthly: 4161 $
💲 Average Gain Weekly: 960 $
💲 Average Gain Day: 137 $
• 📆 Year: 2020: 🆑 Conservative: 🚀 Leverage 1️⃣x
• 📆 Year: 2021: 🆑 Conservative: 🚀 Leverage 1️⃣x
• 📆 Year: 2022: 🆑 Conservative: 🚀 Leverage 1️⃣x
2️⃣8️⃣ : 📊 PERFORMANCE : Ⓜ️ Moderate
📊 Exchange: Binance
📊 Pair: BINANCE: BTCUSDTPERP
📊 TimeFrame: 4h
📊 Initial Capital: 10000 $
📊 Order Type: % equity
📊 Size Per Order: 100 %
📊 Commission: 0.03 %
📊 Pyramid: 1
• ⚠️ Risk Profile: Ⓜ️ Moderate: 🎯 TP=2.8 % | 🛑 SL=2.7 %
• 📆 All years: Ⓜ️ Moderate: 🚀 Leverage 1️⃣x
📆 Start: September 23, 2019
📆 End: January 11, 2023
📅 Days: 1221
📅 Bars: 7325
Net Profit:
🟢 + 1472.04 %
💲 + 147199.89 USD
Total Close Trades:
⚪️ 362
Percent Profitable:
🟡 63.26 %
Profit Factor:
🟢 2.192
DrawDrown Maximum:
🔴 -22.69 %
💲 -9269.33 USD
Avg Trade:
💲 + 406.63 USD
✔️ Trades Winning: 229
❌ Trades Losing : 133
✔️ Average Gross Win: + 11.82 %
❌ Average Gross Loss: - 9.29 %
✔️ Maximum Consecutive Wins: 9
❌ Maximum Consecutive Losses: 8
% Average Gain Annual: 440.15 %
% Average Gain Monthly: 36.68 %
% Average Gain Weekly: 8.46 %
% Average Gain Day: 1.21 %
💲 Average Gain Annual: 44015 $
💲 Average Gain Monthly: 3668 $
💲 Average Gain Weekly: 846 $
💲 Average Gain Day: 121 $
• 📆 Year: 2020: Ⓜ️ Moderate: 🚀 Leverage 1️⃣x
• 📆 Year: 2021: Ⓜ️ Moderate: 🚀 Leverage 1️⃣x
• 📆 Year: 2022: Ⓜ️ Moderate: 🚀 Leverage 1️⃣x
2️⃣9️⃣ : 📊 PERFORMANCE : 🅰 Aggressive
📊 Exchange: Binance
📊 Pair: BINANCE: BTCUSDTPERP
📊 TimeFrame: 4h
📊 Initial Capital: 10000 $
📊 Order Type: % equity
📊 Size Per Order: 100 %
📊 Commission: 0.03 %
📊 Pyramid: 1
• ⚠️ Risk Profile: 🅰 Aggressive: 🎯 TP=1.6 % | 🛑 SL=6.9 %
• 📆 All years: 🅰 Aggressive: 🚀 Leverage 1️⃣x
📆 Start: September 23, 2019
📆 End: January 11, 2023
📅 Days: 1221
📅 Bars: 7325
Net Profit:
🟢 + 989.38 %
💲 + 98938.38 USD
Total Close Trades:
⚪️ 380
Percent Profitable:
🟢 84.47 %
Profit Factor:
🟢 2.156
DrawDrown Maximum:
🔴 -17.88 %
💲 -9182.84 USD
Avg Trade:
💲 + 260.36 USD
✔️ Trades Winning: 321
❌ Trades Losing: 59
✔️ Average Gross Win: + 5.75 %
❌ Average Gross Loss: - 14.51 %
✔️ Maximum Consecutive Wins: 21
❌ Maximum Consecutive Losses: 6
% Average Gain Annual: 295.84 %
% Average Gain Monthly: 24.65 %
% Average Gain Weekly: 5.69 %
% Average Gain Day: 0.81 %
💲 Average Gain Annual: 29584 $
💲 Average Gain Monthly: 2465 $
💲 Average Gain Weekly: 569 $
💲 Average Gain Day: 81 $
• 📆 Year: 2020: 🅰 Aggressive: 🚀 Leverage 1️⃣x
• 📆 Year: 2021: 🅰 Aggressive: 🚀 Leverage 1️⃣x
• 📆 Year: 2022: 🅰 Aggressive: 🚀 Leverage 1️⃣x
3️⃣0️⃣ : 🛠️ Roadmap
🛠️• 14/ 01 /2023 : Titan THEMIS Launch
🛠️• Updates January/2023 :
• 📚 Tutorials for Automation 🤖 already Available : ✔️
• ✔️ Discord
• ✔️ Wundertrading
• ✔️ Zignaly
• 📚 Tutorials for Automation 🤖 In Preparation : ⭕
• ⭕ Telegram
• ⭕ Twitter
• ⭕ 3comnas
• ⭕ Aleeert
• ⭕ Alertatron
• ⭕ Uniswap-v3
• ⭕ Copy-Trading
🛠️• Updates February/2023 :
• 📰 Launch of advertising material for Titan Affiliates 🛸
• 🛍️🎥🖼️📊 (Sales Page/VSL/Videos/Creative/Infographics)
🛠️• 28/05/2023 : Titan THEMIS update ▬ Version 2.7
🛠️• 28/05/2023 : BOT BOB release ▬ Version 1.0
• (Native Titan THEMIS Automation - Through BOT BOB, a bot for automation of signals, indicators and strategies of TradingView, of own code ▬ in validation.
• BOT BOB
Automation/Connection :
• API - For Centralized Brokers.
• Smart Contracts - Wallet Web - For Decentralized Brokers.
• This way users can automate any indicator or strategy of TradingView and Titan in a decentralized, secure and simplified way.
• Without having the need to use 'third party services' for automating TradingView indicators and strategies like the ones available above.
🛠️• 28/05/2023 : Release ▬ Titan Culture Guide 📝
3️⃣1️⃣ : 🧻 Notes ❕
🧻 • Note ❕ The "Demo 🐄" version, ❌does not have 'integrated automation', to automate the signals of this strategy and enjoy a fully automated system, you need to have access to the Pro version with '100% integrated automation' and all the tutorials for automation available. Become a Titan Pro 👽
🧻 • Note ❕ You will also need to be a "Pro User or higher on Tradingview", to be able to use the webhook feature available only for 'paid' profiles on the platform.
With the webhook feature it is possible to send the signals of this strategy to almost anywhere, in our case to centralized or decentralized brokerages, also to popular messaging services such as: Discord, Telegram or Twiter.
3️⃣2️⃣ : 🚨 Disclaimer ❕❗
🚨 • Disclaimer ❕❕ Past positive result and performance of a system does not guarantee its positive result and performance for the future!
🚨 • Disclaimer ❗❗❗ When using this strategy: Titan Investments is totally Exempt from any claim of liability for losses. The responsibility on the management of your funds is solely yours. This is a very high risk/volatility market! Understand your place in the market.
3️⃣3️⃣ : ♻️ ® No Repaint
This Strategy does not Repaint! This is a real strategy!
3️⃣4️⃣ : 🔒 Copyright ©️
Copyright © 2022-2023 All rights reserved, ® Titan Investimentos
3️⃣5️⃣ : 👏 Acknowledgments
I want to start this message in thanks to TradingView and all the Pinescript community for all the 'magic' created here, a unique ecosystem! rich and healthy, a fertile soil, a 'new world' of possibilities, for a complete deepening and improvement of our best personal skills.
I leave here my immense thanks to the whole community: Tradingview, Pinecoders, Wizards and Moderators.
I was not born Rich .
Thanks to TradingView and pinescript and all its transformation.
I could develop myself and the best of me and the best of my skills.
And consequently build wealth and patrimony.
Gratitude.
One more story for the infinite book !
If you were born poor you were born to be rich !
Raising🔼 the level and raising🔼 the ruler! 📏
My work is my 'debauchery'! Do better! 💐🌹
Soul of a first-timer! Creativity Exudes! 🦄
This is the manifestation of God's magic in me. This is the best of me. 🧙
You will copy me, I know. So you owe me. 💋
My mission here is to raise the consciousness and self-esteem of all Titans and Titanids! Welcome! 🧘 🏛️
The only way to accomplish great work is to do what you love ! Before I learned to program I was wasting my life!
Death is the best creation of life .
Now you are the new , but in the not so distant future you will gradually become the old . Here I stay forever!
Playing the game like an Athlete! 🖼️ Enjoy and Enjoy 🍷 🗿
In honor of: BOB ☆
1 name, 3 letters, 3 possibilities, and if read backwards it's the same thing, a palindrome. ☘
Gratitude to the oracles that have enabled me the 'luck' to get this far: Dal&Ni&Fer
3️⃣6️⃣ : 👮 House Rules : 📺 TradingView
House Rules : This publication and strategy follows all TradingView house guidelines and rules:
📺 TradingView House Rules: www.tradingview.com
📺 Script publication rules: www.tradingview.com
📺 Vendor requirements: www.tradingview.com
📺 Links/References rules: www.tradingview.com
3️⃣7️⃣ : 🏛️ Become a Titan Pro member 👽
🟩 Titan Pro 👽 🟩
3️⃣8️⃣ : 🏛️ Be a member Titan Aff 🛸
🟥 Titan Affiliate 🛸 🟥

Titan Investments|Quantitative THEMIS|Demo|BINANCE:BTCUSDTP:4hInvestment Strategy (Quantitative Trading)
| 🛑 | Watch "LIVE" and 'COPY' this strategy in real time:
🔗 Link: www.tradingview.com
Hello, welcome, feel free 🌹💐
Since the stone age to the most technological age, one thing has not changed, that which continues impress human beings the most, is the other human being!
Deep down, it's all very simple or very complicated, depends on how you look at it.
I believe that everyone was born to do something very well in life.
But few are those who have, let's use the word 'luck' .
Few are those who have the 'luck' to discover this thing.
That is why few are happy and successful in their jobs and professions.
Thank God I had this 'luck' , and discovered what I was born to do well.
And I was born to program. 👨💻
📋 Summary : Project Titan
0️⃣ : 🦄 Project Titan
1️⃣ : ⚖️ Quantitative THEMIS
2️⃣ : 🏛️ Titan Community
3️⃣ : 👨💻 Who am I ❔
4️⃣ : ❓ What is Statistical/Probabilistic Trading ❓
5️⃣ : ❓ How Statistical/Probabilistic Trading works ❓
6️⃣ : ❓ Why use a Statistical/Probabilistic system ❓
7️⃣ : ❓ Why the human brain is not prepared to do Trading ❓
8️⃣ : ❓ What is Backtest ❓
9️⃣ : ❓ How to build a Consistent system ❓
🔟 : ❓ What is a Quantitative Trading system ❓
1️⃣1️⃣ : ❓ How to build a Quantitative Trading system ❓
1️⃣2️⃣ : ❓ How to Exploit Market Anomalies ❓
1️⃣3️⃣ : ❓ What Defines a Robust, Profitable and Consistent System ❓
1️⃣4️⃣ : 🔧 Fixed Technical
1️⃣5️⃣ : ❌ Fixed Outputs : 🎯 TP(%) & 🛑SL(%)
1️⃣6️⃣ : ⚠️ Risk Profile
1️⃣7️⃣ : ⭕ Moving Exits : (Indicators)
1️⃣8️⃣ : 💸 Initial Capital
1️⃣9️⃣ : ⚙️ Entry Options
2️⃣0️⃣ : ❓ How to Automate this Strategy ❓ : 🤖 Automation : 'Third-Party Services'
2️⃣1️⃣ : ❓ How to Automate this Strategy ❓ : 🤖 Automation : 'Exchanges
2️⃣2️⃣ : ❓ How to Automate this Strategy ❓ : 🤖 Automation : 'Messaging Services'
2️⃣3️⃣ : ❓ How to Automate this Strategy ❓ : 🤖 Automation : '🧲🤖Copy-Trading'
2️⃣4️⃣ : ❔ Why be a Titan Pro 👽❔
2️⃣5️⃣ : ❔ Why be a Titan Aff 🛸❔
2️⃣6️⃣ : 📋 Summary : ⚖️ Strategy: Titan Investments|Quantitative THEMIS|Demo|BINANCE:BTCUSDTP:4h
2️⃣7️⃣ : 📊 PERFORMANCE : 🆑 Conservative
2️⃣8️⃣ : 📊 PERFORMANCE : Ⓜ️ Moderate
2️⃣9️⃣ : 📊 PERFORMANCE : 🅰 Aggressive
3️⃣0️⃣ : 🛠️ Roadmap
3️⃣1️⃣ : 🧻 Notes ❕
3️⃣2️⃣ : 🚨 Disclaimer ❕❗
3️⃣3️⃣ : ♻️ ® No Repaint
3️⃣4️⃣ : 🔒 Copyright ©️
3️⃣5️⃣ : 👏 Acknowledgments
3️⃣6️⃣ : 👮 House Rules : 📺 TradingView
3️⃣7️⃣ : 🏛️ Become a Titan Pro member 👽
3️⃣8️⃣ : 🏛️ Be a member Titan Aff 🛸
0️⃣ : 🦄 Project Titan
This is the first real, 100% automated Quantitative Strategy made available to the public and the pinescript community for TradingView.
You will be able to automate all signals of this strategy for your broker , centralized or decentralized and also for messaging services : Discord, Telegram or Twitter .
This is the first strategy of a larger project, in 2023, I will provide a total of 6 100% automated 'Quantitative' strategies to the pinescript community for TradingView.
The future strategies to be shared here will also be unique , never before seen, real 'Quantitative' bots with real, validated results in real operation.
Just like the 'Quantitative THEMIS' strategy, it will be something out of the loop throughout the pinescript/tradingview community, truly unique tools for building mutual wealth consistently and continuously for our community.
1️⃣ : ⚖️ Quantitative THEMIS : Titan Investments|Quantitative THEMIS|Demo|BINANCE:BTCUSDTP:4h
This is a truly unique and out of the curve strategy for BTC /USD .
A truly real strategy, with real, validated results and in real operation.
A unique tool for building mutual wealth, consistently and continuously for the members of the Titan community.
Initially we will operate on a monthly, quarterly, annual or biennial subscription service.
Our goal here is to build a great community, in exchange for an extremely fair value for the use of our truly unique tools, which bring and will bring real results to our community members.
With this business model it will be possible to provide all Titan users and community members with the purest and highest degree of sophistication in the market with pinescript for tradingview, providing unique and truly profitable strategies.
My goal here is to offer the best to our members!
The best 'pinescript' tradingview service in the world!
We are the only Start-Up in the world that will decentralize real and full access to truly real 'quantitative' tools that bring and will bring real results for mutual and ongoing wealth building for our community.
2️⃣ : 🏛️ Titan Community : 👽 Pro 🔁 Aff 🛸
Become a Titan Pro 👽
To get access to the strategy: "Quantitative THEMIS" , and future Titan strategies in a 100% automated way, along with all tutorials for automation.
Pro Plans: 30 Days, 90 Days, 12 Months, 24 Months.
👽 Pro 🅼 Monthly
👽 Pro 🆀 Quarterly
👽 Pro🅰 Annual
👽 Pro👾Two Years
You will have access to a truly unique system that is out of the curve .
A 100% real, 100% automated, tested, validated, profitable, and in real operation strategy.
Become a Titan Affiliate 🛸
By becoming a Titan Affiliate 🛸, you will automatically receive 50% of the value of each new subscription you refer .
You will receive 50% for any of the above plans that you refer .
This way we will encourage our community to grow in a fair and healthy way, because we know what we have in our hands and what we deliver real value to our users.
We are at the highest level of sophistication in the market, the consistency here and the results here speak for themselves.
So growing our community means growing mutual wealth and raising collective conscience.
Wealth must be created not divided.
And here we are creating mutual wealth on all ends and in all ways.
A non-zero sum system, where everybody wins.
3️⃣ : 👨💻 Who am I ❔
My name is FilipeSoh I am 26 years old, Technical Analyst, Trader, Computer Engineer, pinescript Specialist, with extensive experience in several languages and technologies.
For the last 4 years I have been focusing on developing, editing and creating pinescript indicators and strategies for Tradingview for people and myself.
Full-time passionate workaholic pinescript developer with over 10,000 hours of pinescript development.
• Pinescript expert ▬Tradingview.
• Specialist in Automated Trading
• Specialist in Quantitative Trading.
• Statistical/Probabilistic Trading Specialist - Mark Douglas Scholl.
• Inventor of the 'Classic Forecast' Indicators.
• Inventor of the 'Backtest Table'.
4️⃣ : ❓ What is Statistical/Probabilistic Trading ❓
Statistical/probabilistic trading is the only way to get a positive mathematical expectation regarding the market and consequently that is the only way to make money consistently from it.
I will present below some more details about the Quantitative THEMIS strategy, it is a real strategy, tested, validated and in real operation, 'Skin in the Game' , a consistent way to make money with statistical/probabilistic trading in a 100% automated.
I am a Technical Analyst , I used to be a Discretionary Trader , today I am 100% a Statistical Trader .
I've gotten rich and made a lot of money, and I've also lost a lot with 'leverage'.
That was a few years ago.
The book that changed everything for me was "Trading in The Zone" by Mark Douglas.
That's when I understood that the market is just a game of statistics and probability, like a casino!
It was then that I understood that the human brain is not prepared for trading, because it involves triggers and mental emotions.
And emotions in trading and in making trading decisions do not go well together, not in the long run, because you always have the burden of being wrong with the outcome of that particular position.
But remembering that the market is just a statistical game!
5️⃣ : ❓ How Statistical/Probabilistic Trading works ❓
Let's use a 'coin' as an example:
If we toss a 'coin' up 10 times.
Do you agree that it is impossible for us to know exactly the result of the 'plays' before they actually happen?
As in the example above, would you agree, that we cannot "guess" the outcome of a position before it actually happens?
As much as we cannot "guess" whether the coin will drop heads or tails on each flip.
We can analyze the "backtest" of the 10 moves made with that coin:
If we analyze the 10 moves and count the number of times the coin fell heads or tails in a specific sequence, we then have a percentage of times the coin fell heads or tails, so we have a 'backtest' of those moves.
Then on the next flip we can now assume a point or a favorable position for one side, the side with the highest probability .
In a nutshell, this is more or less how probabilistic statistical trading works.
As Statistical Traders we can never say whether such a Trader/Position we take will be a winner or a loser.
But still we can have a positive and consistent result in a "sequence" of trades, because before we even open a position, backtests have already been performed so we identify an anomaly and build a system that will have a positive statistical advantage in our favor over the market.
The advantage will not be in one trade itself, but in the "sequence" of trades as a whole!
Because our system will work like a casino, having a positive mathematical expectation relative to the players/market.
Design, develop, test models and systems that can take advantage of market anomalies, until they change.
Be the casino! - Mark Douglas
6️⃣ : ❓ Why use a Statistical/Probabilistic system ❓
In recent years I have focused and specialized in developing 100% automated trading systems, essentially for the cryptocurrency market.
I have developed many extremely robust and efficient systems, with positive mathematical expectation towards the market.
These are not complex systems per se , because here we want to avoid 'over-optimization' as much as possible.
As Da Vinci said: "Simplicity is the highest degree of sophistication".
I say this because I have tested, tried and developed hundreds of systems/strategies.
I believe I have programmed more than 10,000 unique indicators/strategies, because this is my passion and purpose in life.
I am passionate about what I do, completely!
I love statistical trading because it is the only way to get consistency in the long run!
This is why I have studied, applied, developed, and specialized in 100% automated cryptocurrency trading systems.
The reason why our systems are extremely "simple" is because, as I mentioned before, in statistical trading we want to exploit the market anomaly to the maximum, that is, this anomaly will change from time to time, usually we can exploit a trading system efficiently for about 6 to 12 months, or for a few years, that is; for fixed 'scalpers' systems.
Because at some point these anomalies will be identified , and from the moment they are identified they will be exploited and will stop being anomalies .
With the system presented here; you can even copy the indicators and input values shared here;
However; what I have to offer you is: it is me , our team , and our community !
That is, we will constantly monitor this system, for life , because our goal here is to create a unique , perpetual , profitable , and consistent system for our community.
Myself , our team and our community will keep this script periodically updated , to ensure the positive mathematical expectation of it.
So we don't mind sharing the current parameters and values , because the real value is also in the future updates that this system will receive from me and our team , guided by our culture and our community of real users !
As we are hosted on 'tradingview', all future updates for this strategy, will be implemented and updated automatically on your tradingview account.
What we want here is: to make sure you get gains from our system, because if you get gains , our ecosystem will grow as a whole in a healthy and scalable way, so we will be generating continuous mutual wealth and raising the collective consciousness .
People Need People: 3️⃣🅿
7️⃣ : ❓ Why the human brain is not prepared to do Trading ❓
Today my greatest skill is to develop statistically profitable and 100% automated strategies for 'pinescript' tradingview.
Note that I said: 'profitable' because in fact statistical trading is the only way to make money in a 'consistent' way from the market.
And consequently have a positive wealth curve every cycle, because we will be based on mathematics, not on feelings and news.
Because the human brain is not prepared to do trading.
Because trading is connected to the decision making of the cerebral cortex.
And the decision making is automatically linked to emotions, and emotions don't match with trading decision making, because in those moments, we can feel the best and also the worst sensations and emotions, and this certainly affects us and makes us commit grotesque mistakes!
That's why the human brain is not prepared to do trading.
If you want to participate in a fully automated, profitable and consistent trading system; be a Titan Pro 👽
I believe we are walking an extremely enriching path here, not only in terms of financial returns for our community, but also in terms of knowledge about probabilistic and automated statistical trading.
You will have access to an extremely robust system, which was built upon very strong concepts and foundations, and upon the world's main asset in a few years: Bitcoin .
We are the tip of the best that exists in the cryptocurrency market when it comes to probabilistic and automated statistical trading.
Result is result! Me being dressed or naked.
This is just the beginning!
But there is a way to consistently make money from the market.
Being the Casino! - Mark Douglas
8️⃣ : ❓ What is Backtest ❓
Imagine the market as a purely random system, but even in 'randomness' there are patterns.
So now imagine the market and statistical trading as follows:
Repeating the above 'coin' example, let's think of it as follows:
If we toss a coin up 10 times again.
It is impossible to know which flips will have heads or tails, correct?
But if we analyze these 10 tosses, then we will have a mathematical statistic of the past result, for example, 70 % of the tosses fell 'heads'.
That is:
7 moves fell on "heads" .
3 moves fell on "tails" .
So based on these conditions and on the generic backtest presented here, we could adopt " heads " as our system of moves, to have a statistical and probabilistic advantage in relation to the next move to be performed.
That is, if you define a system, based on backtests , that has a robust positive mathematical expectation in relation to the market you will have a profitable system.
For every move you make you will have a positive statistical advantage in your favor over the market before you even make the move.
Like a casino in relation to all its players!
The casino does not have an advantage over one specific player, but over all players, because it has a positive mathematical expectation about all the moves that night.
The casino will always have a positive statistical advantage over its players.
Note that there will always be real players who will make real, million-dollar bankrolls that night, but this condition is already built into the casino's 'strategy', which has a pre-determined positive statistical advantage of that night as a whole.
Statistical trading is the same thing, as long as you don't understand this you will keep losing money and consistently.
9️⃣ : ❓ How to build a Consistent system ❓
See most traders around the world perform trades believing that that specific position taken will make them filthy rich, because they simply believe faithfully that the position taken will be an undoubted winner, based on a trader's methodology: 'trading a trade' without analyzing the whole context, just using 'empirical' aspects in their system.
But if you think of trading, as a sequence of moves.
You see, 'a sequence' !
When we think statistically, it doesn't matter your result for this , or for the next specific trade , but the final sequence of trades as a whole.
As the market has a random system of results distribution , if your system has a positive statistical advantage in relation to the market, at the end of that sequence you'll have the biggest probability of having a winning bank.
That's how you do real trading!
And with consistency!
Trading is a long term game, but when you change the key you realize that it is a simple game to make money in a consistent way from the market, all you need is patience.
Even more when we are based on Bitcoin, which has its 'Halving' effect where, in theory, we will never lose money in 3 to 4 years intervals, due to its scarcity and the fact that Bitcoin is the 'discovery of digital scarcity' which makes it the digital gold, we believe in this thesis and we follow Satoshi's legacy.
So align Bitcoin with a probabilistic statistical trading system with a positive mathematical expectation of the market and 100% automated with the long term, and all you need is patience, and you will become rich.
In fact Bitcoin by itself is already a path, buy, wait for each halving and your wealth will be maintained.
No inflation, unlike fiat currencies.
This is a complete and extremely robust strategy, with the most current possible and 'not possible' techniques involved and applied here.
Today I am at another level in developing 100% automated 'quantitative' strategies.
I was born for this!
🔟 : ❓ What is a Quantitative Trading system ❓
In addition to having access to a revolutionary strategy you will have access to disruptive 100% multifunctional tables with the ability to perform 'backtests' for better tracking and monitoring of your system on a customized basis.
I would like to emphasize one thing, and that is that you keep this in mind.
Today my greatest skill in 'pinescript' is to build indicators, but mainly strategies, based on statistical and probabilistic trading, with a postive mathematical expectation in relation to the market, in a 100% automated way.
This with the goal of building a consistent and continuous positive equity curve through mathematics using data, converting it into statistical / probabilistic parameters and applying them to a Quantitative model.
Before becoming a Quantitative Trader , I was a Technical Analyst and a Discretionary Trader .
First as a position trader and then as a day trader.
Before becoming a Trader, I trained myself as a Technical Analyst , to masterly understand the shape and workings of the market in theory.
But everything changed when I met 'Mark Douglas' , when I got to know his works, that's when my head exploded 🤯, and I started to understand the market for good!
The market is nothing more than a 'random' system of distributing results.
See that I said: 'random' .
Do yourself a mental exercise.
Is there really such a thing as random ?
I believe not, as far as we know maybe the 'singularity'.
So thinking this way, to translate, the market is nothing more than a game of probability, statistics and pure mathematics.
Like a casino!
What happens is that most traders, whenever they take a position, take it with all the empirical certainty that such position will win or lose, and do not take into consideration the total sequence of results to understand their place in the market.
Understanding your place in the market gives you the ability to create and design systems that can exploit the present market anomaly, and thus make money statistically, consistently, and 100% automated.
Thinking of it this way, it is easy to make money from the market.
There are many ways to make money from the market, but the only consistent way I know of is through 'probabilistic and automated statistical trading'.
1️⃣1️⃣ : ❓ How to build a Quantitative Trading system ❓
There are some fundamental points that must be addressed here in order to understand what makes up a system based on statistics and probability applied to a quantitative model.
When we talk about 'discretionary' trading, it is a trading system based on human decisions after the defined 'empirical' conditions are met.
It is quite another thing to build a fully automated system without any human interference/interaction .
That said:
Building a statistically profitable system is perfectly possible, but this is a high level task , but with possible high rewards and consistent gains.
Here you will find a real "Skin In The Game" strategy.
With all due respect, but the vast majority of traders who post strategies on TradingView do not understand what they are doing.
Most of them do not understand the minimum complexity involved in the main variable for the construction of a real strategy, the mother variable: "strategy".
I say this by my own experience, because I have analyzed practically all the existing publications of TradingView + 200,000 indicators and strategies.
I breathe pinescript, I eat pinescript, I sleep pinescript, I bathe pinescript, I live TradingView.
But the main advantage for the TradingView users, is that all entry and exit orders made by this strategy can be checked and analyzed thoroughly, to validate and prove the veracity of this strategy, because this is a 100% real strategy.
Here there is a huge world of possibilities, but only one way to build a 'pinescript strategy' that will work correctly aligned to the real world with real results .
There are some fundamental points to take into consideration when building a profitable trading system:
The most important of these for me is: 'DrawDown' .
Followed by: 'Hit Rate' .
And only after that we use the parameter: 'Profit'.
See, this is because here, we are dealing with the 'imponderable' , and anything can happen in this scenario.
But there is one thing that makes us sleep peacefully at night, and that is: controlling losses .
That is, in other words: controlling the DrawDown .
The amateur is concerned with 'winning', the professional is concerned with conserving capital.
If we have the losses under control, then we can move on to the other two parameters: hit rate and profit.
See, the second most important factor in building a system is the hit rate.
I say this from my own experience.
I have worked with many systems with a 'low hit rate', but extremely profitable.
For example: systems with hit rates of 40 to 50%.
But as much as statistically and mathematically the profit is rewarding, operating systems with a low hit rate is always very stressful psychologically.
That's why there are two big reasons why when I build an automated trading system, I focus on the high hit rate of the system, they are
1 - To reduce psychological damage as much as possible .
2 - And more important , when we create a system with a 'high hit rate' , there is a huge intrinsic advantage here, that most statistic traders don't take in consideration.
That is: knowing more quickly when the system stops being functional.
The main advantage of a system with a high hit rate is: to identify when the system stops being functional and stop exploiting the market's anomaly.
Look: When we are talking about trading and random distribution of results on the market, do you agree that when we create a trading system, we are focused on exploring some anomaly of that market?
When that anomaly is verified by the market, it will stop being functional with time.
That's why trading systems, 'scalpers', especially for cryptocurrencies, need constant monitoring, quarterly, semi-annually or annually.
Because market movements change from time to time.
Because we go through different cycles from time to time, such as congestion cycles, accumulation , distribution , volatility , uptrends and downtrends .
1️⃣2️⃣ : ❓ How to Exploit Market Anomalies ❓
You see there is a very important point that must be stressed here.
As we are always trying to exploit an 'anomaly' in the market.
So the 'number' of indicators/tools that will integrate the system is of paramount importance.
But most traders do not take this into consideration.
To build a professional, robust, consistent, and profitable system, you don't need to use hundreds of indicators to build your setup.
This will actually make it harder to read when the setup stops working and needs some adjustment.
So focusing on a high hit rate is very important here, this is a fundamental principle that is widely ignored , and with a high hit rate, we can know much more accurately when the system is no longer functional much faster.
As Darwin said: "It is not the strongest or the most intelligent that wins the game of life, it is the most adapted.
So simple systems, as contradictory as it may seem, are more efficient, because they help to identify inflection points in the market much more quickly.
1️⃣3️⃣ : ❓ What Defines a Robust, Profitable and Consistent System ❓
See I have built, hundreds of thousands of indicators and 'pinescript' strategies, hundreds of thousands.
This is an extremely professional, robust and profitable system.
Based on the currency pairs: BTC /USDT
There are many ways and avenues to build a profitable trading setup/system.
And actually this is not a difficult task, taking in consideration, as the main factor here, that our trading and investment plan is for the long term, so consequently we will face scenarios with less noise.
He who is in a hurry eats raw.
As mentioned before.
Defining trends in pinescript is technically a simple task, the hardest task is to determine congestion zones with low volume and volatility, it's in these moments that many false signals are generated, and consequently is where most setups face their maximum DrawDown.
That's why this strategy was strictly and thoroughly planned, built on a very solid foundation, to avoid as much noise as possible, for a positive and consistent equity curve in each market cycle, 'Consistency' is our 'Mantra' around here.
1️⃣4️⃣ : 🔧 Fixed Technical
• Strategy: Titan Investments|Quantitative THEMIS|Demo|BINANCE:BTCUSDTP:4h
• Pair: BTC/USDTP
• Time Frame: 4 hours
• Broker: Binance (Recommended)
For a more conservative scenario, we have built the Quantitative THEMIS for the 4h time frame, with the main focus on consistency.
So we can avoid noise as much as possible!
1️⃣5️⃣ : ❌ Fixed Outputs : 🎯 TP(%) & 🛑SL(%)
In order to build a 'perpetual' system specific to BTC/USDT, it took a lot of testing, and more testing, and a lot of investment and research.
There is one initial and fundamental point that we can address to justify the incredible consistency presented here.
That fundamental point is our exit via Take Profit or Stop Loss percentage (%).
🎯 Take Profit (%)
🛑 Stop Loss (%)
See, today I have been testing some more advanced backtesting models for some cryptocurrency systems.
In which I perform 'backtest of backtest', i.e. we use a set of strategies each focused on a principle, operating individually, but they are part of something unique, i.e. we do 'backtests' of 'backtests' together.
What I mean is that we do a lot of backtesting around here.
I can assure you, that always the best output for a trading system is to set fixed output values!
In other words:
🎯 Take Profit (%)
🛑 Stop Loss (%)
This happens because statistically setting fixed exit structures in the vast majority of times, presents a superior result on the capital/equity curve, throughout history and for the vast majority of setups compared to other exit methods.
This is due to a mathematical principle of simplicity, 'avoiding more noise'.
Thus whenever the Quantitative THEMIS strategy takes a position it has a target and a defined maximum stop percentage.
1️⃣6️⃣ : ⚠️ Risk Profile
The strategy, currently has 3 risk profiles ⚠️ patterns for 'fixed percentage exits': Take Profit (%) and Stop Loss (%) .
They are: ⚠️ Rich's Profiles
✔️🆑 Conservative: 🎯 TP=2.7 % 🛑 SL=2.7 %
❌Ⓜ️ Moderate: 🎯 TP=2.8 % 🛑 SL=2.7 %
❌🅰 Aggressive: 🎯 TP=1.6 % 🛑 SL=6.9 %
You will be able to select and switch between the above options and profiles through the 'input' menu of the strategy by navigating to the "⚠️ Risk Profile" menu.
You can then select, test and apply the Risk Profile above that best suits your risk management, expectations and reality , as well as customize all the 'fixed exit' values through the TP and SL menus below.
1️⃣7️⃣ : ⭕ Moving Exits : (Indicators)
The strategy currently also has 'Moving Exits' based on indicator signals.
These are Moving Exits (Indicators)
📈 LONG : (EXIT)
🧃 (MAO) Short : true
📉 SHORT : (EXIT)
🧃 (MAO) Long: false
You can select and toggle between the above options through the 'input' menu of the strategy by navigating to the "LONG : Exit" and "SHORT : Exit" menu.
1️⃣8️⃣ : 💸 Initial Capital
By default the "Initial Capital" set for entries and backtests of this strategy is: 10000 $
You can set another value for the 'Starting Capital' through the tradingview menu under "properties" , and edit the value of the "Initial Capital" field.
This way you can set and test other 'Entry Values' for your trades, tests and backtests.
1️⃣9️⃣ : ⚙️ Entry Options
By default the 'order size' set for this strategy is 100 % of the 'initial capital' on each new trade.
You can set and test other entry options like : contracts , cash , % of equity
You should make these changes directly in the input menu of the strategy by navigating to the menu "⚙️ Properties : TradingView" below.
⚙️ Properties : (TradingView)
📊 Strategy Type: strategy.position_size != 1
📝💲 % Order Type: % of equity
📝💲 % Order Size: 100
Leverage: 1
So you can define and test other 'Entry Options' for your trades, tests and backtests.
2️⃣0️⃣ : ❓ How to Automate this Strategy ❓ : 🤖 Automation : 'Third-Party Services'
It is possible to automate the signals of this strategy for any centralized or decentralized broker, as well as for messaging services: Discord, Telegram and Twitter.
All in an extremely simple and uncomplicated way through the tutorials available in PDF /VIDEO for our Titan Pro 👽 subscriber community.
With our tutorials in PDF and Video it will be possible to automate the signals of this strategy for the chosen service in an extremely simple way with less than 10 steps only.
Tradingview naturally doesn't count with native integration between brokers and tradingview.
But it is possible to use 'third party services' to do the integration and automation between Tradingview and your centralized or decentralized broker.
Here are the standard, available and recommended 'third party services' to automate the signals from the 'Quantitative THEMIS' strategy on the tradingview for your broker:
1) Wundertrading (Recommended):
2) 3commas:
3) Zignaly:
4) Aleeert.com (Recommended):
5) Alertatron:
Note! 'Third party services' cannot perform 'withdrawals' via their key 'API', they can only open positions, so your funds will always be 'safe' in your brokerage firm, being traded via the 'API', when they receive an entry and exit signal from this strategy.
2️⃣1️⃣ : ❓ How to Automate this Strategy ❓ : 🤖 Automation : 'Exchanges
You can automate this strategy for any of the brokers below, through your broker's 'API' by connecting it to the 'third party automation services' for tradingview available and mentioned in the menu above:
1) Binance (Recommended)
2) Bitmex
3) Bybit
4) KuCoin
5) Deribit
6) OKX
7) Coinbase
8) Huobi
9) Bitfinex
10) Bitget
11) Bittrex
12) Bitstamp
13) Gate. io
14) Kraken
15) Gemini
16) Ascendex
17) VCCE
2️⃣2️⃣ : ❓ How to Automate this Strategy ❓ : 🤖 Automation : 'Messaging Services'
You can also automate and monitor the signals of this strategy much more efficiently by sending them to the following popular messaging services:
1) Discord
2) Telegram
3) Twitter
2️⃣3️⃣ : ❓ How to Automate this Strategy ❓ : 🤖 Automation : '🧲🤖Copy-Trading'
It will also be possible to copy/replicate the entries and exits of this strategy to your broker in an extremely simple and agile way, through the available copy-trader services.
This way it will be possible to replicate the signals of this strategy at each entry and exit to your broker through the API connecting it to the integrated copy-trader services available through the tradingview automation services below:
1) Wundetrading:
2) Zignaly:
2️⃣4️⃣ : ❔ Why be a Titan Pro 👽❔
I believe that today I am at another level in 'pinescript' development.
I consider myself today a true unicorn as a pinescript developer, someone unique and very rare.
If you choose another tool or another pinescript service, this tool will be just another one, with no real results.
But if you join our Titan community, you will have access to a unique tool! And you will get real results!
I already earn money consistently with statistical and automated trading and as an expert pinescript developer.
I am here to evolve my skills as much as possible, and one day become a pinescript 'Wizard'.
So excellence, quality and professionalism will always be my north here.
You will never find a developer like me, and who will take so seriously such a revolutionary project as this one. A Maverick! ▬ The man never stops!
Here you will find the highest degree of sophistication and development in the market for 'pinescript'.
You will get the best of me and the best of pinescript possible.
Let me show you how a professional in my field does it.
Become a Titan Pro Member 👽 and get Full Access to this strategy and all the Automation Tutorials.
Be the Titan in your life!
2️⃣5️⃣ : ❔ Why be a Titan Aff 🛸❔
Get financial return for your referrals, Decentralize the World, and raise the collective consciousness.
2️⃣6️⃣ : 📋 Summary : ⚖️ Strategy: Titan Investments|Quantitative THEMIS|Demo|BINANCE:BTCUSDTP:4h
® Titan Investimentos | Quantitative THEMIS ⚖️ | Demo 🐄 2.6 | Dev: © FilipeSoh 🧙 | 🤖 100% Automated : Discord, Telegram, Twitter, Wundertrading, 3commas, Zignaly, Aleeert, Alertatron, Uniswap-v3 | BINANCE:BTCUSDTPERP 4h
🛒 Subscribe this strategy ❗️ Be a Titan Member 🏛️
🛒 Titan Pro 👽 🔗 🏛️ Titan Pro 👽 Version with ✔️100% Integrated Automation 🤖 and 📚 Automation Tutorials ✔️100% available at: (PDF/VIDEO)
🛒 Titan Affiliate 🛸 🔗 🏛️ Titan Affiliate 🛸 (Subscription Sale) 🔥 Receive 50% commission
📋 Summary : QT THEMIS ⚖️
🕵️♂️ Check This Strategy..................................................................0
🦄 ® Titan Investimentos...............................................................1
👨💻 © Developer..........................................................................2
📚 Signal Automation Tutorials : (PDF/VIDEO).......................................3
👨🔧 Revision...............................................................................4
📊 Table : (BACKTEST)..................................................................5
📊 Table : (INFORMATIONS).............................................................6
⚙️ Properties : (TRADINGVIEW)........................................................7
📆 Backtest : (TRADINGVIEW)..........................................................8
⚠️ Risk Profile...........................................................................9
🟢 On 🔴 Off : (LONG/SHORT).......................................................10
📈 LONG : (ENTRY)....................................................................11
📉 SHORT : (ENTRY)...................................................................12
📈 LONG : (EXIT).......................................................................13
📉 SHORT : (EXIT)......................................................................14
🧩 (EI) External Indicator.............................................................15
📡 (QT) Quantitative...................................................................16
🎠 (FF) Forecast......................................................................17
🅱 (BB) Bollinger Bands................................................................18
🧃 (MAP) Moving Average Primary......................................................19
🧃 (MAP) Labels.........................................................................20
🍔 (MAQ) Moving Average Quaternary.................................................21
🍟 (MACD) Moving Average Convergence Divergence...............................22
📣 (VWAP) Volume Weighted Average Price........................................23
🪀 (HL) HILO..........................................................................24
🅾 (OBV) On Balance Volume.........................................................25
🥊 (SAR) Stop and Reverse...........................................................26
🛡️ (DSR) Dynamic Support and Resistance..........................................27
🔊 (VD) Volume Directional..........................................................28
🧰 (RSI) Relative Momentum Index.................................................29
🎯 (TP) Take Profit %..................................................................30
🛑 (SL) Stop Loss %....................................................................31
🤖 Automation Selected...............................................................32
📱💻 Discord............................................................................33
📱💻 Telegram..........................................................................34
📱💻 Twitter...........................................................................35
🤖 Wundertrading......................................................................36
🤖 3commas............................................................................37
🤖 Zignaly...............................................................................38
🤖 Aleeert...............................................................................39
🤖 Alertatron...........................................................................40
🤖 Uniswap-v3..........................................................................41
🧲🤖 Copy-Trading....................................................................42
♻️ ® No Repaint........................................................................43
🔒 Copyright ©️..........................................................................44
🏛️ Be a Titan Member..................................................................45
Nº Active Users..........................................................................46
⏱ Time Left............................................................................47
| 0 | 🕵️♂️ Check This Strategy
🕵️♂️ Version Demo: 🐄 Version with ❌non-integrated automation 🤖 and 📚 Tutorials for automation ❌not available
🕵️♂️ Version Pro: 👽 Version with ✔️100% Integrated Automation 🤖 and 📚 Automation Tutorials ✔️100% available at: (PDF/VIDEO)
| 1 | 🦄 ® Titan Investimentos
Decentralizing the World 🗺
Raising the Collective Conscience 🗺
🦄Site:
🦄TradingView: www.tradingview.com
🦄Discord:
🦄Telegram:
🦄Youtube:
🦄Twitter:
🦄Instagram:
🦄TikTok:
🦄Linkedin:
🦄E-mail:
| 2 | 👨💻 © Developer
🧠 Developer: @FilipeSoh🧙
📺 TradingView: www.tradingview.com
☑️ Linkedin:
✅ Fiverr:
✅ Upwork:
🎥 YouTube:
🐤 Twitter:
🤳 Instagram:
| 3 | 📚 Signal Automation Tutorials : (PDF/VIDEO)
📚 Discord: 🔗 Link: 🔒Titan Pro👽
📚 Telegram: 🔗 Link: 🔒Titan Pro👽
📚 Twitter: 🔗 Link: 🔒Titan Pro👽
📚 Wundertrading: 🔗 Link: 🔒Titan Pro👽
📚 3comnas: 🔗 Link: 🔒Titan Pro👽
📚 Zignaly: 🔗 Link: 🔒Titan Pro👽
📚 Aleeert: 🔗 Link: 🔒Titan Pro👽
📚 Alertatron: 🔗 Link: 🔒Titan Pro👽
📚 Uniswap-v3: 🔗 Link: 🔒Titan Pro👽
📚 Copy-Trading: 🔗 Link: 🔒Titan Pro👽
| 4 | 👨🔧 Revision
👨🔧 Start Of Operations: 01 Jan 2019 21:00 -0300 💡 Start Of Operations (Skin in the game) : Revision 1.0
👨🔧 Previous Review: 01 Jan 2022 21:00 -0300 💡 Previous Review : Revision 2.0
👨🔧 Current Revision: 01 Jan 2023 21:00 -0300 💡 Current Revision : Revision 2.6
👨🔧 Next Revision: 28 May 2023 21:00 -0300 💡 Next Revision : Revision 2.7
| 5 | 📊 Table : (BACKTEST)
📊 Table: true
🖌️ Style: label.style_label_left
📐 Size: size_small
📏 Line: defval
🎨 Color: #131722
| 6 | 📊 Table : (INFORMATIONS)
📊 Table: false
🖌️ Style: label.style_label_right
📐 Size: size_small
📏 Line: defval
🎨 Color: #131722
| 7 | ⚙️ Properties : (TradingView)
📊 Strategy Type: strategy.position_size != 1
📝💲 % Order Type: % of equity
📝💲 % Order Size: 100 %
🚀 Leverage: 1
| 8 | 📆 Backtest : (TradingView)
🗓️ Mon: true
🗓️ Tue: true
🗓️ Wed: true
🗓️ Thu: true
🗓️ Fri: true
🗓️ Sat: true
🗓️ Sun: true
📆 Range: custom
📆 Start: UTC 31 Oct 2008 00:00
📆 End: UTC 31 Oct 2030 23:45
📆 Session: 0000-0000
📆 UTC: UTC
| 9 | ⚠️ Risk Profile
✔️🆑 Conservative: 🎯 TP=2.7 % 🛑 SL=2.7 %
❌Ⓜ️ Moderate: 🎯 TP=2.8 % 🛑 SL=2.7 %
❌🅰 Aggressive: 🎯 TP=1.6 % 🛑 SL=6.9 %
| 10 | 🟢 On 🔴 Off : (LONG/SHORT)
🟢📈 LONG: true
🟢📉 SHORT: true
| 11 | 📈 LONG : (ENTRY)
📡 (QT) Long: true
🧃 (MAP) Long: false
🅱 (BB) Long: false
🍟 (MACD) Long: false
🅾 (OBV) Long: false
| 12 | 📉 SHORT : (ENTRY)
📡 (QT) Short: true
🧃 (MAP) Short: false
🅱 (BB) Short: false
🍟 (MACD) Short: false
🅾 (OBV) Short: false
| 13 | 📈 LONG : (EXIT)
🧃 (MAP) Short: true
| 14 | 📉 SHORT : (EXIT)
🧃 (MAP) Long: false
| 15 | 🧩 (EI) External Indicator
🧩 (EI) Connect your external indicator/filter: false
🧩 (EI) Connect your indicator here (Study mode only): close
🧩 (EI) Connect your indicator here (Study mode only): close
| 16 | 📡 (QT) Quantitative
📡 (QT) Quantitative: true
📡 (QT) Market: BINANCE:BTCUSDTPERP
📡 (QT) Dice: openai
| 17 | 🎠 (FF) Forecast
🎠 (FF) Include current unclosed current candle: true
🎠 (FF) Forecast Type: flat
🎠 (FF) Nº of candles to use in linear regression: 3
| 18 | 🅱 (BB) Bollinger Bands
🅱 (BB) Bollinger Bands: true
🅱 (BB) Type: EMA
🅱 (BB) Period: 20
🅱 (BB) Source: close
🅱 (BB) Multiplier: 2
🅱 (BB) Linewidth: 0
🅱 (BB) Color: #131722
| 19 | 🧃 (MAP) Moving Average Primary
🧃 (MAP) Moving Average Primary: true
🧃 (MAP) BarColor: false
🧃 (MAP) Background: false
🧃 (MAP) Type: SMA
🧃 (MAP) Source: open
🧃 (MAP) Period: 100
🧃 (MAP) Multiplier: 2.0
🧃 (MAP) Linewidth: 2
🧃 (MAP) Color P: #42bda8
🧃 (MAP) Color N: #801922
| 20 | 🧃 (MAP) Labels
🧃 (MAP) Labels: true
🧃 (MAP) Style BUY ZONE: shape.labelup
🧃 (MAP) Color BUY ZONE: #42bda8
🧃 (MAP) Style SELL ZONE: shape.labeldown
🧃 (MAP) Color SELL ZONE: #801922
| 21 | 🍔 (MAQ) Moving Average Quaternary
🍔 (MAQ) Moving Average Quaternary: true
🍔 (MAQ) BarColor: false
🍔 (MAQ) Background: false
🍔 (MAQ) Type: SMA
🍔 (MAQ) Source: close
🍔 (MAQ) Primary: 14
🍔 (MAQ) Secondary: 22
🍔 (MAQ) Tertiary: 44
🍔 (MAQ) Quaternary: 16
🍔 (MAQ) Linewidth: 0
🍔 (MAQ) Color P: #42bda8
🍔 (MAQ) Color N: #801922
| 22 | 🍟 (MACD) Moving Average Convergence Divergence
🍟 (MACD) Macd Type: EMA
🍟 (MACD) Signal Type: EMA
🍟 (MACD) Source: close
🍟 (MACD) Fast: 12
🍟 (MACD) Slow: 26
🍟 (MACD) Smoothing: 9
| 23 | 📣 (VWAP) Volume Weighted Average Price
📣 (VWAP) Source: close
📣 (VWAP) Period: 340
📣 (VWAP) Momentum A: 84
📣 (VWAP) Momentum B: 150
📣 (VWAP) Average Volume: 1
📣 (VWAP) Multiplier: 1
📣 (VWAP) Diviser: 2
| 24 | 🪀 (HL) HILO
🪀 (HL) Type: SMA
🪀 (HL) Function: Maverick🧙
🪀 (HL) Source H: high
🪀 (HL) Source L: low
🪀 (HL) Period: 20
🪀 (HL) Momentum: 26
🪀 (HL) Diviser: 2
🪀 (HL) Multiplier: 1
| 25 | 🅾 (OBV) On Balance Volume
🅾 (OBV) Type: EMA
🅾 (OBV) Source: close
🅾 (OBV) Period: 16
🅾 (OBV) Diviser: 2
🅾 (OBV) Multiplier: 1
| 26 | 🥊 (SAR) Stop and Reverse
🥊 (SAR) Source: close
🥊 (SAR) High: 1.8
🥊 (SAR) Mid: 1.6
🥊 (SAR) Low: 1.6
🥊 (SAR) Diviser: 2
🥊 (SAR) Multiplier: 1
| 27 | 🛡️ (DSR) Dynamic Support and Resistance
🛡️ (DSR) Source D: close
🛡️ (DSR) Source R: high
🛡️ (DSR) Source S: low
🛡️ (DSR) Momentum R: 0
🛡️ (DSR) Momentum S: 2
🛡️ (DSR) Diviser: 2
🛡️ (DSR) Multiplier: 1
| 28 | 🔊 (VD) Volume Directional
🔊 (VD) Type: SMA
🔊 (VD) Period: 68
🔊 (VD) Momentum: 3.8
🔊 (VD) Diviser: 2
🔊 (VD) Multiplier: 1
| 29 | 🧰 (RSI) Relative Momentum Index
🧰 (RSI) Type UP: EMA
🧰 (RSI) Type DOWN: EMA
🧰 (RSI) Source: close
🧰 (RSI) Period: 29
🧰 (RSI) Smoothing: 22
🧰 (RSI) Momentum R: 64
🧰 (RSI) Momentum S: 142
🧰 (RSI) Diviser: 2
🧰 (RSI) Multiplier: 1
| 30 | 🎯 (TP) Take Profit %
🎯 (TP) Take Profit: false
🎯 (TP) %: 2.2
🎯 (TP) Color: #42bda8
🎯 (TP) Linewidth: 1
| 31 | 🛑 (SL) Stop Loss %
🛑 (SL) Stop Loss: false
🛑 (SL) %: 2.7
🛑 (SL) Color: #801922
🛑 (SL) Linewidth: 1
| 32 | 🤖 Automation : Discord | Telegram | Twitter | Wundertrading | 3commas | Zignaly | Aleeert | Alertatron | Uniswap-v3
🤖 Automation Selected : Discord
| 33 | 🤖 Discord
🔗 Link Discord:
🔗 Link 📚 Automation: 🔒Titan Pro👽
📱💻 Discord ▬ Enter Long: 🔒Titan Pro👽
📱💻 Discord ▬ Exit Long: 🔒Titan Pro👽
📱💻 Discord ▬ Enter Short: 🔒Titan Pro👽
📱💻 Discord ▬ Exit Short: 🔒Titan Pro👽
| 34 | 🤖 Telegram
🔗 Link Telegram:
🔗 Link 📚 Automation: 🔒Titan Pro👽
📱💻 Telegram ▬ Enter Long: 🔒Titan Pro👽
📱💻 Telegram ▬ Exit Long: 🔒Titan Pro👽
📱💻 Telegram ▬ Enter Short: 🔒Titan Pro👽
📱💻 Telegram ▬ Exit Short: 🔒Titan Pro👽
| 35 | 🤖 Twitter
🔗 Link Twitter:
🔗 Link 📚 Automation: 🔒Titan Pro👽
📱💻 Twitter ▬ Enter Long: 🔒Titan Pro👽
📱💻 Twitter ▬ Exit Long: 🔒Titan Pro👽
📱💻 Twitter ▬ Enter Short: 🔒Titan Pro👽
📱💻 Twitter ▬ Exit Short: 🔒Titan Pro👽
| 36 | 🤖 Wundertrading : Binance | Bitmex | Bybit | KuCoin | Deribit | OKX | Coinbase | Huobi | Bitfinex | Bitget
🔗 Link Wundertrading:
🔗 Link 📚 Automation: 🔒Titan Pro👽
📱💻 Wundertrading ▬ Enter Long: 🔒Titan Pro👽
📱💻 Wundertrading ▬ Exit Long: 🔒Titan Pro👽
📱💻 Wundertrading ▬ Enter Short: 🔒Titan Pro👽
📱💻 Wundertrading ▬ Exit Short: 🔒Titan Pro👽
| 37 | 🤖 3commas : Binance | Bybit | OKX | Bitfinex | Coinbase | Deribit | Bitmex | Bittrex | Bitstamp | Gate.io | Kraken | Gemini | Huobi | KuCoin
🔗 Link 3commas:
🔗 Link 📚 Automation: 🔒Titan Pro👽
📱💻 3commas ▬ Enter Long: 🔒Titan Pro👽
📱💻 3commas ▬ Exit Long: 🔒Titan Pro👽
📱💻 3commas ▬ Enter Short: 🔒Titan Pro👽
📱💻 3commas ▬ Exit Short: 🔒Titan Pro👽
| 38 | 🤖 Zignaly : Binance | Ascendex | Bitmex | Kucoin | VCCE
🔗 Link Zignaly:
🔗 Link 📚 Automation: 🔒Titan Pro👽
🤖 Type Automation: Profit Sharing
🤖 Type Provider: Webook
🔑 Key: 🔒Titan Pro👽
🤖 pair: BTCUSDTP
🤖 exchange: binance
🤖 exchangeAccountType: futures
🤖 orderType: market
🚀 leverage: 1x
% positionSizePercentage: 100 %
💸 positionSizeQuote: 10000 $
🆔 signalId: @Signal1234
| 39 | 🤖 Aleeert : Binance
🔗 Link Aleeert:
🔗 Link 📚 Automation: 🔒Titan Pro👽
📱💻 Aleeert ▬ Enter Long: 🔒Titan Pro👽
📱💻 Aleeert ▬ Exit Long: 🔒Titan Pro👽
📱💻 Aleeert ▬ Enter Short: 🔒Titan Pro👽
📱💻 Aleeert ▬ Exit Short: 🔒Titan Pro👽
| 40 | 🤖 Alertatron : Binance | Bybit | Deribit | Bitmex
🔗 Link Alertatron:
🔗 Link 📚 Automation: 🔒Titan Pro👽
📱💻 Alertatron ▬ Enter Long: 🔒Titan Pro👽
📱💻 Alertatron ▬ Exit Long: 🔒Titan Pro👽
📱💻 Alertatron ▬ Enter Short: 🔒Titan Pro👽
📱💻 Alertatron ▬ Exit Short: 🔒Titan Pro👽
| 41 | 🤖 Uniswap-v3
🔗 Link Alertatron:
🔗 Link 📚 Automation: 🔒Titan Pro👽
📱💻 Uniswap-v3 ▬ Enter Long: 🔒Titan Pro👽
📱💻 Uniswap-v3 ▬ Exit Long: 🔒Titan Pro👽
📱💻 Uniswap-v3 ▬ Enter Short: 🔒Titan Pro👽
📱💻 Uniswap-v3 ▬ Exit Short: 🔒Titan Pro👽
| 42 | 🧲🤖 Copy-Trading : Zignaly | Wundertrading
🔗 Link 📚 Copy-Trading: 🔒Titan Pro👽
🧲🤖 Copy-Trading ▬ Zignaly: 🔒Titan Pro👽
🧲🤖 Copy-Trading ▬ Wundertrading: 🔒Titan Pro👽
| 43 | ♻️ ® Don't Repaint!
♻️ This Strategy does not Repaint!: ® Signs Do not repaint❕
♻️ This is a Real Strategy!: Quality : ® Titan Investimentos
📋️️ Get more information about Repainting here:
| 44 | 🔒 Copyright ©️
🔒 Copyright ©️: Copyright © 2023-2024 All rights reserved, ® Titan Investimentos
🔒 Copyright ©️: ® Titan Investimentos
🔒 Copyright ©️: Unique and Exclusive Strategy. All rights reserved
| 45 | 🏛️ Be a Titan Members
🏛️ Titan Pro 👽 Version with ✔️100% Integrated Automation 🤖 and 📚 Automation Tutorials ✔️100% available at: (PDF/VIDEO)
🏛️ Titan Affiliate 🛸 (Subscription Sale) 🔥 Receive 50% commission
| 46 | ⏱ Time Left
Time Left Titan Demo 🐄: ⏱♾ | ⏱ : ♾ Titan Demo 🐄 Version with ❌non-integrated automation 🤖 and 📚 Tutorials for automation ❌not available
Time Left Titan Pro 👽: 🔒Titan Pro👽 | ⏱ : Pro Plans: 30 Days, 90 Days, 12 Months, 24 Months. (👽 Pro 🅼 Monthly, 👽 Pro 🆀 Quarterly, 👽 Pro🅰 Annual, 👽 Pro👾Two Years)
| 47 | Nº Active Users
Nº Active Subscribers Titan Pro 👽: 5️⃣6️⃣ | 1✔️ 5✔️ 10✔️ 100❌ 1K❌ 10K❌ 50K❌ 100K❌ 1M❌ 10M❌ 100M❌ : ⏱ Active Users is updated every 24 hours (Check on indicator)
Nº Active Affiliates Titan Aff 🛸: 6️⃣ | 1✔️ 5✔️ 10❌ 100❌ 1K❌ 10K❌ 50K❌ 100K❌ 1M❌ 10M❌ 100M❌ : ⏱ Active Users is updated every 24 hours (Check on indicator)
2️⃣7️⃣ : 📊 PERFORMANCE : 🆑 Conservative
📊 Exchange: Binance
📊 Pair: BINANCE: BTCUSDTPERP
📊 TimeFrame: 4h
📊 Initial Capital: 10000 $
📊 Order Type: % equity
📊 Size Per Order: 100 %
📊 Commission: 0.03 %
📊 Pyramid: 1
• ⚠️ Risk Profile: 🆑 Conservative: 🎯 TP=2.7 % | 🛑 SL=2.7 %
• 📆All years: 🆑 Conservative: 🚀 Leverage 1️⃣x
📆 Start: September 23, 2019
📆 End: January 11, 2023
📅 Days: 1221
📅 Bars: 7325
Net Profit:
🟢 + 1669.89 %
💲 + 166989.43 USD
Total Close Trades:
⚪️ 369
Percent Profitable:
🟡 64.77 %
Profit Factor:
🟢 2.314
DrawDrown Maximum:
🔴 -24.82 %
💲 -10221.43 USD
Avg Trade:
💲 + 452.55 USD
✔️ Trades Winning: 239
❌ Trades Losing: 130
✔️ Average Gross Win: + 12.31 %
❌ Average Gross Loss: - 9.78 %
✔️ Maximum Consecutive Wins: 9
❌ Maximum Consecutive Losses: 6
% Average Gain Annual: 499.33 %
% Average Gain Monthly: 41.61 %
% Average Gain Weekly: 9.6 %
% Average Gain Day: 1.37 %
💲 Average Gain Annual: 49933 $
💲 Average Gain Monthly: 4161 $
💲 Average Gain Weekly: 960 $
💲 Average Gain Day: 137 $
• 📆 Year: 2020: 🆑 Conservative: 🚀 Leverage 1️⃣x
• 📆 Year: 2021: 🆑 Conservative: 🚀 Leverage 1️⃣x
• 📆 Year: 2022: 🆑 Conservative: 🚀 Leverage 1️⃣x
2️⃣8️⃣ : 📊 PERFORMANCE : Ⓜ️ Moderate
📊 Exchange: Binance
📊 Pair: BINANCE: BTCUSDTPERP
📊 TimeFrame: 4h
📊 Initial Capital: 10000 $
📊 Order Type: % equity
📊 Size Per Order: 100 %
📊 Commission: 0.03 %
📊 Pyramid: 1
• ⚠️ Risk Profile: Ⓜ️ Moderate: 🎯 TP=2.8 % | 🛑 SL=2.7 %
• 📆 All years: Ⓜ️ Moderate: 🚀 Leverage 1️⃣x
📆 Start: September 23, 2019
📆 End: January 11, 2023
📅 Days: 1221
📅 Bars: 7325
Net Profit:
🟢 + 1472.04 %
💲 + 147199.89 USD
Total Close Trades:
⚪️ 362
Percent Profitable:
🟡 63.26 %
Profit Factor:
🟢 2.192
DrawDrown Maximum:
🔴 -22.69 %
💲 -9269.33 USD
Avg Trade:
💲 + 406.63 USD
✔️ Trades Winning: 229
❌ Trades Losing : 133
✔️ Average Gross Win: + 11.82 %
❌ Average Gross Loss: - 9.29 %
✔️ Maximum Consecutive Wins: 9
❌ Maximum Consecutive Losses: 8
% Average Gain Annual: 440.15 %
% Average Gain Monthly: 36.68 %
% Average Gain Weekly: 8.46 %
% Average Gain Day: 1.21 %
💲 Average Gain Annual: 44015 $
💲 Average Gain Monthly: 3668 $
💲 Average Gain Weekly: 846 $
💲 Average Gain Day: 121 $
• 📆 Year: 2020: Ⓜ️ Moderate: 🚀 Leverage 1️⃣x
• 📆 Year: 2021: Ⓜ️ Moderate: 🚀 Leverage 1️⃣x
• 📆 Year: 2022: Ⓜ️ Moderate: 🚀 Leverage 1️⃣x
2️⃣9️⃣ : 📊 PERFORMANCE : 🅰 Aggressive
📊 Exchange: Binance
📊 Pair: BINANCE: BTCUSDTPERP
📊 TimeFrame: 4h
📊 Initial Capital: 10000 $
📊 Order Type: % equity
📊 Size Per Order: 100 %
📊 Commission: 0.03 %
📊 Pyramid: 1
• ⚠️ Risk Profile: 🅰 Aggressive: 🎯 TP=1.6 % | 🛑 SL=6.9 %
• 📆 All years: 🅰 Aggressive: 🚀 Leverage 1️⃣x
📆 Start: September 23, 2019
📆 End: January 11, 2023
📅 Days: 1221
📅 Bars: 7325
Net Profit:
🟢 + 989.38 %
💲 + 98938.38 USD
Total Close Trades:
⚪️ 380
Percent Profitable:
🟢 84.47 %
Profit Factor:
🟢 2.156
DrawDrown Maximum:
🔴 -17.88 %
💲 -9182.84 USD
Avg Trade:
💲 + 260.36 USD
✔️ Trades Winning: 321
❌ Trades Losing: 59
✔️ Average Gross Win: + 5.75 %
❌ Average Gross Loss: - 14.51 %
✔️ Maximum Consecutive Wins: 21
❌ Maximum Consecutive Losses: 6
% Average Gain Annual: 295.84 %
% Average Gain Monthly: 24.65 %
% Average Gain Weekly: 5.69 %
% Average Gain Day: 0.81 %
💲 Average Gain Annual: 29584 $
💲 Average Gain Monthly: 2465 $
💲 Average Gain Weekly: 569 $
💲 Average Gain Day: 81 $
• 📆 Year: 2020: 🅰 Aggressive: 🚀 Leverage 1️⃣x
• 📆 Year: 2021: 🅰 Aggressive: 🚀 Leverage 1️⃣x
• 📆 Year: 2022: 🅰 Aggressive: 🚀 Leverage 1️⃣x
3️⃣0️⃣ : 🛠️ Roadmap
🛠️• 14/ 01 /2023 : Titan THEMIS Launch
🛠️• Updates January/2023 :
• 📚 Tutorials for Automation 🤖 already Available : ✔️
• ✔️ Discord
• ✔️ Wundertrading
• ✔️ Zignaly
• 📚 Tutorials for Automation 🤖 In Preparation : ⭕
• ⭕ Telegram
• ⭕ Twitter
• ⭕ 3comnas
• ⭕ Aleeert
• ⭕ Alertatron
• ⭕ Uniswap-v3
• ⭕ Copy-Trading
🛠️• Updates February/2023 :
• 📰 Launch of advertising material for Titan Affiliates 🛸
• 🛍️🎥🖼️📊 (Sales Page/VSL/Videos/Creative/Infographics)
🛠️• 28/05/2023 : Titan THEMIS update ▬ Version 2.7
🛠️• 28/05/2023 : BOT BOB release ▬ Version 1.0
• (Native Titan THEMIS Automation - Through BOT BOB, a bot for automation of signals, indicators and strategies of TradingView, of own code ▬ in validation.
• BOT BOB
Automation/Connection :
• API - For Centralized Brokers.
• Smart Contracts - Wallet Web - For Decentralized Brokers.
• This way users can automate any indicator or strategy of TradingView and Titan in a decentralized, secure and simplified way.
• Without having the need to use 'third party services' for automating TradingView indicators and strategies like the ones available above.
🛠️• 28/05/2023 : Release ▬ Titan Culture Guide 📝
3️⃣1️⃣ : 🧻 Notes ❕
🧻 • Note ❕ The "Demo 🐄" version, ❌does not have 'integrated automation', to automate the signals of this strategy and enjoy a fully automated system, you need to have access to the Pro version with '100% integrated automation' and all the tutorials for automation available. Become a Titan Pro 👽
🧻 • Note ❕ You will also need to be a "Pro User or higher on Tradingview", to be able to use the webhook feature available only for 'paid' profiles on the platform.
With the webhook feature it is possible to send the signals of this strategy to almost anywhere, in our case to centralized or decentralized brokerages, also to popular messaging services such as: Discord, Telegram or Twiter.
3️⃣2️⃣ : 🚨 Disclaimer ❕❗
🚨 • Disclaimer ❕❕ Past positive result and performance of a system does not guarantee its positive result and performance for the future!
🚨 • Disclaimer ❗❗❗ When using this strategy: Titan Investments is totally Exempt from any claim of liability for losses. The responsibility on the management of your funds is solely yours. This is a very high risk/volatility market! Understand your place in the market.
3️⃣3️⃣ : ♻️ ® No Repaint
This Strategy does not Repaint! This is a real strategy!
3️⃣4️⃣ : 🔒 Copyright ©️
Copyright © 2022-2023 All rights reserved, ® Titan Investimentos
3️⃣5️⃣ : 👏 Acknowledgments
I want to start this message in thanks to TradingView and all the Pinescript community for all the 'magic' created here, a unique ecosystem! rich and healthy, a fertile soil, a 'new world' of possibilities, for a complete deepening and improvement of our best personal skills.
I leave here my immense thanks to the whole community: Tradingview, Pinecoders, Wizards and Moderators.
I was not born Rich .
Thanks to TradingView and pinescript and all its transformation.
I could develop myself and the best of me and the best of my skills.
And consequently build wealth and patrimony.
Gratitude.
One more story for the infinite book !
If you were born poor you were born to be rich !
Raising🔼 the level and raising🔼 the ruler! 📏
My work is my 'debauchery'! Do better! 💐🌹
Soul of a first-timer! Creativity Exudes! 🦄
This is the manifestation of God's magic in me. This is the best of me. 🧙
You will copy me, I know. So you owe me. 💋
My mission here is to raise the consciousness and self-esteem of all Titans and Titanids! Welcome! 🧘 🏛️
The only way to accomplish great work is to do what you love ! Before I learned to program I was wasting my life!
Death is the best creation of life .
Now you are the new , but in the not so distant future you will gradually become the old . Here I stay forever!
Playing the game like an Athlete! 🖼️ Enjoy and Enjoy 🍷 🗿
In honor of: BOB ☆
1 name, 3 letters, 3 possibilities, and if read backwards it's the same thing, a palindrome. ☘
Gratitude to the oracles that have enabled me the 'luck' to get this far: Dal&Ni&Fer
3️⃣6️⃣ : 👮 House Rules : 📺 TradingView
House Rules : This publication and strategy follows all TradingView house guidelines and rules:
📺 TradingView House Rules: www.tradingview.com
📺 Script publication rules: www.tradingview.com
📺 Vendor requirements: www.tradingview.com
📺 Links/References rules: www.tradingview.com
3️⃣7️⃣ : 🏛️ Become a Titan Pro member 👽
🟩 Titan Pro 👽 🟩
3️⃣8️⃣ : 🏛️ Be a member Titan Aff 🛸
🟥 Titan Affiliate 🛸 🟥

Uhl MA System - Strategy AnalysisThe Uhl MA crossover system was specifically designed to provide an adaptive MA crossover system that didn't committed the same errors of more classical MA systems. This crossover system is based on a fast and a slow moving average, with the slow moving average being the corrected moving average (CMA) originally proposed by Andreas Uhl, and the fast moving average being the corrected trend step (CTS) which is also based on the corrected moving average design.
For more information see :
In this post, the performances of this system are analyzed on various markets.
Setup And Rules
The analysis is solely based on the indicator signals, therefore no spread is applied. Constant position sizing is used. The strategy will be backtested on the 15 minute time-frame. The mult setting is discarded, the default setting used for length is 100.
Here are the rules of our strategy :
long: CTS crossover CMA
short: CTS crossunder CMA
Results And Data
EURUSD:
Net Profit: $ 0.08
Total number of trades: 99
Profitability: 35.35 %
Profit Factor: 1.834
Max Drawdown: $ 0.01
EURUSD behaved pretty well, and was most of time showing long term trends without exhibiting particularly tricky structures, the moving averages still did cross during ranging phases, since march 9 we can see a downtrend with more pronounced cyclical variations (retracements) that could potentially lead to loosing trades.
BTCUSD:
Net Profit: $ 4371.57
Total number of trades: 94
Profitability: 32.98 %
Profit Factor: 1.749
Max Drawdown: $ 1409.96
The strategy didn't started well, producing its largest drawdown after only a few trades, the strategy still managed to recover. BTCUSD exhibited a strong downtrend, the strategy profited from that to recover, signals still occurred on ranging phases, and where mostly caused by a short term volatile move, unfortunately the CMA can converge toward ranging/flat price zones where false signals might occur at higher frequency.
AMD:
Net Profit: $ 16.09
Total number of trades: 95
Profitability: 29.47 %
Profit Factor: 1.288
Max Drawdown: $ 20.11
On AMD the strategy started relatively well with a raising balance, then the balance quickly fallen, this downtrend in the balance lasted quite some time (almost 48 trades), the strategy finally recovered in Nov 2019 and the balance made a new highest high at the end of February. AMD had numerous trends during the backtesting period, yet results are poor.
AAPL:
Net Profit: $ -28.17
Total number of trades: 89
Profitability: 28.09 %
Profit Factor: 0.894
Max Drawdown: $ 63.21
AAPL show the poorest results so far, with a stationary balance around the initial capital (in short the evolution of the balance is not showing any particular trend and oscillate around the initial capital value).
AAPL had some significant retracements in its up-trend, which triggered some trades (of course), and the ranging period from Jan 24 to Feb 13 heavily damaged the strategy performance, generating 6 significant loosing trades. AAPL show the worst results so far, mostly due by ranging phases.
Conclusions
The Uhl MA crossover system strategy has been tested and based on the results don't show particularly interesting performances, and might even be outperformed by simpler MA systems that prove to be more robust against ranging markets. The total number of executed trades are on average 94, and the profitability is on average 31%. The strategy might prove more interesting if we can correct the behavior of the CMA, who sometimes converged toward ranging/flat markets.
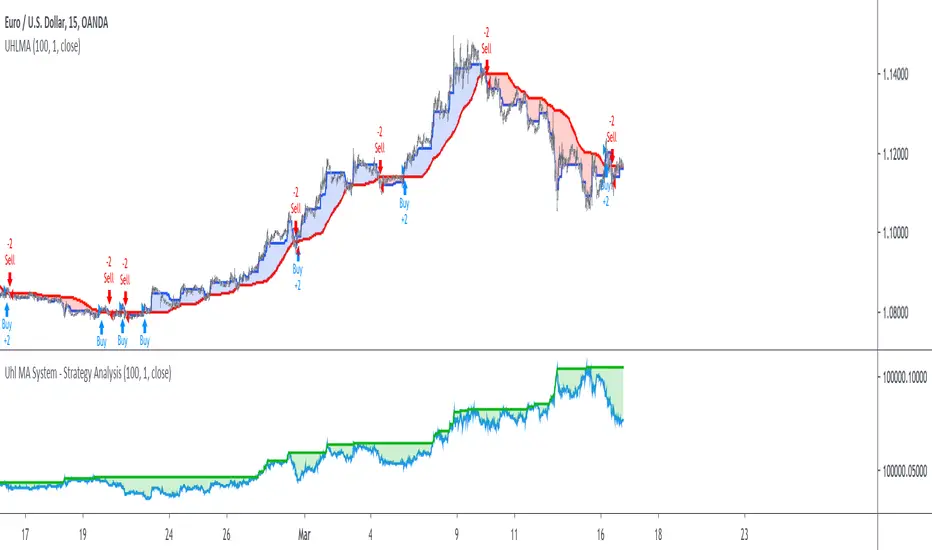
ENAUSDT.P Strategy – Alerts Ready (JSON)Ena/usdt trend trading strategy.
Backtesting results:
Starting date: 2 September 2025
7 days:
PnL: +13.91 (+1.39%)
Max drawdown: -17.68 (-1.73%)
Total trades: 22
Win rate: 63.64%
Profit factor: 1.82
30 days:
PnL: +81.16 (+8.12%)
Max drawdown: -26.38 (-2.51%)
Total trades: 89
Win rate: 68.54%
Profit factor: 2.52
90 days:
PnL: +270.64 (+27.06%)
Max drawdown: -36.29 (-3.34%)
Total trades: 273
Win rate: 67.09%
Profit factor: 2.72
365 day:
PnL: +702.89 (+70.29%)
Max drawdown: -130.40 (-10.16%)
Total trades: 986
Win rate: 65.42%
Profit factor: 1.67
