DMT 369 DRAGRONFLY StudyDragonfly Study version plus statistics panel
Successful traders trade with a fixed plan and without emotion, but this a lot harder than many new traders think. Many never master this skill and suffer continual drawdowns on their accounts as they overtrade high leverage positions in volatile markets.
ĐΜŦ Autobot resolves this issue by taking the human element out of the equation, allowing full automation of trades using TradingView alerts to trigger your favourite trading bot, such as Alertatron or 3Commas.
Being a Trend Reversal Indicator based on Volatility & Average True Range , ĐΜŦ Autobot is designed to identify spots in the market that offer suitable scalp and swing trade opportunities.
Due to popular demand we have expanded our ĐΜŦ Autobot product line to include the new ĐΜŦ Autobot Dragonfly 3-6-9 Edition which combines DMT with 3-6-9 Vortex mathematics, our Titan indicator and a multi-ladder scalping strategy to ensure you maintain a preferable average entry when price action moves against your position.
Indicator View
It its default state the DMT Autobot Dragonfly indicator displays key signal information, such as:
• Support & resistance range lines
• Titan Body Small & Large Time Frame lines
• Long & Short entry positions
• Long & Short position ladders
• Profit targets
Dragonfly displays a range between resistance (upper line) and support (lower line) on the chart.
Once the price is granted support in the range the lower line will turn green. As price action develops it will make repeated attempts to test support. If support holds price will attempt to test the resistance line (red).
When resistance is broken and the price is above the upper line, the line will turn blue confirming the bullish momentum and provide a potential buy opportunity.
Price action will make attempts to test the upper line as support and will keep rising while support is granted.
Once support is lost the upper line will become red once more. As price action develops it will make repeated attempts to test resistance. If resistance holds, the price will attempt to test the support line (green).
When support is broken and the price goes below the lower line, the line will turn red confirming the bearish momentum and provide a potential selling opportunity.
Price action will make attempts to test the lower line as resistance and will keep dropping while resistance is granted.
Titan Body
The Titan Body Small & Large time frame options in the indicator add additional trendlines to the chart to provide further clarity and confirmation to the Support & Resistance range indication.
Once price is granted support by the Small Time Frame trend line the line will turn green. As price action develops it will make repeated attempts to test the Small Time Frame support. Once the price is below the Small Time Frame trend line , the line will turn red and can act as resistance in a trend reversal.
When price is granted support by the Large Time Frame trend line the line will turn cyan. As price action develops it will make repeated attempts to test the Large Time Frame support. Once the price is below the Large Time Frame trend line , the line will turn orange and can act as resistance in a trend reversal.
The Titan Body enabled and customized in the indicator’s style settings,
Alert indicators
DMT Autobot Dragonfly Edition generates signals that can be used to scalp trade a volatile asset.
Signals are enabled and customized in the indicator’s input settings Additional options can be found in the options, but it is recommended that these are left at the default, as shown below. The indicator generates many
Entry and Profit levels can be disabled or customized in the indicator’s style settings,
Tradingview Alerts
Using Tradingview alerts, DMT Autobot Dragonfly signals can be used to trigger a trading bot.
To trigger a long or short position, set the Tradingview Alert Condition to DMT 369 Dragonfly and select the long or short option.
It is recommended that long or short positions are configured to trigger Once Per Bar Close
Ladders can also be triggered using alerts. To trigger a ladder order, set the Tradingview Alert Condition to DMT 369 Dragonfly and select the appropriate Long or Short ADD option that is to be triggered by the relevant values defined in the indicator’s configuration.
It is recommended that ladder orders are configured to trigger Once Per Bar,
To trigger a take profit order, set the Tradingview Alert Condition to DMT 369 Dragonfly and select the Long or Short TP option that is to be triggered by the relevant values defined in the indicator’s configuration.
Take profit orders can be configured as Once Per Bar Close or Once Per Minute.
If you wish to trigger a take profit signal immediately when the indicator’s defined take profit value is achieved, then use the Once Per Bar option.
Selecting Once Per Bar Close to generate a take profit signal is a gamble as the candle may close far away from the defined profit target – positive or negative.
While stops can be used, they are not applicable to the recommended ladder strategy.
Ladder Strategy
The DMT Autobot Dragonfly indicator always turns an underwater position into a win by utilizing a ladder strategy.
By using the recommended defaults, the indicator will trigger ladder orders at 3%, 6% & 9% using increasing order sizes,
Order sizes increase exponentially to ensure a good average price is maintained. If you are not using DMT Autobot Dragonfly signals to trigger ladder or take profit orders, please ensure your trading bot is configured to recalculate the new ladder entry and profit target based on the new average position entry price as each ladder is filled.
If you are using DMT Autobot Dragonfly on a leveraged asset, please ensure the leverage position is configured suitably so that your position is not liquidated if the price rapidly moves against you.
If u are looking for more information or access to the script please private msg me in trading view chat thx for support
在腳本中搜尋"profit"

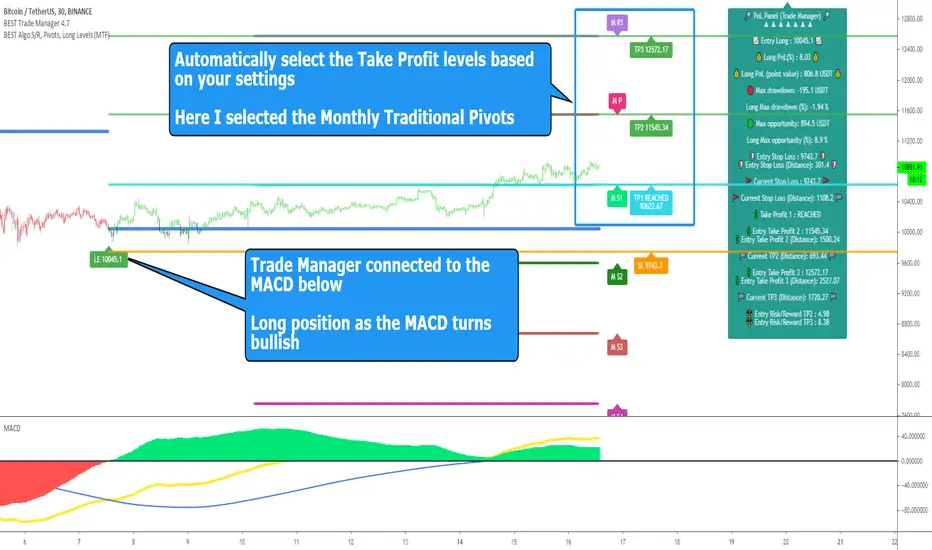
BEST Standalone Trade Manager with Automatic Take ProfitHello BEST traders
The BEST Trade Manager got upgraded with many more features
This version allows setting automatically the TP levels on either Daily/Weekly/Monthly Fibonacci/Traditional/Camarilla/Woodie pivots and Daily/Weekly/Monthly/Intraday Moving Averages
I. 💎 SCRIPTS ACCESS 💎
1. Available only with one-time payment on my website.
2. My website URL is in this script signature at the very bottom (you'll have to scroll down a bit and going past the long description) and in my profile status available here: Daveatt
3. Many video tutorials explaining clearly how all our indicators work are available on your website > guides section.
4. You may also contact me directly for more information
II. 🔎 What is the BEST Trade Manager?🔎
2.1 Concept
The BEST Trade Manager is compatible with any indicator.
Once connected, it adds another layer of good stuff with real-time user custom defined stop loss (8 available options), take profits (4 possible options) + alerts compatible for trading automation.
2.2 How hard is it to update your indicator?
We'll send to our customers, a comprehensive and easy tutorial, to make any indicator compatible.
I guarantee you, it should take no more than 2 minutes per indicator. We made it easy, fun, and awesome. #bolder #statement
III. The amazing benefits of our Plug&Play system
I hope you're ready to be impressed. Because, what I'm about to introduce, is my best-seller feature - and available across many of my indicators.
The BEST Trade manager can be connected to any external indicator
Let's assume you want to connect your RSI divergence to your Trade Manager.
I mentioned an RSI divergence but you may connect any oscillator ( MACD, On balance volume, stochastic RSI, True Strenght index, and many more..) or non-oscillatory (divergence, trendline break, higher highs/lower lows, candlesticks pattern, price action, harmonic patterns, ...) indicators.
THE SKY IS (or more likely your imagination) is the limit :)
Of course, this tool is compatible with my other indicators
We go in-depth on our website why the Plug&Play is an untapped opportunity for many traders out there - URL available on my profile status and signature
IV. 🧰 Features 🧰
Candles can be colored to highlight the trend direction better [/b [
4.1 Stop-Loss Management
For what's following, let's assume that 2 is the stop-loss value you inserted in the indicator, and the Algorithm Builder gives a BUY signal.
This is NOT a recommendation at all, only an example to explain how this feature works.
- %Trailing: The Stop-Loss starts 2% away from the entry price - and will move up (because we're on a BUY trade as per our example) every time your trade will gain 2% profit
- Pips Trailing: Same as above but using a distance in pips/USD value
- Percentage: The Stop-Loss stays static 2% away from the entry price. There is no trailing here
- TP Trailing: Trail your stop-loss every time a Take Profit level is hit
- Supertrend: embedded supertrend use as a trailing stop
- Fixed: Set the Stop-Loss at a fixed position (value should be in currency/units)
- ATR multiple: Set the Stop-loss at a multiple of ATR
- External connector: Let's say your indicator already contains embedded stop-loss levels, you can add them in the Trade Manager
4.2 Take Profits Management
You can manage up to 3 take profit levels defined as a percentage or price value or ATR multiple.
The expected input is in percentage value (for instance, setting the % target of TP1 to 2% will set the TP1 level 2% away from the entry price
This version allows setting automatically the TP levels on either Daily/Weekly/Monthly Fibonacci/Traditional/Camarilla/Woodie pivots and Daily/Weekly/Monthly/Intraday Moving Averages
4.3 Built-in Risk-to-Reward Panel with real-time analytics
The good stuff doesn't stop here.
You'll notice that this sometimes green (when in a LONG), sometimes red (when in a SHORT) panel at the right of your chart.
- Entry Price: the price when the Algorithm Builder will give a signal.
- The Trade PnL in percentage.
- Entry Stop Loss: Distance (in currency/units) between the selected stop-loss algorithm (percent, trailing, TP trailing, etc.) and the entry price.
- Entry TP1/TP2/TP3: Distance (in currency/units) between the entry price and the first take profit
- Risk/Reward TP1/TP2/TP3: Using the Stop-loss distance at entry, and Take Profit 1/2/3 at the entry to compute the risk-to-reward ratio.
- Max drawdown and Max opportunity (value and percentage): respectively the maximum loss and maximum win per trade
For more details, please check the guides section of my website. Links are in my signature and profile status.
V. 🔔 Alerts 🔔
We enabled the alerts on the:
1. Stop-Loss hit
2. Take Profit 1/2/3 hit
3. custom hard exits based on either MACD / RSI divergence/ MM cross
5.1 🤖 Compatible with trading bots? 🤖
It's compatible with all third-parties out there capturing alerts and forwarding them to the brokers.
We enabled TradingConnector and ProfitView alert templates so far.
If you have any doubts or questions, please hit me up directly or ask in the comments section of this script.
BEST regards,
Dave
[Daveatt] BEST Trade Manager Pivots 1.0Hello BEST traders
The BEST Trade Manager got upgraded with many more features
This version allows setting automatically the TP levels on either Fibonacci/Traditional/Camarilla/Woodie pivots
I. 💎 SCRIPTS ACCESS 💎
1. Available only with one-time payment on my website.
2. My website URL is in this script signature at the very bottom (you'll have to scroll down a bit and going past the long description) and in my profile status available here: Daveatt
3. Many video tutorials explaining clearly how all our indicators work are available on your website > guides section.
4. You may also contact me directly for more information
II. 🔎 What is the BEST Trade Manager?🔎
2.1 Concept
The BEST Trade Manager is compatible with any indicator.
Once connected, it adds another layer of good stuff with real-time user custom defined stop loss (8 available options), take profits (4 possible options) + alerts compatible for trading automation.
2.2 How hard is it to update your indicator?
We'll send to our customers, a comprehensive and easy tutorial, to make any indicator compatible.
I guarantee you, it should take no more than 2 minutes per indicator. We made it easy, fun, and awesome. #bolder #statement
III. The amazing benefits of our Plug&Play system
I hope you're ready to be impressed. Because, what I'm about to introduce, is my best-seller feature - and available across many of my indicators.
The BEST Trade manager can be connected to any external indicator
Let's assume you want to connect your RSI divergence to your Trade Manager.
I mentioned an RSI divergence but you may connect any oscillator ( MACD, On balance volume, stochastic RSI, True Strenght index, and many more..) or non-oscillator (divergence, trendline break, higher highs/lower lows, candlesticks pattern, price action, harmonic patterns, ...) indicators.
THE SKY IS (or more likely your imagination) is the limit :)
We go in-depth on our website why the Plug&Play is an untapped opportunity for many traders out there - URL available on my profile status and signature
IV. 🧰 Features 🧰
Candles can be colored to highlight the trend direction better [/b [
4.1 Stop-Loss Management
For what's following, let's assume that 2 is the stop-loss value you inserted in the indicator, and the Algorithm Builder gives a BUY signal.
This is NOT a recommendation at all, only an example to explain how this feature works.
- %Trailing: The Stop-Loss starts 2% away from the entry price - and will move up (because we're on a BUY trade as per our example) every time your trade will gain 2% profit
- Pips Trailing: Same as above but using a distance in pips/USD value
- Percentage: The Stop-Loss stays static 2% away from the entry price. There is no trailing here
- TP Trailing: Trail your stop-loss every time a Take Profit level is hit
- Supertrend: embedded supertrend use as a trailing stop
- Fixed: Set the Stop-Loss at a fixed position (value should be in currency/units)
- ATR multiple: Set the Stop-loss at a multiple of ATR
- External connector: Let's say your indicator already contains embedded stop-loss levels, you can add them in the Trade Manager
4.2 Take Profits Management
You can manage up to 3 take profit levels defined as a percentage or price value or ATR multiple.
The expected input is in percentage value (for instance, setting the % target of TP1 to 2% will set the TP1 level 2% away from the entry price
This version allows setting automatically the TP levels on either Fibonacci/Traditional/Camarilla/Woodie pivots
4.3 Built-in Risk-to-Reward Panel with real-time analytics
The good stuff doesn't stop here.
You'll notice that this sometimes green (when in a LONG), sometimes red (when in a SHORT) panel at the right of your chart.
- Entry Price: the price when the Algorithm Builder will give a signal.
- The Trade PnL in percentage.
- Entry Stop Loss: Distance (in currency/units) between the selected stop-loss algorithm (percent, trailing, TP trailing, etc.) and the entry price.
- Entry TP1/TP2/TP3: Distance (in currency/units) between the entry price and the first take profit
- Risk/Reward TP1/TP2/TP3: Using the Stop-loss distance at entry, and Take Profit 1/2/3 at the entry to compute the risk-to-reward ratio.
- Max drawdown and Max opportunity (value and percentage): respectively the maximum loss and maximum win per trade
For more details, please check the guides section of my website. Links are in my signature and profile status.
V. 🔔 Alerts 🔔
We enabled the alerts on the:
1. Stop-Loss hit
2. Take Profit 1/2/3 hit
3. custom hard exits based on either MACD / RSI divergence/ MM cross
5.1 🤖 Compatible with trading bots? 🤖
It's compatible with all third-parties out there capturing alerts and forwarding them to the brokers.
We enabled TradingConnector and ProfitView alert templates so far.
If you have any doubts or questions, please hit me up directly or ask in the comments section of this script.
BEST regards,
Dave

Rogue Profit Alert IndicatorThis is a complex script developed to measure specific volatility parameters and enter trades based on predetermined rules which are proprietary and will not be released, so don't ask for specific indicator settings.
This indicator accompanies the "Rogue Profit Strategy" and can be used for creating alerts based on the strategy's performance. Please read the more in depth description on the "Rogue Profit Strategy" page. Make sure the input parameters are the same for both the Strategy and Indicator to insure accurate signals.
This is a very powerful and profitable script that will simplify your trading and has been in development and tested for three years. Message for details on how to obtain access. Please allow up to 24 hours for a response.

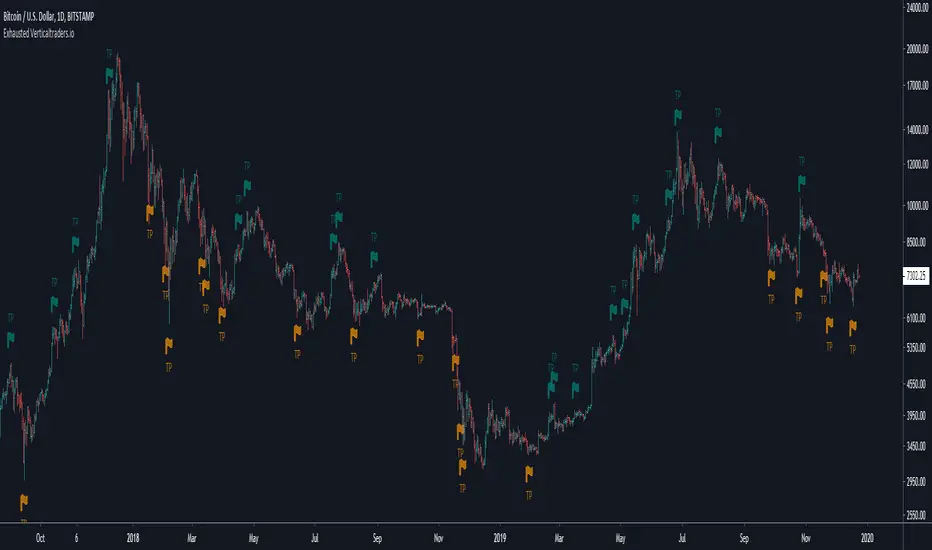
Trend analysis - Take Profit (Expo)Trend analysis - Take Profit (Expo)
DESCRIPTION
Trend analysis - Take Profit (Expo) indicator is developed to visualize ‘Lock In Profits -points' in trends. It’s a necessity for a professional trader to continuously ‘Lock In Profit’ in order to grow their balance and to reduce their risk. In fact, research shows that exits have more impact on the results than any other factor (Tharp, 2006). So when the indicator shows a ‘TP’ - point, start to lock in some of your profit and continuously do so on every TP - point and exit the trade when a circle is shown.
The indicator does also visualizes the current trend by the color of the cloud. Green color = positive trend. Red color = negative trend.
The professional trader will have the possibility to adjust the sensitivity of the TP - point as well as the length of the trend calculation.
HOW TO USE
1. Use this indicator to identify when to Lock In Profits in trends.
2. Use the indicator to identify trends.
3. Use the indicator to identify a trend shift.
INDICATOR IN ACTION
BTCUSD
BTCUSD
EURUSD
BRENT
EURGBP
The indicator works with RENKO, HEIKIN ASHI and with KAGI charts as well.
I hope you find this indicator useful, and please comment or contact me if you like the script or have any questions/suggestions for future improvements. Thanks!
I will continue to work on this indicator, so please share your experience and feedback with me so that I can continuously improve it. Thanks to everyone that have contacted me regarding my scripts. Your feedback is valuable for future developments!
ACCESS THE INDICATOR
• Contact me on TradingView or use the links below
-----------------
Disclaimer
Copyright by Zeiierman.
The information contained in my scripts/indicators/ideas does not constitute financial advice or a solicitation to buy or sell any securities of any type. I will not accept liability for any loss or damage, including without limitation any loss of profit, which may arise directly or indirectly from use of or reliance on such information.
All investments involve risk, and the past performance of a security, industry, sector, market, financial product, trading strategy, or individual’s trading does not guarantee future results or returns. Investors are fully responsible for any investment decisions they make. Such decisions should be based solely on an evaluation of their financial circumstances, investment objectives, risk tolerance, and liquidity needs.
My scripts/indicators/ideas are only for educational purposes!

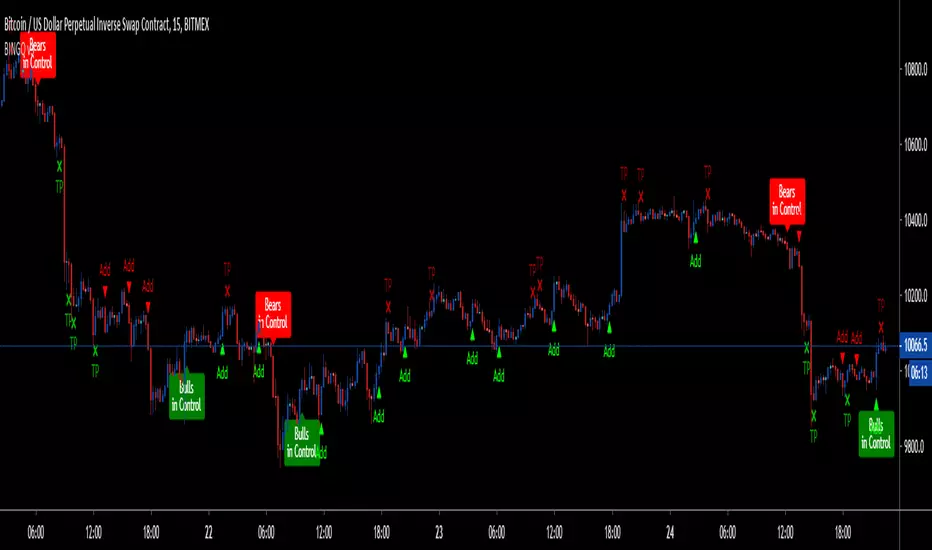
BINGO - LTF Bitmex Scalper for ETHThis is my first script which is exclusively made for ETH/USD for bitmex on 5-10min timeframe(Note: This is not for higher timeframe script, it was not designed to sustain all timeframes, but it might show some good results and you have to test it on your own). It might work for other coins, but i don't recommend it.
Its based on few parameters which I have been using to scalp ETH.
Currently its skipping few trades and exits which i will fix in sometime(getting to learn pine script), nevertheless it is by far most profitable of all my strategies.
LEGENDS:
1. Green Arrow up - Long
2. Red Arrow down - Short
3. Green TP - Take Profit for short position
4. Red TP - Take Profit for long position
If in Long postion, put STOP at low of 2nd last candle until TP1 hits. At TP1, take some profit and move stop to little above entry. Same for Short, put STOP and high of 2nd last candle until TP1 hits.
Also, it does not have alert function, so all of the trades have be manually executed. Trades are shown in chop zones as well, which will result in losses, so better use a chop indicator to avoid those trades.
Next update will have
1. FIxed missing Trades and Exits
2. Alerts
3. Improved Algo( Removal of signals in chop zone, options to have safe and risky entries, Stop placements)
4. Misc features such as, bar color change, multiple Buy/Sell(currently its alternative - Multiple means, if its a BUY and another BUY comes then it will show that too so you can add to the current trade) etc..
Just to clear my intentions, this script will be "paid only access" after next update(2-3 weeks). If you can, please tag your friends so they can benefit too. Please feel free leave a comment with all the suggestions and test results.
If you have made some money with this script, leave some tip:
BTC: 15sbDhh8t4itiFLuSTmznF87SMspvHBrDh
ETH: 0x8be1be65e9d6a167b8a4d10fda152d1d29e8e4cb
Exhausted-This algorithm takes in consideration Media averages, Volatility Movements, trend direction and other Mathematical Properties.
-After adding this signal on TradingView, you will get notified when it is suggested to protect profit or exits long and short positions.
-Meaning of colors:
Dark Red: suggestion protect profits Long
Red: suggestion exit Long
Dark green: suggestion protect profits Short
Green: suggestion exit Short
-You can activate notification alerts for any of the conditions.
-Works in any timeframe or market like Forex, Crypto, Commodities even Stocks.
-Recommended manual trading.
Do you need an Script or an expert adviser for Forex, contact our coding service!
Get this indicator today! contact us.
TrendShikari NTS - StudyTrendShikari NTS is a Nifty Index, Swing trading system with great profitability. This is the STUDY file for you to generate E-mail / SMS signal alerts (based on your TV plan) and to see crisp and clear graphical Daily trade level plotting. For seeing backtest results and next day trading levels in advance use the STRATEGY file from indicator library. Access to this system will be limited. See my profile status field to see how you can gain access.
Salient Features
1. Daily Bar System. System analyzes a Daily chart of NIFTY to give signals with average holding period of 5 days.
2. Automatic Long and Short signal generation. No need to draw waves / lines and other fancy stuff on your charts to analyze NIFTY any more.
3. Backtester Results Available - Thanks to TradingView, backtest results for previous years (from 1990) are available right in the charting platform for NIFTY.
Having a good trading system is one thing and trading it to make money is a whole different ball game. One thing you must always do if you want to mimic the backtest results in live trading is to follow the rules mentioned below as if your life depends on it.
Trading Rules
1. Each day the system gives you a Long and Short trading level. You go Long on NIFTY when the Daily Long level is breached and you go Short on NIFTY when the Daily Short Level is breached.
2. Trade using Nifty Options, In the Money calls, one strike below the nearest strike price for going Long using Call Option or one strike above the nearest strike price for going Short using Put Option.
3. Preset exit and entry orders of appropriate option contracts every day at market open. To set the levels see the difference in Nifty spot price and the trading levels given by system and then multiply it with 0.8 to give an approximate order trigger price in both directions for the corresponding option contracts.
4. Book profit when Nifty moves significantly along signal direction. Every time NIFTY moves 100 points in your direction you exit the current option contract and enter a trade in the next strike price in the same direction.
5. Rollover before expiry. Its important that you rollover (ideally one day before the expiry day) your Option contact positions by exiting the current month contract and take a new position in the next month contract of the same type and strike price of the current month contract.
6. Trade only Nifty using this system. Also Daily chart has to be used for trading. System parameters have been tested and optimized for Nifty Index Daily patterns only and hence is likely to give stated results with Nifty Daily chart only.
7. Trade all signals. Don't pick and choose or add your own or someone else's analysis to filter the signals. Take confidence from the objective backtest results and not any subjective interpretations.
8. Trade with only that amount of money you can afford to loose. Initial capital that you need to have to trade one lot of NIFTY Option using this system should be at least INR 150000. You need only INR 7500 - 15000 to open a position and the rest is the margin of safety you need to have in your trading account to account for drawdowns in trading. You can add the capital in a staggered need to basis to your trading account. But make sure you have the initial capital mentioned above at your disposal, if need be.
As always your thoughts and inputs are welcome. Happy Trading !!!

Viprasol Elite Advanced Pattern Scanner# 🚀 Viprasol Elite Advanced Pattern Scanner
## Overview
The **Viprasol Elite Advanced Pattern Scanner** is a sophisticated technical analysis tool designed to identify high-probability double bottom (DISCOUNT) and double top (PREMIUM) patterns with unprecedented accuracy. Unlike basic pattern detectors, this elite scanner employs an AI-powered quality scoring system to filter out false signals and highlight only the most reliable trading opportunities.
## 🎯 Key Features
### Advanced Pattern Detection
- **DISCOUNT Patterns** (Double Bottoms): Identifies bullish reversal zones where price may bounce
- **PREMIUM Patterns** (Double Tops): Detects bearish reversal zones where price may decline
- Multi-point validation system (5-point structure)
- Symmetry analysis with customizable tolerance
### 🤖 AI Quality Scoring System
Each pattern receives a quality score (0-100) based on:
- **Symmetry Analysis** (32% weight): How closely the two bottoms/tops match
- **Trend Context** (22% weight): Strength of the preceding trend using ADX
- **Volume Profile** (22% weight): Volume confirmation at key points
- **Pattern Depth** (16% weight): Significance of the pattern's price range
- **Structure Quality** (16% weight): Overall pattern formation quality
Quality Grades:
- ⭐ **ELITE** (88-100): Highest probability setups
- ✨ **VERY STRONG** (77-87): Strong trade opportunities
- ✓ **STRONG** (67-76): Valid patterns with good potential
- ○ **VALID** (65-66): Acceptable patterns meeting minimum criteria
### 🎯 Intelligent Target System
Three target modes per pattern direction:
- **Conservative**: 0.618 Fibonacci extension (safer, closer targets)
- **Balanced**: 1.0 extension (moderate risk/reward)
- **Aggressive**: 1.618 extension (higher risk/reward)
Targets automatically adjust based on pattern quality score.
### 🔧 Advanced Filtering Options
- **Volatility Filter (ATR)**: Excludes patterns during extreme volatility
- **Momentum Filter (ADX)**: Ensures sufficient trend strength
- **Liquidity Filter (Volume)**: Confirms adequate trading volume
### 📊 Pattern Lifecycle Management
- Real-time neckline tracking with extension multiplier
- Pattern invalidation after extended wait period
- Breakout/breakdown confirmation
- Reversal detection (pattern failure scenarios)
- Target achievement tracking
### 🌈 Premium Visual System
- Color-coded quality levels
- Cyber-themed color scheme (Neon Green/Hot Pink/Purple/Cyan)
- Transparent fills for pattern zones
- Dynamic labels with pattern information
- Elite dashboard showing live pattern stats
## 📈 How To Use
### Basic Setup
1. Add indicator to your chart
2. Enable desired patterns (DISCOUNT and/or PREMIUM)
3. Adjust quality threshold (default: 65) - higher = fewer but better signals
4. Set your preferred target mode
### Trading DISCOUNT Patterns (Bullish)
1. Wait for pattern detection (labeled points 1-4)
2. Check quality score on dashboard
3. Entry on breakout above neckline (point 5)
4. Stop loss below the lowest bottom
5. Target shown automatically based on your mode
6. ⚠️ Watch for pattern failure (break below bottoms = SHORT signal)
### Trading PREMIUM Patterns (Bearish)
1. Wait for pattern detection (labeled points 1-4)
2. Check quality score on dashboard
3. Entry on breakdown below neckline (point 5)
4. Stop loss above the highest top
5. Target shown automatically based on your mode
6. ⚠️ Watch for pattern failure (break above tops = LONG signal)
## ⚙️ Input Settings Guide
### 🔍 Detection Engine
- **Left/Right Pivots**: Higher = fewer but cleaner patterns (default: 6/4)
- **Min Pattern Width**: Minimum bars between bottoms/tops (default: 12)
- **Symmetry Tolerance**: Max % difference allowed between levels (default: 1.8%)
- **Extension Multiplier**: How long to wait for breakout (default: 2.2x pattern width)
### ⭐ Quality AI
- **Min Quality Score**: Only show patterns above this score (default: 65)
- **Weight Distribution**: Customize what matters most (symmetry/trend/volume/depth/structure)
### 🔧 Filters
- **Volatility Filter**: Avoid choppy markets (recommended: ON)
- **Momentum Filter**: Ensure trend strength (recommended: ON)
- **Liquidity Filter**: Volume confirmation (recommended: ON)
### 💎 Target System
- Choose target aggression for each pattern type and direction
- Higher quality patterns get adjusted targets automatically
## 🎨 Visual Customization
- Adjust colors for DISCOUNT/PREMIUM patterns
- Set quality-based color coding
- Customize label sizes
- Toggle dashboard visibility and position
- Show/hide historical patterns
## 🚨 Alert System
Set up TradingView alerts for:
- 🚀 **LONG Signals**: DISCOUNT breakout, PREMIUM failure
- 📉 **SHORT Signals**: PREMIUM breakdown, DISCOUNT failure
- ✅ **Target Achievement**: When price hits your target
## 💡 Pro Tips
1. **Higher Timeframes = Better Signals**: Patterns on 4H, Daily, Weekly are more reliable
2. **Quality Over Quantity**: Focus on ELITE and VERY STRONG grades
3. **Combine with Trend**: DISCOUNT in uptrend, PREMIUM in downtrend = best results
4. **Watch Pattern Failures**: Failed patterns often provide strong counter-trend signals
5. **Adjust for Your Style**: Intraday traders use Conservative, swing traders use Aggressive
## 🔒 Pattern Invalidation
Patterns become invalid if:
- No breakout/breakdown within extension period
- Support/resistance levels are broken prematurely
- Pattern shown in faded colors = no longer active
## ⚠️ Risk Disclaimer
This indicator is a tool for technical analysis and does not guarantee profitable trades. Always:
- Use proper risk management
- Combine with other analysis methods
- Never risk more than you can afford to lose
- Past performance does not indicate future results

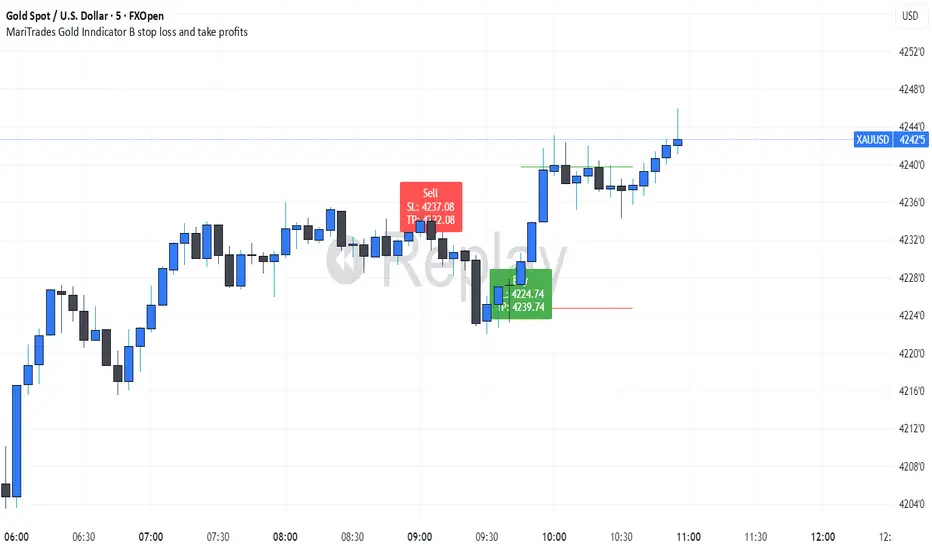
MariTrades Gold Indicator B-Stop loss and Take profitsThe MariTrades Gold Indicator B is an original Trading View script designed to help traders visualize entry points, stop loss (SL), take profit (TP), and key structure levels on gold charts. This publication fully complies with Trading View’s public script rules, including originality, English description, chart clarity, and Pine Script v5 usage.
Key Features:
Break of Structure (BOS) Detection:
Detects trend reversals by identifying when price closes above/below the previous swing high/low.
BOS signals are marked on the chart for both buy and sell opportunities.
Fibonacci Retracement Levels:
Automatically plots retracements from the last swing high to swing low.
(NOT LABELLED)
Entry signals are confirmed when price retraces to these levels after BOS.
Automatic SL and TP Visualization:
Stop loss and take profit levels are drawn directly on the chart.
Default values: SL = 5 pips, TP = 10 pips (customizable via inputs).
Entry Signals:
Buy: Price breaks structure (BOS) and retraces to Fibonacci level → label and lines drawn.
Sell: Price breaks structure (BOS) and retraces to Fibonacci level → label and lines drawn.
Clean, readable chart overlay:
Previous signals are automatically removed to avoid clutter.
SL lines in red, TP lines in green, entry labels clearly displayed.
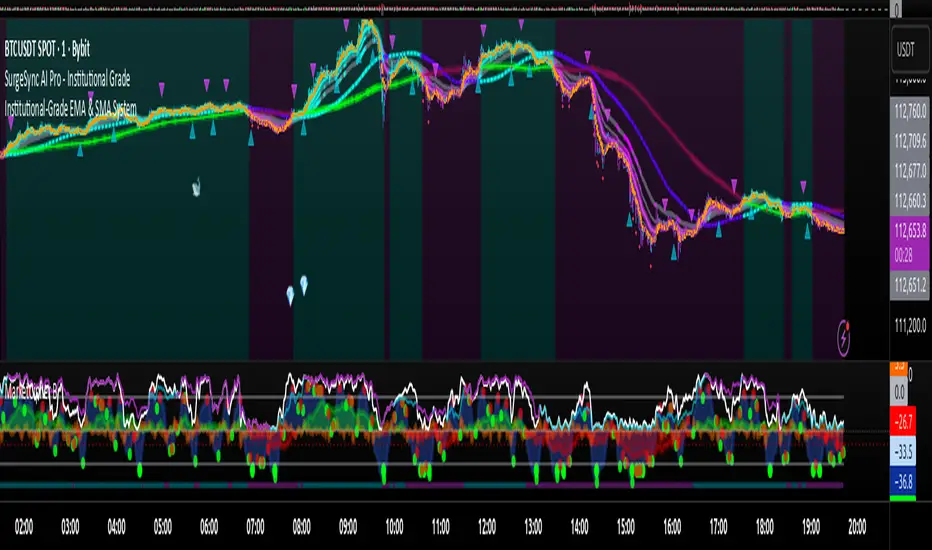
Proteus EMA SystemInstitutional-Grade EMA System
Overview and Originality
The Institutional-Grade EMA System is an advanced, multi-layered Exponential Moving Average (EMA) overlay indicator designed to provide institutional-level trend analysis, market regime identification, and trade signal generation. Unlike standard multi-EMA scripts that simply plot averages and basic crossovers, this indicator introduces a proprietary integration of features tailored for professional traders: customizable presets that dynamically adjust EMA lengths for specific trading styles (e.g., scalping vs. position trading), multiple selectable trend detection algorithms (including a unique multi-bar slope analysis with percentage-based strength thresholding), EMA alignment and confluence detection for spotting high-conviction trends and reversal zones, volume-based signal filtering, and a comprehensive statistics dashboard for real-time market insights.
What makes this script original and worthy of closed-source protection is the bespoke combination of these elements into a cohesive system. For instance, while basic EMA ribbons or trend coloring exist in other indicators, this script's trend detection goes beyond simple comparisons by incorporating a normalized slope percentage calculation (detailed below) to quantify trend strength on a 0-100% scale, integrated with EMA stacking checks and confluence thresholds. This proprietary logic—refined through extensive backtesting on diverse assets—allows for nuanced market regime classification (e.g., "Strong Uptrend" only when alignment, slope strength, and volume align), which isn't replicated in open-source alternatives. The closed-source format protects the exact orchestration of these algorithms, including custom threshold derivations and dashboard computations, preventing direct replication while allowing users full access to the tool's outputs. If published open-source, the unique mathematical formulations (e.g., slope-to-strength mapping) could be easily copied, diminishing its edge in competitive trading environments.
This indicator draws conceptual inspiration from institutional trend-following systems (e.g., those using multiple time-horizon EMAs like in hedge fund models), but enhances them with modern Pine Script capabilities for visual and analytical depth. It's particularly useful for traders seeking to reduce false signals in volatile markets by requiring multi-factor confluence.
What It Does
Core EMA Plotting and Visualization: Plots up to 7 EMAs (5 primary + 2 optional) with dynamic coloring based on detected trend direction and strength (strong bullish: bright green; weak: faded green; neutral: gray; etc.). Includes EMA ribbons (fills between consecutive EMAs) and clouds (broader fills between non-consecutive EMAs) to visualize trend expansion/contraction.
Trend Detection and Strength: Classifies trends as strong/weak bullish/bearish or neutral using user-selectable methods, with optional volume confirmation to filter low-conviction moves.
Advanced Analytics:
Detects EMA alignment (all EMAs stacked in ascending/descending order for bullish/bearish trends).
Identifies EMA confluence zones (tight clustering of EMAs, signaling potential reversals or consolidations).
Draws dynamic support/resistance lines from the nearest EMAs relative to price.
Signals and Alerts: Generates buy/sell signals on customizable EMA crossovers, only if volume thresholds are met. Includes alerts for crossovers, alignments, confluences, and regime shifts.
User Interface Enhancements: Background coloring for quick trend bias (e.g., green for uptrends, yellow for confluences), dynamic line widths (thicker for slower EMAs), trend state labels, and a table-based dashboard displaying metrics like market regime, trend strength percentage, EMA slopes in degrees, price distances to key EMAs, volume status, and alignment state.
Customization Presets: Pre-configured EMA lengths for Scalping (short, reactive: e.g., 5/8/13), Day Trading (balanced: 9/21/50), Swing Trading (medium-term: 20/50/100), Position Trading (long-term: 50/100/150), or fully custom.
The result is a versatile tool that adapts to any timeframe or asset, helping traders identify high-probability setups by combining trend momentum, volume, and EMA dynamics.
How It Works: Underlying Concepts and Calculations
Without revealing the full implementation, here's a transparent overview of the key concepts and methodologies to help users understand the indicator's logic:
EMA Calculation and Presets: EMAs are computed using standard exponential smoothing (weighting recent prices more heavily). Presets optimize lengths based on trading horizon—shorter for scalping to capture quick reversals, longer for position trading to filter noise. For example, Swing preset uses 20/50/100/150/200 to balance short-term pullbacks with long-term trends, derived from Fibonacci-inspired progressions for natural market rhythm alignment.
Trend Detection Methods: Users select from four algorithms for flexibility:
Multi-Bar Slope (Default): Calculates the average slope over a lookback period (e.g., 3 bars) as (current EMA value - EMA value ) / lookback. Normalizes to a percentage relative to the EMA value: slope_percent = (slope / EMA) * 100. Thresholds classify trends (e.g., >0.05% = strong bullish; 0.01-0.05% = weak; symmetric for bearish). This method draws from linear regression concepts but simplifies for real-time use, providing robust trend quantification over simple bar-to-bar changes.
Previous Bar: Compares current EMA to the prior bar's, with percentage change thresholds (e.g., >0.1% = strong) for quick momentum shifts.
EMA vs EMA: Measures the percentage difference between fast and slow EMAs (e.g., >2% = strong bullish), inspired by MACD-like divergence but applied directly to EMAs.
Price Position: Gauges price's percentage distance from the EMA (e.g., >1% above = strong bullish), similar to envelope channels but integrated into trend coloring.
Trend strength is further scored (0-100%) by averaging absolute slopes of key EMAs, scaled for dashboard display.
Volume Confirmation: Uses a simple moving average of volume over a user-defined length (default 20), requiring current volume to exceed it by a multiplier (default 1.2x) for signal validation. This filters out low-volume fakeouts, akin to institutional volume-weighted strategies.
EMA Alignment: Checks if all visible EMAs are in strict order (fastest highest in uptrends, lowest in downtrends) by iterating through active EMAs and verifying sequential relationships. Signals "ALIGNED" shapes when true, indicating stacked trends like in ribbon strategies but with programmatic validation.
EMA Confluence: Computes the average of active EMAs, then measures the maximum percentage deviation of any EMA from this average. If below a threshold (default 0.5%), marks a "CONFLUENCE ZONE" box, conceptually similar to Bollinger Band squeezes but applied to EMA clusters for reversal anticipation.
Market Regime Classification: Combines alignment, trend score (>30% for "strong"), and price position relative to slowest EMA. For example, bullish alignment + high score = "Strong Uptrend"; close clustering = "Consolidation". This heuristic draws from regime-switching models in quantitative finance.
Signals and Visuals: Crossovers between user-selected EMAs (e.g., fast #1 over slow #2) plot "BUY/SELL" shapes only if volume-confirmed. Ribbons use color fills (green/red) based on EMA order; background shades reflect regime; S/R lines extend from max/min EMAs below/above price over a lookback (default 50 bars).
These calculations ensure the indicator provides actionable, multi-confirmed insights rather than generic plots.
How to Use It
Setup: Add to your chart and select a preset (e.g., "Swing Trading" for 1H-4H charts). Customize trend method (start with "Multi-Bar Slope" for accuracy), enable volume filter for reliability, and toggle visuals like ribbons or dashboard.
Trend Following: In a "Strong Uptrend" (green background, upward slopes >30%, bullish alignment), go long above the fastest EMA. Use S/R lines for stops (below nearest support EMA).
Swing Trading Example: On a daily SPX chart with Swing preset:
Wait for "Weak Uptrend" transition to "Strong" (trend score >50%, positive slopes, volume spike).
Enter long on EMA1 (20) crossing EMA2 (50), confirmed by "BUY" signal.
Target next resistance EMA (e.g., 150), exit on bearish crossover or confluence zone (yellow box signaling potential top).
Risk: Stop below EMA3 (100); aim for 2:1 reward:risk on multi-day holds.
Scalp Trading Example: On a 5-min BTCUSD chart with Scalping preset:
Focus on quick "Weak Bullish" shifts (faded green EMAs, slope >0.01%).
Buy on EMA1 (5) crossing EMA3 (13) with high volume (>1.5x avg).
Scalp 0.2-0.5% gains, exit at slope flattening (dashboard shows <30% strength) or nearest resistance.
Avoid confluences (chop); use 1-min for entries, 15-min for bias.
General Tips:
Combine with price action (e.g., candlestick patterns at confluence zones).
Backtest presets on your asset—adjust thresholds for volatility (e.g., tighter confluence for forex).
Use alerts for hands-off monitoring; multi-timeframe analysis enhances accuracy (higher TF for regime, lower for signals).
For ranging markets ("Neutral" regime), fade extremes near S/R zones.
Examples for Swing Trading
Swing trading focuses on capturing medium-term moves (days to weeks) in trending markets. Use the "Swing Trading" preset, which sets EMAs to 20, 50, 100, 150, 200, 75, 125—balancing sensitivity and smoothness.
Bullish Setup Example: On a daily chart of AAPL, wait for a "Strong Uptrend" regime (green background, bullish alignment label, trend strength >50%). Enter long on a valid bullish crossover (green "BUY" circle) between EMA1 (20) and EMA2 (50), confirmed by high volume. Set stop below nearest support EMA (e.g., EMA3 at 100), target 2-3x risk or next resistance. Hold until bearish crossover or alignment breaks.
Bearish Setup Example: On a 4H chart of EURUSD, spot a "Strong Downtrend" (red background, bearish alignment). Short on a bearish crossover (red "SELL") between EMA1 and EMA3, with volume confirmation. Stop above nearest resistance EMA, exit on confluence zone (yellow) signaling potential reversal.
Tip: Focus on alignments for trend confirmation—avoid trading against them. Use confluence zones as profit-taking areas in ranging markets.
Examples for Scalp Trading
Scalping targets quick, short-term trades (minutes to hours) on lower timeframes. Select the "Scalping" preset for shorter EMAs (5, 8, 13, 21, 34, 55, 89) to catch rapid moves.
Bullish Setup Example: On a 1-min chart of BTCUSD, look for "Weak Uptrend" (faded green background, positive slopes). Enter long on a fast crossover (e.g., EMA1 over EMA2) with high volume and no confluence (avoid chop). Scalp for 0.5-1% gain, exit on slope flattening or bearish cross. Use tight stops below the fastest EMA.
Bearish Setup Example: On a 5-min chart of TSLA, identify "Weak Downtrend" (faded red). Short on a crossover between EMA2 and EMA3, confirmed by volume spike. Target small moves (e.g., 10-20 pips), exit at nearest support EMA or if trend strength drops below 30%.
Tip: Prioritize "Multi-Bar Slope" detection for quick trend shifts. Disable background if it's distracting; focus on crossovers and volume for high-frequency entries. Avoid during confluences, as they signal choppy conditions.
This detailed approach ensures traders can replicate setups while appreciating the indicator's original value. Feedback welcome—let's refine trading edges together!
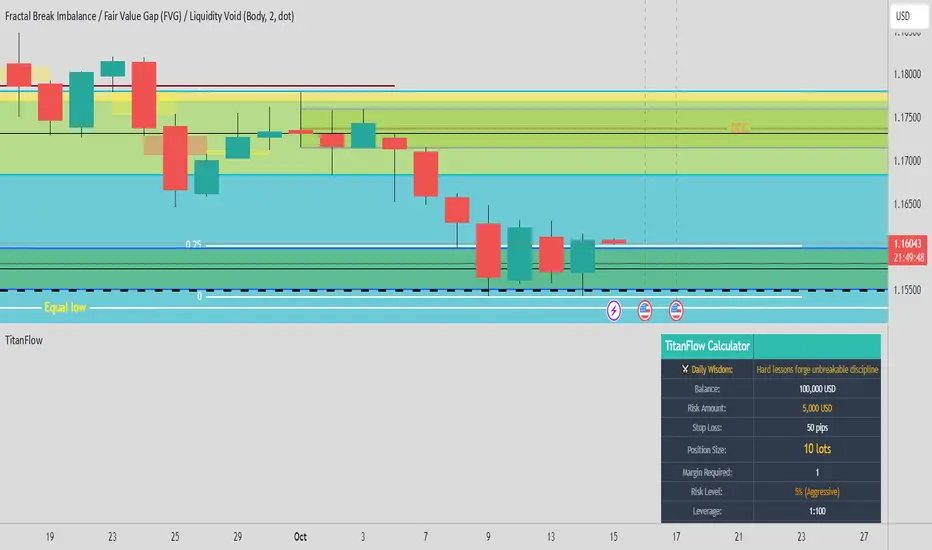
TitanFlow Position CalculatorTitanFlow Position Calculator - Professional Risk Management Tool
Transform your trading with precision position sizing and advanced risk management
The TitanFlow Position Calculator is a comprehensive Pine Script indicator designed for serious traders who demand professional-grade risk management tools. Whether you're trading forex, commodities, indices, or crypto, this calculator ensures you never risk more than intended while maximizing your profit potential.
🎯 Key Features:
SMART POSITION SIZING
Automatic lot size calculation based on your risk parameters
Support for percentage risk, fixed amount, or losing streak buffer modes
Real-time position size updates as market conditions change
Double-up mode for aggressive trading strategies
MULTI-ASSET SUPPORT
Pre-configured settings for Forex Major/Minor pairs
Commodities: Gold, Silver, Oil with accurate pip values
Stock indices with proper contract specifications
Cryptocurrency trading support
Custom instrument configuration for any asset
ADVANCED RISK MANAGEMENT
Visual risk level categorization (Conservative, Moderate, Aggressive, Extreme)
Color-coded risk warnings with threshold alerts
Margin requirement calculations with leverage integration
Take profit level planning with lot distribution
PROFESSIONAL THEMES
TitanFlow Dark theme matching the professional trading platform
TitanFlow Light theme for bright chart environments
Classic dark/light themes for traditional traders
Full custom colour control for personalized setups
COMPREHENSIVE LEVERAGE SUPPORT
Complete leverage options from 1:1 to 1:500 including:
1:1, 1:10, 1:15, 1:20, 1:30, 1:50, 1:100, 1:200, 1:300, 1:400, 1:500
📊 What You'll See:
REAL-TIME CALCULATIONS
Position size in lots displayed prominently
Risk level percentage with color coding
Margin requirements in your account currency
Stop loss distance in pips
Take profit distribution across multiple levels
CLEAN INFORMATION TABLE
Account balance and currency display
Current risk amount being wagered
Calculated position size and margin needs
Risk categorization with visual indicators
Leverage ratio confirmation
SMART ALERTS
Extreme risk warnings (>5% per trade)
Large position alerts (>10 lots)
High margin usage notifications (>50% account)
Real-time risk assessment updates
🚀 Take Your Trading Further with TitanFlow
Want more than just position sizing?
Visit titanflow.co.uk to discover the complete TitanFlow trading ecosystem:
✅ Advanced Trading Dashboard - Comprehensive portfolio tracking and analytics
✅ Trade Journal Integration - Log and analyze every trade automatically
✅ AI-Powered Coaching - Get personalized trading insights and recommendations
✅ Monthly Performance Reports - Detailed analytics delivered to your inbox
✅ Risk Management Suite - Professional tools for serious traders
✅ Trading Calendar - Never miss important market events
✅ Community Access - Connect with successful traders worldwide
Special Offer: TradingView users get exclusive access to premium features. Transform your trading from guesswork to systematic success. coming soon
🎨 Customization Options:
Theme Selection
Choose from 5 professional themes
Customize every colour element
Match your chart aesthetic perfectly
Professional branding options
Display Controls
Position table in any corner
Show/hide alerts and warnings
Adjustable text sizes
Clean, distraction-free interface
💡 Perfect For:
Day Traders who need quick position sizing decisions
Swing Traders planning multi-level exits
Scalpers requiring precise risk control
Portfolio Managers overseeing multiple accounts
Risk Managers monitoring exposure levels
Trading Educators teaching proper risk management
🚀 How to Use:
Set Your Account - Enter balance and currency
Choose Risk Mode - Percentage (recommended 1-2%), fixed amount, or losing streak buffer
Configure Instrument - Select asset type or use custom settings
Set Stop Loss - Enter your stop distance in pips
Read Results - Get instant position size and risk analysis
⚠️ Risk Management Excellence:
This calculator embodies the core principle that successful trading is about risk management, not just profit hunting. By using proper position sizing, you'll:
Survive losing streaks with capital intact
Compound profits systematically
Sleep better knowing your risk is controlled
Build consistent trading habits
Protect your trading capital long-term
Ready to elevate your entire trading operation? Start with this position calculator, then visit titanflow.co.uk to unlock the full potential of systematic, professional trading.
This indicator is part of the TitanFlow trading ecosystem. titanflow.co.uk coming soon here you'll be able to obtain the complete professional trading platform.
STH Unrealized Profit/Loss Ratio (STH-NUPL) | [DeV]STH-NUPL
The Short-Term Holder Net Unrealized Profit/Loss Ratio (STH-NUPL) is an analytical tool designed to approximate the unrealized profit or loss of Bitcoin’s short-term holders (STHs)—typically those holding coins for less than 155 days—within the constraints of TradingView’s price-based environment. Drawing inspiration from the canonical STH-NUPL metric, which assesses the difference between the market value and realized value of STH-held coins, this indicator adapts the concept into a normalized ratio using Bitcoin’s price data as a proxy. It offers a window into the sentiment and behavior of short-term market participants, who are often more sensitive to price fluctuations than long-term holders.
In its raw form, STH-NUPL oscillates around a break-even threshold of 0, where positive values indicate aggregate unrealized profits for STHs (market value exceeds realized value), and negative values suggest losses. This inflection point frequently acts as a key level: in bear markets, it can signal capitulation as STHs sell at break-even or below, while in bull markets, it may reflect reluctance to realize losses, providing support. The indicator enhances this metric with smoothing, a moving average overlay, and sophisticated visualization options, delivering a statistically informed perspective on short-term holder dynamics tailored for institutional-grade analysis.
STH-NUPL Settings -
Lookback Length (Default: 150 days): Defines the SMA period for estimating realized value. This 150-day window aligns with traditional STH definitions (e.g., <155 days), capturing a broad yet relevant historical cost basis for short-term holders, ideal for assessing cyclical behavior.
Smoothing Period (Default: 5 days): Applies an EMA to the raw STH-NUPL ratio, with a short default period to maintain responsiveness to recent price shifts while filtering out daily volatility. This setting is particularly suited for tactical analysis.
Moving Average Settings -
MA Lookback Length (Default: 90 days): Sets the period for the STH-NUPL’s moving average, offering a medium-term trend signal that contrasts with the 150-day lookback, enabling detection of momentum shifts within broader market phases.
MA Type (Default: EMA): Provides six moving average types, from the straightforward SMA to the volume-sensitive VWMA. The default EMA balances smoothness and reactivity, while options like HMA or VWMA cater to specialized needs, such as emphasizing recent action or volume trends.
Display Settings -
Show Moving Average (Default: True): Toggles the visibility of the STH-NUPL MA plot, allowing users to focus solely on the smoothed ratio when desired.
Show Background Colors (Default: True): Activates dynamic background shading to visually reinforce market regimes.
Background Color Source (Default: STH-NUPL): Enables users to tie the background to either the STH-NUPL’s midline (reflecting sthNupl > 0) or the MA’s trend direction (maNupl > maNupl ), aligning the visual context with the chosen analytical focus.
Analytical Applications -
Bear Market Capitulation: When the smoothed STH-NUPL approaches or falls below zero, it often signals loss realization among STHs, a precursor to capitulation in downtrends. A declining MA crossing zero can confirm this selling pressure.
Bull Market Support: Positive STH-NUPL values with a rising MA indicate STHs are in profit and reluctant to sell at a loss, forming support zones in uptrends as sell pressure wanes.
Sentiment Extremes: Significant deviations above or below zero highlight over-optimism or despair among STHs, offering contrarian opportunities when paired with price action or other on-chain metrics.
**Limitations**
As a TradingView-based approximation, this indicator uses price data (close) rather than true on-chain STH supply and realized price, which are available through providers like Glassnode. The 150-day SMA for realized value simplifies the cost basis, potentially underrepresenting the diversity of STH transactions. Despite this, the smoothed ratio and moving average overlay provide a practical proxy for tracking STH sentiment within TradingView’s ecosystem.

Scalping Tool with Dynamic Take Profit & Stop Loss### **Scalping Indicator: Summary and User Guide**
The **Scalping Indicator** is a powerful tool designed for traders who focus on short-term price movements. It combines **Exponential Moving Averages (EMA)** for trend identification and **Average True Range (ATR)** for dynamic stop loss and take profit levels. The indicator is highly customizable, allowing traders to adapt it to their specific trading style and risk tolerance.
---
### **Key Features**
1. **Trend Identification**:
- Uses two EMAs (Fast and Slow) to identify trend direction.
- Generates **Buy Signals** when the Fast EMA crosses above the Slow EMA.
- Generates **Sell Signals** when the Fast EMA crosses below the Slow EMA.
2. **Dynamic Take Profit (TP) and Stop Loss (SL)**:
- **Take Profit (TP)**:
- TP levels are calculated as a percentage above (for long trades) or below (for short trades) the entry price.
- TP levels are **dynamically recalculated** when the price reaches the initial target, allowing for multiple TP levels during a single trade.
- **Stop Loss (SL)**:
- SL levels are calculated using the ATR multiplier, providing a volatility-based buffer to protect against adverse price movements.
3. **Separate Settings for Long and Short Trades**:
- Users can independently enable/disable and configure TP and SL for **Buy** and **Sell** orders.
- This flexibility ensures that the indicator can be tailored to different market conditions and trading strategies.
4. **Visual Signals and Levels**:
- **Buy/Sell Signals**: Clearly marked on the chart with labels ("BUY" or "SELL").
- **TP and SL Levels**: Plotted on the chart for both long and short trades, making it easy to visualize risk and reward.
---
### **How to Use the Scalping Indicator**
#### **1. Setting Up the Indicator**
- Apply the indicator to your chart in TradingView.
- Configure the input parameters based on your trading preferences:
- **Fast Length**: The period for the Fast EMA (default: 5).
- **Slow Length**: The period for the Slow EMA (default: 13).
- **ATR Length**: The period for the ATR calculation (default: 14).
- **Buy/Sell TP and SL**: Enable/disable and set the percentage or ATR multiplier for TP and SL levels.
#### **2. Interpreting the Signals**
- **Buy Signal**:
- When the Fast EMA crosses above the Slow EMA, a "BUY" label appears below the price bar.
- The TP and SL levels for the long trade are plotted on the chart.
- **Sell Signal**:
- When the Fast EMA crosses below the Slow EMA, a "SELL" label appears above the price bar.
- The TP and SL levels for the short trade are plotted on the chart.
#### **3. Managing Trades**
- **Take Profit (TP)**:
- When the price reaches the initial TP level, the indicator automatically recalculates the next TP level based on the new close price.
- This allows traders to capture additional profits as the trend continues.
- **Stop Loss (SL)**:
- The SL level is based on the ATR multiplier, providing a dynamic buffer against market volatility.
- If the price hits the SL level, the trade is considered closed, and the indicator resets.
#### **4. Customization**
- Adjust the **Fast Length** and **Slow Length** to suit your trading timeframe (e.g., shorter lengths for scalping, longer lengths for swing trading).
- Modify the **ATR Multiplier** and **TP Percentage** to align with your risk-reward ratio.
- Enable/disable TP and SL for long and short trades based on your trading strategy.
---
### **Tips for Getting the Best Results**
1. **Combine with Price Action**:
- Use the Scalping Indicator in conjunction with support/resistance levels, candlestick patterns, or other technical analysis tools to confirm signals.
2. **Optimize for Your Timeframe**:
- For **scalping**, use shorter EMA lengths (e.g., Fast: 5, Slow: 13).
- For **swing trading**, use longer EMA lengths (e.g., Fast: 10, Slow: 20).
3. **Adjust Risk Management**:
- Use a smaller **ATR Multiplier** for tighter stop losses in low-volatility markets.
- Increase the **TP Percentage** to allow for larger price movements in high-volatility markets.
4. **Backtest and Practice**:
- Test the indicator on historical data to understand its performance in different market conditions.
- Use a demo account to practice trading with the indicator before applying it to live trading.
---
### **Conclusion**
The **Scalping Indicator** is a versatile and user-friendly tool for traders who want to capitalize on short-term price movements. By combining trend-following EMAs with dynamic TP and SL levels, it provides a clear and systematic approach to trading. Whether you're a scalper or a swing trader, this indicator can help you identify high-probability setups and manage risk effectively. Customize it to fit your strategy, and always remember to combine it with sound risk management principles for the best results.

Stop Loss & Take Profit LevelsCalculate and Plot Stop Loss (SL) Levels:
The indicator calculates the Stop Loss price level based on the account balance, risk percentage, and the trade's entry price.
For long positions, the SL is below the entry price.
For short positions, the SL is above the entry price.
Calculate and Plot Take Profit (TP) Levels:
The indicator calculates up to three Take Profit (TP) levels, each based on different Risk/Reward (R:R) ratios.
The R:R ratio determines how much reward (profit) you aim to achieve relative to the risk (the distance between the entry price and the stop loss).
These TP levels are plotted on the chart as lines above the entry price for long positions or below the entry price for short positions.
Manual Entry Price:
The user can input a manual entry price to simulate trades or plan trades before entering the market. This makes it useful for pre-trade analysis.
Dynamic Position Type:
Users can toggle between Long or Short positions:
Long Position: The trader expects the price to go up.
Short Position: The trader expects the price to go down.
The indicator adapts its calculations (SL and TP levels) based on the selected position type.
Risk Calculation Based on Account Balance:
The indicator calculates the amount of capital at risk (in €) based on the trader's account balance and the selected risk percentage.
For example:
If the account balance is €1,000 and the Stop Loss percentage is 1%, the risk amount is €10.
Visual Representation on the Chart:
The following levels are plotted on the chart:
Stop Loss Level (Red Line): The price level at which the trader would exit the trade to limit losses.
Take Profit Levels (Green Lines): Up to three price levels where the trader could take profits based on R:R ratios.
Entry Price (Blue Line): The price level where the trade begins.
These lines are dynamically updated as inputs are changed, providing instant feedback to the trader.

Simple Average Price & Target ProfitThis script is designed to help users calculate and visualize the weighted average price of an asset based on multiple entry points, along with the target price and the potential profit. The user can input specific prices for three different entries, along with the percentage of total investment allocated to each price point. The script then calculates the weighted average price based on these entries and displays it on the chart. Additionally, it calculates the potential profit at a given target price, which is plotted on the chart.

Mastering ATR for Smart Stop Loss and Take Profit PlacementUsing the ATR indicator to set Stop Loss and Take Profit levels provides a dynamic and flexible way to manage risk based on the volatility of the market. This method ensures that your SL and TP are always in tune with current market conditions, preventing unnecessary stop-outs while maximizing the potential for profit. The table in the script makes it easy to view your calculated levels directly on the chart, improving your trading efficiency.
If you're looking for a more automated way to manage your trades, integrating ATR-based SL and TP can be a powerful tool in your strategy.
Happy Trading!

BTC Supply in Profits and Losses (BTCSPL) [AlgoAlpha]Description:
🚨The BTC Supply in Profits and Losses (BTCSPL) indicator, developed by AlgoAlpha, offers traders insights into the distribution of INDEX:BTCUSD addresses between profits and losses based on INDEX:BTCUSD on-chain data.
Features:
🔶Alpha Decay Adjustment: The indicator provides the option to adjust the data against Alpha Decay, this compensates for the reduction in clarity of the signal over time.
🔶Rolling Change Display: The indicator enables the display of the rolling change in the distribution of Bitcoin addresses between profits and losses, aiding in identifying shifts in market sentiment.
🔶BTCSPL Value Score: The indicator optionally displays a value score ranging from -1 to 1, traders can use this to carry out strategic dollar cost averaging and reverse dollar cost averaging based on the implied value of bitcoin.
🔶Reversal Signals: The indicator gives long-term reversal signals denoted as "▲" and "▼" for the price of bitcoin based on oversold and overbought conditions of the BTCSPL.
🔶Moving Average Visualization: Traders can choose to display a moving average line, allowing for better trend identification.
How to Use ☝️ (summary):
Alpha Decay Adjustment: Toggle this option to enable or disable Alpha Decay adjustment for a normalized representation of the data.
Moving Average: Toggle this option to show or hide the moving average line, helping traders identify trends.
Short-Term Trend: Enable this option to display the short-term trend based on the Aroon indicator.
Rolling Change: Choose this option to visualize the rolling change in the distribution between profits and losses.
BTCSPL Value Score: Activate this option to show the BTCSPL value score, ranging from -1 to 1, 1 implies that bitcoin is extremely cheap(buy) and -1 implies bitcoin is extremely expensive(sell).
Reversal Signals: Gives binary buy and sell signals for the long term

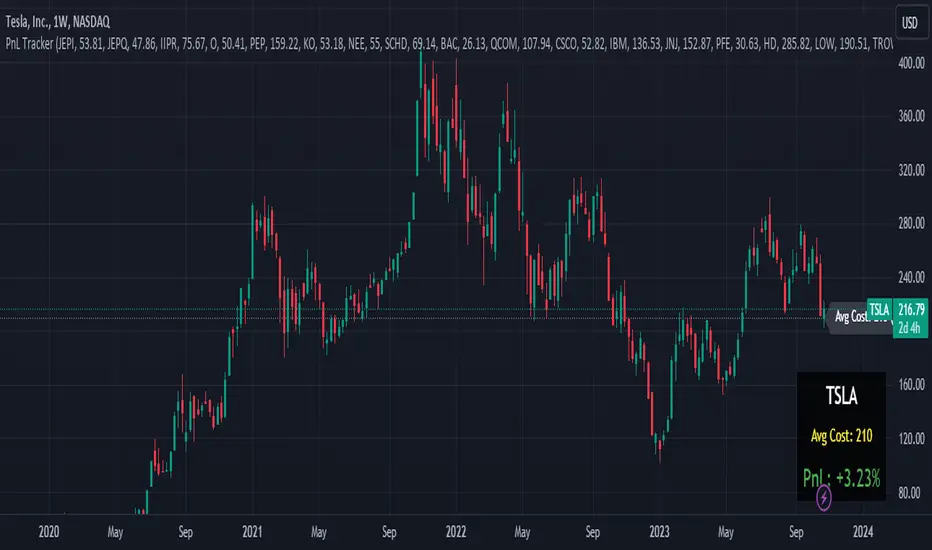
Portfolio PnL Tracker
This is a personal portfolio tracker that helps you track your daily profits and losses. You can track up to 64 stocks or cryptocurrencies. You can set them by specifying the symbol and average price.
FEATURES
- Set up to 64 stock or crypto symbols.
- Shows the average price line
- Show profit or loss as a percentage
- Shows only when on the chart that matches the symbol settings.
HOW TO USE
1. Double click the PnL Tracker indicator at the top left of the chart
2. Enter your symbol and average cost
The average cost line shows your current position.
PnL is calculated based on the average cost you input.
The Profit and Loss (PnL) box and the average cost line will only be displayed when your input symbol matches the chart you are currently viewing.
AFRHi everyone! Sorry for not posting anything for so long again. I will be active in July, after passing my university exams. I bought some S&C magazine archives, so await my new post strategies and indicator in July, as things are gonna get real interesting! But for now let me hand you some new and interesting stuff — AFR indicator.
Actually, this is my third time republishing this indicator after a big timeout because of the battles with TV mods on reference politics (which I lost).
This is indicator was originaly made by some user from other trading website, which I can't mention because of TV reference politics.
Which principles are behind AFR?
First we define our own low and high (OL and OH respectively), which are equal to:
OL = open - ATR * ATR_Factor
OH = open + ATR * ATR_Factor,
where ATR — Average True Range,
ATR_Factor — "Factor" in the settings — multiplier for ATR.
On each tick we remember AFR's value from previous bar, if it is not 0.
When OL is greater then AFR, then AFR is equal to OL. It means that there is probably an uptrend, so we adjust AFR accordingly.
When OH is lower then AFR, then AFR is equal to OH. It means that there is probably a downtrend, so we adjust AFR accordingly.
How to use?
Green AFR — bullish trend.
Red AFR — bearish trend.
Green AFR's triangle up — buy signal — appears when AFR changes it's colour from red to green.
Red AFR's triangle down— sell signal — appears when AFR changes it's colour from green to red.
ALERTS INCLUDED!
My personal ecommendations
- You can AFR as a tool to find short-term and middle-term trends, as it does it's best to find such trends;
- If are a scalper, then you probably should try AFR on low factor settings, as AFR alone can find good scalping entries.
- As AFR is a trend indicator, please use it with other confirmation indicator to make better entries.
Hope you will find this script useful.
Take your profits!
- Tarasenko Fyodor

Q-TrendQ-Trend is an multipurpose indicatorm that can be used for swing- and trend-trading equally on any timeframe (non-volatile markets are better for this thing).
Settings:
Trend period - used to calculate trend line in the special moments(will explain below);
ATR Multiplier - changes sensitivity. The higher the multiplier = the more sensitive it is.
Also option to smooth source data (helps get cleaner signals, as always).
How to use?
Signals are given on the chart. Also ou can use trend line as S/R line.
The idea behind:
Terms:
SRС = Source
TL = trend line;
MP = ATR multiplier;
ATR = ATR :)
TL = (highest of source P-bars back + lowest of source P-bars back) / 2
Epsilon = MP * ATR
I was thinking for a week about combining volatility and relation between highest and lowest price point. That why I called indicator Q-Trend = Quantitative Trend , as I was trying to think about price in a mathematical way.
Okay, time to go philosophical:
1) TL is shows good price trend, but as it is slow enough and not enough informative, we need add additional conditions to produce signals.
2) Okay, so what can we add as conditions? We need to take volatility into account, as it is crucial in the moments of market uncertainty. So let's use ATR (Average True Range) somehow. My idea is that if SRC breaks TL + ATR , then it means that there will be upmove and we update our TL . Analogically for SRC breaking TL - ATR (breaks are crosses of TL +- ATR lines) .
Conclusion:
- if SRC breaks TL + ATR , it is a BUY signal and update of trend line;
- if SRC breaks TL - ATR , it is a SELL signal and update of trend line;
I think that such indicator already exisits on TradingView, as I've already saw something similar, but long ago, so please don't report, if such thing already exists.
But if not, then I hope, that you will gain some profits with Q-Trend :)
I will continue my work on this thing, so stay tuned.
Trade with your own risks and have your profits!
Wish you all the best!
- Tarasenko Fyodor

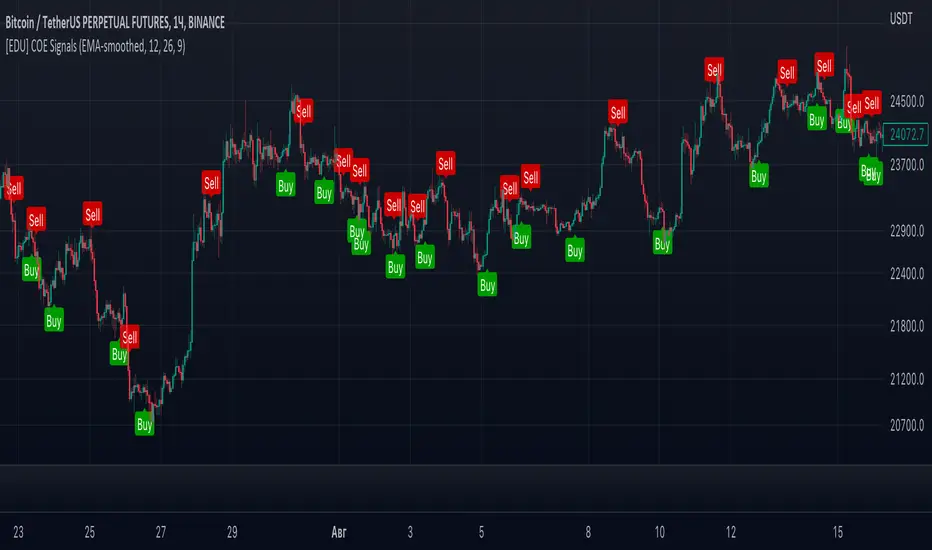
[EDU] Close Open Estimation Signals (COE Signals)EN:
Close Open Estimation ( aka COE ) is a very simple swing-trading indicator based on even simpler idea. This indicator is from my educational series, which means that I just want to share with another way to look at the market in order to broaden your knowledge .
Idea :
Let's take n previous bars and make a sum a of close - open -values of each bar. Knowledgeable of you may already see the similarity to RSI calculation idea . Now let's plot this sum and see what we have now.
We can see, that whenever COE crosses over 0-level, uptrend begins, and if COE crosses under 0-level, downtrend begins. The speed of such signals can be adjusted by changing lookback period: the lower the lookback, the faster signals you get, but high-quality ones can be obtained only via not-so-fast lookback as when the market is consolidating or volatility is to high, there can be many garbage signals, like 95+% of other indicators have.
Let's explore more and calculate volatility of COE(v_coe in the code): current COE - previous CEO .
Now it appears that when v_coe crosses over 0-level, it's a signal, that this is a new low and soon the uptrend will follow. Analogically for crossing under 0-level .
I guess now you understood what these all are about: COE crossings show global trend signals , while Volatility COE ( v_coe or VCOE ) crossings show reversal points .
For signals I further calculated volatility of VCOE(VVCOE) and then volatility of VVCOE(VVVCOE). Why? Because for me they seem to be more accurate, but you are welcome to experiment and figure best setups for yourself and by yourself, I just share my opinion and experience .
COE can be helpful only in high liquidity markets with good trend or wide sideways .
If you want to experiment with COE, just copy the code and play with it. Curious of you will probably find it helpful eventhough the idea is way too simple.
By it's perfomance COE can probably beat QQE at open price settings.
(use open of the price at indicator to get zero repaint! )
Examples :
If you any questions, feel free to DM me or leave comments.
Good luck and take your profits!
- Fyodor Tarasenko
RU:
Close Open Estimation ( aka COE ) — это очень простой индикатор свинг-трейдинга, основанный на еще более простой идее. Этот индикатор из моей образовательной серии, а это значит, что я просто хочу поделиться с другим взглядом на рынок , чтобы расширить ваши знания .
Идея :
Возьмем n предыдущих баров и составим сумму a из close - open -значений каждого бара. Знающие люди могут уже заметить сходство с идеей расчета RSI . Теперь давайте построим эту сумму и посмотрим, что у нас сейчас есть.
Мы видим, что всякий раз, когда COE пересекает выше 0-уровня, начинается восходящий тренд , а если COE пересекает ниже 0-уровня, начинается нисходящий тренд. Скорость таких сигналов можно регулировать изменением ретроспективы: чем меньше ретроспектива, тем быстрее вы получаете сигналы, но качественные можно получить только через не- такой быстрый взгляд назад, как когда рынок консолидируется или волатильность слишком высока, может быть много мусорных сигналов, как у 95+% других индикаторов.
Давайте рассмотрим больше и рассчитаем волатильность COE(v_coe в коде): текущий COE - предыдущий CEO .
Теперь кажется, что когда v_coe пересекает уровень 0, это сигнал о том, что это новый минимум и вскоре последует восходящий тренд . Аналогично для пересечения под 0-уровнем .
Думаю, теперь вы поняли, о чем все это: COE пересечения показывают глобальные сигналы тренда , а пересечения Volatility COE ( v_coe или VCOE ) показывают точки разворота .
Для сигналов я дополнительно рассчитал волатильность VCOE(VVCOE), а затем волатильность VVCOE(VVVCOE). Почему? Потому что для меня они кажутся более точными, но вы можете поэкспериментировать и подобрать оптимальные настройки для себя и для себя, я просто делюсь своим мнением и опытом .
COE может быть полезен только на рынках с высокой ликвидностью и хорошим трендом или широким боковиком .
Если вы хотите поэкспериментировать с COE, просто скопируйте код и поэкспериментируйте с ним. Любознательные из вас, вероятно, сочтут это полезным, хотя идея слишком проста.
По своей результативности СОЕ может составить конкуренцию широко известному QQE, используя open цены.
(используйте open цены на индикаторе, чтобы получить нулевую перерисовку! )
Примеры :
Если у вас есть вопросы, пишите мне в личные сообщения или оставляйте комментарии.
Удачи и профита всем!
- Федор Тарасенко
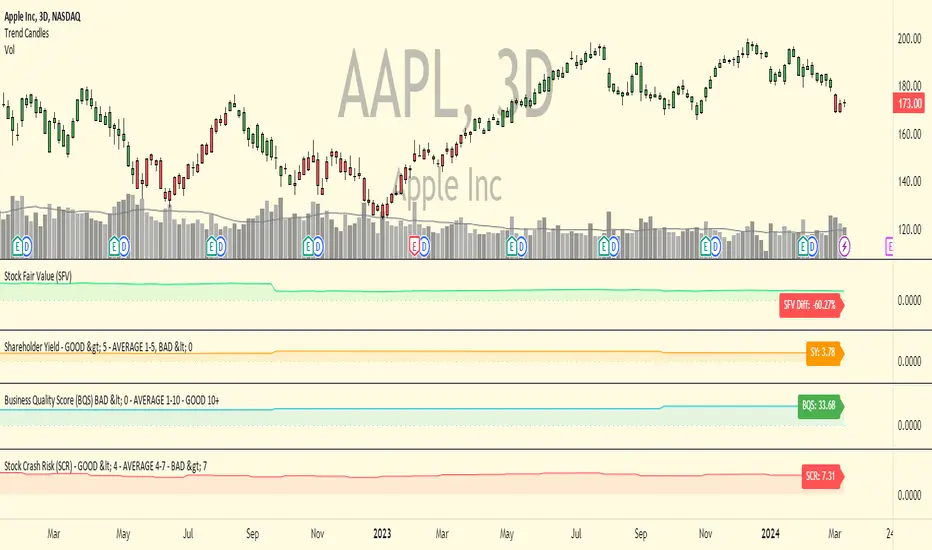
Business Quality Score (BQS)Business Quality Score (BQS) is an indicator that can be used to determine how strong, safe and efficient a business is. Generally speaking, a negative reading under 0 indicates a poor quality business, a reading between 1-10 indicates an average quality business and a reading above 10 indicates a high quality business. This indicator is only applicable on stocks, not on forex, futures or crypto.
The indicator uses fundamental data to calculate the reading and hence doesn't have any changeable settings for the user. The score is based on the profitability of a business and how efficiently it uses capital to generate shareholder returns. The indicator also looks at the debt, leverage and liquidity of the business to help determine the score. Generally speaking businesses with lot's of debt, high leverage and low liquidity will lead to lower scores.
This indicator is designed more for stock investors with longer timeframes and isn't suited towards short term traders. It can be used as part of an overall investment process to help identify high quality businesses that are suitable for long term investing. It can be used to monitor current investments to see if a stock's overall business quality is improving or deteriorating.
To get access to this indicator PM or email me to my address shown below.
Enjoy :)
Disclaimer: All my scripts and content are for educational purposes only. I'm not a financial advisor and do not give personal finance advice. Past performance is no guarantee of future performance. Please trade at your own risk.