Smart EMA SignalsThis indicator starts by plotting each time the price action crosses above or below the EMA, of which you can tune the timeframe and duration.
It then takes it a step further and plots whether or not that indicator would have given you a profitable trade, of which you can also tune the parameters (Max wait time, and % Profit).
Once you have your EMA tuned to your liking, set up alerts to notify you of a golden opportunity.
在腳本中搜尋"profit"

SB On Balance Profit/Loss IndicatorI was always interested in volume indicators as well as market sentiment.
While brainstorming, I came to the thought that people with gains vs people with losses can move a stock up or down.
I don't want to debate the rational behind people buying and selling based on profits or losses, so this isnt a signaling indicator.
However, I still wanted to have a way to measure and visualize this information.
On Balance Volume was not enough for me. I wanted to know how much actual money was made or lost, over time.
This indicator was created based on two different time periods, the daily and the 30m.
The daily time period is used to measure money made from close of the day before to the open of the current day (gap up/down).
The 30 minute precision period is used to measure the money made from the close of the current bar from the close of the bar prior and calculated 13 times per trading session.
There is an option for 15 minute and 5 minute precision, but it may take longer for the script to process and may time out at lower precision periods.
The default lookback period is 10 days, values are cumulative. We can clearly see over the last 10 days how much money was made, lost and on balance. This should affect trader sentiment.
Visual display is the cumulative money made (green line), cumulative money lost (red line), and cumulative net on balance money (black line). The net on balance money is filled green above zero and filled red below zero.
The Green Histogram is the money made overnight, the Red histogram is the money lost overnight.
The black histogram above zero is the money made intraday and the black histogram is the money lost intraday.
Takeways
Just because a stock is trending down, as noted by the downward slop in price on the daily chart , it does not mean that the average trader is losing money. Intraday price action can offset money lost at higher time periods.
Especially in cases where a stock gaps down overnight, buyers step in at the low and the stock closes above open, but below previous days close. Esspecially when this is done on high volume .
The net profit can be greater than net loss, even if the day closes down from previous close. This can really help with "sentiment" and being able to visualize this sentiment may be helpful in making a decision to buy or sell.
View my collection of custom scripts at: www.tradingview.com

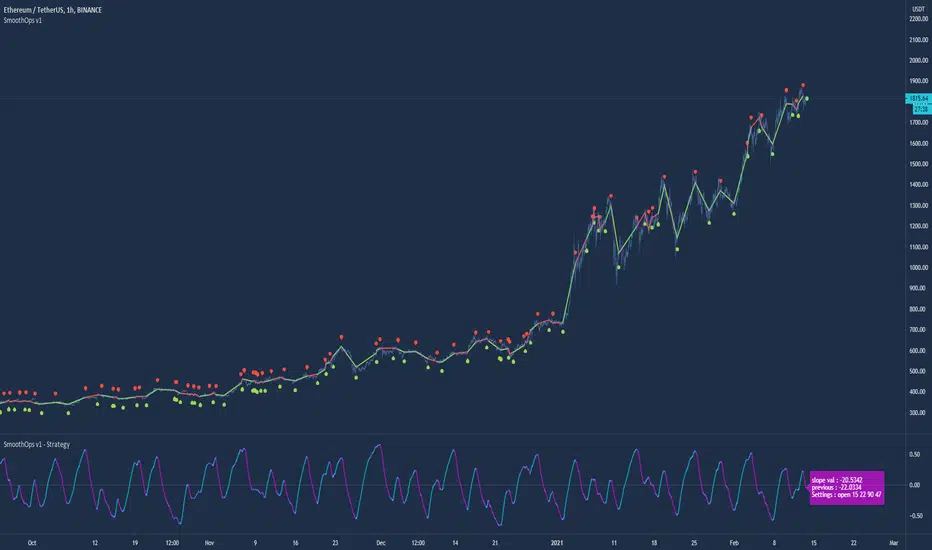
SmoothOps v1 - StudyThe purpose of this script was to fine tune an indicator on BTCUSDT . I think the results speak for themselves in the study version.
This is a script that uses the MACD to predict future price movement. The original MACD signal lags too much for my taste so I went searching for something that could give signals sooner. I decided a smooth macd would help filter out noise and grabbing the highest values and lowest values over the past number of bars. I spent several days backtesting different settings and combinations of signals to arrive at what you see now. This strategy has been fine tuned for BTC /USDT on Binance, so I suggest you only use it for that. Any other coin/pair and exchange will need a new backtest since the data will be different. This is not a generalized indicator like everything else. It's specifically good at one thing: prediction BTCUSDT on Binance.
I wanted to also add the histogram from the study version but there wasn't a good way to do that, so I came up with a visual solution using color transitions on the 168sma. When the color changes from blue to red it means the histogram is reversing.
I added forecasting to the moving averages to help people predict future movement so they can make decisions by something other than just a sign of when to buy/sell.
There is a transition prediction feature that blurs the macd signal to show when a reversal may occur before it happens.
I also added precitions into the indicator that show when there may be a possible bounce or major move because of a current squeeze in the moving averages.
And finally...
My biggest issue with indicators that other people sell is that they become visually deceptive when using supports and buy/sell signs. I came up with a solution that shows you exactly if you made profits during the trade or not. Hopefully this will inspire others to do something similar.
How to use:
Use only on BTCUSDT Binance.
Set the preset to the timeframe you want. I HIGHLY suggest only using the 1h timeframe. It gives the best profit over time.
Set the preset to custom if you want to try using your own settings.
You can change the source input if you want. ohlc4 usually works best for 1h.
Adjust the moving averages to your liking. You can also toggle the checkbox to completely remove them.
Turn on/off the forecasting of the moving averages.
Turn on/off the additional signals with the checkbox.
Transition prediction uses a blur variable to signal when the macd might be slowing down and reversing.
Bounce prediction and sensitivity tries to find possible reversal areas when price falls too fast or hits a specific moving average.
Macro signals just tries to show when price is above the 168moving average to get the macro trend.
Squeeze prediction indicates when a possible strong move may occur. Could go up or down though.
Show profit is my favorite part because it shows if you made profit during the last trade visually and non deceptively.
Bjorgum Triple EMA Strat-This script uses a triple EMA strategy to establish trend direction and reversal points
-Inputs are smoothed with Heiken Ashi values to reduce whipsaws, while providing timely execution
-Buy and sell indications are dictated by bar color
-Bar color is dictated by the candle close value in relation to the EMAs, specifically the faster of the 3
(If candle closes above or below the fast and intermediate averages, a buy or sell signal is indicated by bar color change)
-If the close falls between the two a cautionary signal is given. The viewer can hold, or take profit, or evaluate other indicators for clues
-Best results are obtained when coupled with Bjorgum TSI and Bjorgum RSI for confirmation of signals (see TradingView profile)
@Bjorgum on Stocktwits

Swing Low Sweet ChariotI've been using this indicator now for the past few months and seen some very large profits as a result of it.
I've been using this successfully on the one hour FX charts, but seems to work equally as well on higher or lower time frames (not less than 30min).
I've added in some support and resistance functionality and plenty of settings to play with to fine tune to your strategy.
One of the main reasons that I've added in some support and resistance is that there are some times when an indicator is triggered very close to a S&R point then I may not take the trade.
Additionally to the indicator, I'll use trend lines, ADX and RSI to confirm the trend.
Alerts are set up for Long Entry, Short Entry, Long Exit and Short Exit.
Not that the exit points are approximate and won't hit the peaks, however they will prevent price retracement.
Offering 5-day free use of the indicator and then after that it will be £100/yr if you like the indicator. This will also cover all future updates.
Happy to answer any questions or send over other screenshots of currency pairs. Also happy to work with any other users if they have any ideas for improving (i.e. automated trend lines).
Cheers
Mike

[HTI2] Hiubris Trend Indicator 2This is the Study version of the Hiubris Trend Indicator 2 (Used for Alerts)
After testing several strategies for months and comparing them to the standard 'Buy and Hold' method, we've found the best performing strategy for BTCUSDT
We simplified it to make it more user-friendly (We've only added 1 optional exit: a % SL) and left all the inputs adjustable, so it can be optimized for ANY pair!
This is a Trend Indicator! This means that the '% Profitable Trades' is not the main focus, but catching every trend swing. When trying to catch every trend swing, naturally alot of the them might be unprofitable, especially in sideways markets. The idea behind this strategy is to catch all the significant trend movements, which are alot more profitable than all the 'sideway market' losses
This indicator is fully adjustable and matches exactly the published strategy!
The user has the option to setup alerts for all chart signals (Entries, Re-Entries, Stop-Loss)

DMT Ladder AutobotDMT Ladder Autobot Study it's unique super trend indicators that measure the volatility from the current price action with ATR recognitions and custom setting
in this version, we can find that DMT Autbot also Ladders long entry and short entry in 4 different steps you can set your calculations depending on your requirements and pair volatility calculations
to recover your entry DMT will turn loosing trading into winning trades with the right risk management.
1 long signals
4 ladder Long add signals
1 short signals
4 ladder short add signals
1 dynamic stop calculated from your average entry price
1 dynamic take profit calculated from your average entry price
Please pm me for access or larger explanations about the script or for full pdf tutorial
thx for your support
@Shenlong

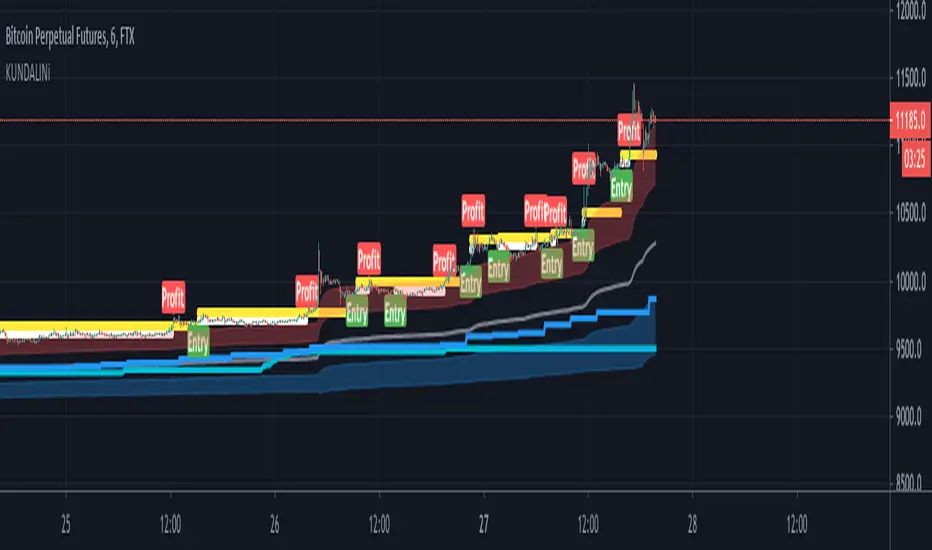
KUNDALINiThis is the STudy Version of The Kundalini is a technical indicator. Based on algorithm calculations, this indicator extrapolates the previous price for the next bar. Plus addition Multi time frame ATR volatility Reading environment for higher conditions
Here is how Dominator is calculated:
1. The study estimates the price projected for the next bar. The estimated price is based on the algorithm method.
2. The study extrapolates this value to find a projected price change for the next bar.
The resulting extrapolated value is shown as a histogram on a lower subgraph. By default, sections of the histogram where the extrapolated value is increasing are shown in green; sections corresponding to the decreasing value are shown in red.
Note: Value projection is purely mathematical as all calculations are based on algorithm averaging of previous values.
additional volatility models clouds on blue and red for bearish and bullish markets
Overlay True
The strategy includes 3 different adjustable levels for the ladder , plus automatic adjustable stop loss and takes profit calculated from your average entry price after each ladder adds.
Adjustable BAcktest Window.
1 long signals
3 ladder long add signals
1 short signals
3 ladder short add signals
1 dynamic stop calculated from your average entry price
1 dynamic take profit calculated from your average entry price
Please Private Msg me if you like more info about the script Full pdf available or if you need access to it
thx for your time and support
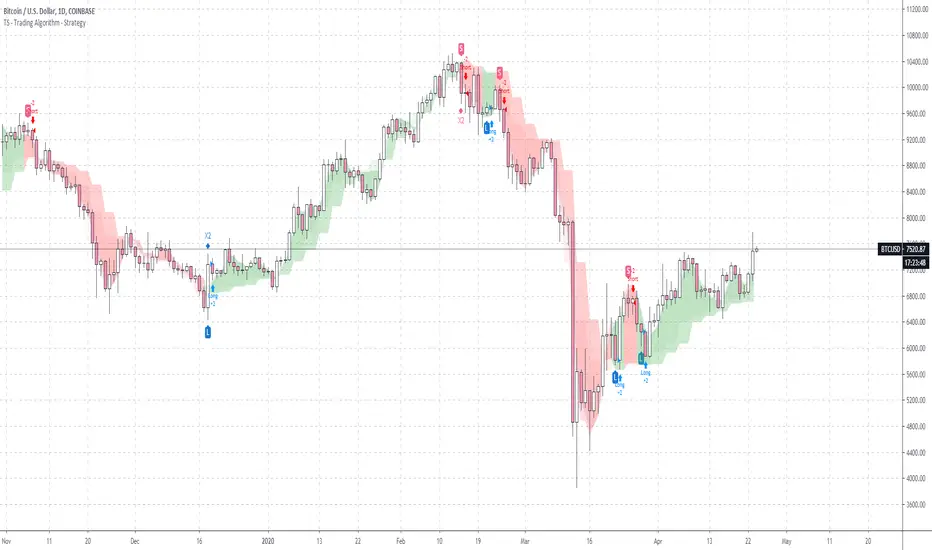
TS - Trading Algorithm - StrategyStrategy to the bespoke TS - Trading Algorithm . Highly profitable cryptocurrency trading model.
Access to both the backtesting strategy & indicator is paid - PM me for details.
Indicator does not repaint and has no discretionary approach - you can follow blindly and take advantage of the performance.
Takashi Triangular Arbitrage | 2nd Gen | [Alerts]Spot discrepancies between three currencies: these opportunities are rare and usually benefit to traders using advanced programs. You can now set up alerts and discover those for yourself.
This indicator signals opportunities for executing triangular arbitrage. Triangular arbitrage is the result of a discrepancy between three different currencies that occurs when the currency's exchange rates do not exactly match up. These opportunities are more frequent at cryptocurrency markets. The trader would exchange an amount at one rate (Currency_B/Currency_A), convert it again (Currency_C/Currency_B) and then convert it finally back to the original (Currency_C/Currency_A), and assuming low transaction costs, net a profit.
Example:
As per standard inputs, the trader would use US dollars to buy BTC (BITFINEX:BTCUSD), use BTC to buy NEO (BITFINEX:NEOBTC), use NEO to buy US dollars back (BITFINEX:NEOUSD). Whenever the quantity of US dollars bought back is higher than 1% from the initial amount, the indicator will send an alert signaling an arbitrage possibility.
Disclaimer: triangular arbitrage requires advanced automation tools and is only possible if there is enough liquidity to quickly execute all 3 trades at prices used on the indicator.
Inputs
Symbol 1
Symbol input. First step currency to initiate triangular arbitrage. (Currency_B/Currency_A)
Symbol 2
Symbol input. Second step currency to continue triangular arbitrage. (Currency_C/Currency_B)
Symbol 3
Symbol input. Final step currency to finalize triangular arbitrage. (Currency_C/Currency_A)
Discrepancy %
Float input. Amount in percent of profit return after triangular arbitrage is finished. Transaction fees not included.
To get access to this and other scripts check links below.

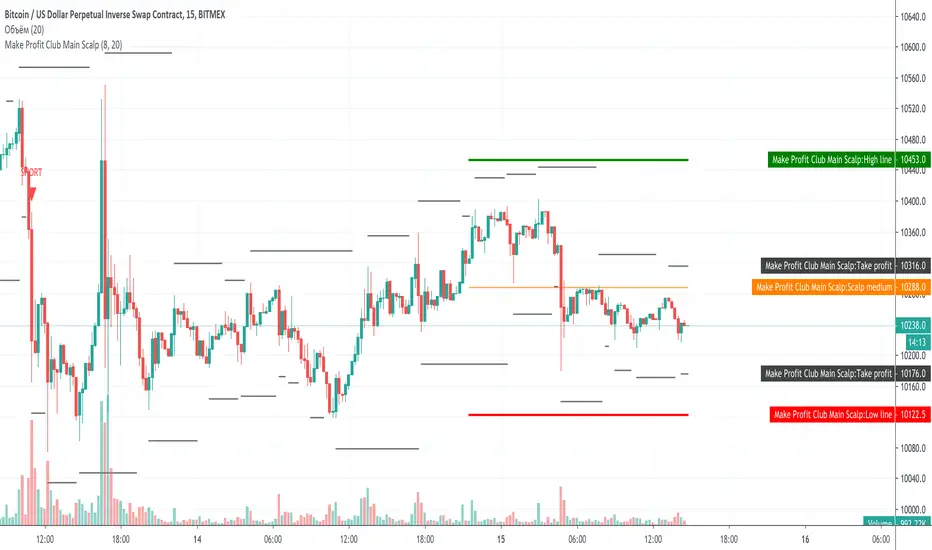
Make Profit Club Main ScalpThe main scalping indicator.
We use this indicator to trade for a short time in a TF of 5-15 minutes.
We have created takeprofit zones for you so that you can understand where we can get to and take your profit. these points are mostly very helpful.
There are basic settings that allow you to adjust the indicator individually for each situation; because of this, this indicator can be used for any exchange and any currency pair.
For Scalp trading, we use 3 different strategies available to our clients. If you enter them correctly, you can never see the minus sign.
Use the link below to obtain access to this indicator.
Study for Squeeze Momentum Indicator [LazyBear]This study is based on LazyBear Squeeze Momentum Indicator and my strategy developed using it.
I added some custom feature and filters.
Main improvements are:
1- study is updated to version 4 of pine script;
2- I added alerts for entry rules and exit rules.
3- Alert syntax can be customized for webhooks: I added one example only for long entry.
You can customize a lot of features to get a profitable strategy.
Here is a link to original study.
Please use comment section for any feedback.

[ALL-IN-ONE] Algorithmic S/R and Pivots and Long Term LevelsHello my trading padawans.
Hope you're all having a blast
Here's the invite-only script of the week. The ALL-IN-ONE saga continues with another script.
This time, I compiled a lot of algorithmic supports and resistances (S/R) - to be used with any indicators out there.
Those S/R are universal and work with all asset classes (FOREX, CRYPTO, INDICES, STOCKS, COMMODITIES, ...)
No one can predicts which S/R will stop a move - generally - the high timeframes S/R + the SMAs with a big input value - work as strong walls often forcing the candles to retrace a bit short-term.
At Today's post (October, 25th 2019 - 12 pm UTC-4), we see how useful they were, to identify how high BTC/USD could go before retracing.
I. 💎 SCRIPTS ACCESS 💎
1.🖐️ Access can only be requested through my website.
2.🖐️ My website URL is in this script signature at the very bottom (you'll have to scroll down a bit and going past the long description) and in my profile status available here : Daveatt
3.🖐️ A tutorial article/video will be provided on those sub mentioned links + Tradingview
4.🖐️ You obviously can contact me directly for more information
II. 🔎 ALL-IN-ONE Supports and Resistances 🔎
You can display the algorithmic S/R, and/or pivots, (not finished yet) and the long terms levels.
For the 3 types of S/R, I pre-selected those that I think are the most relevant and useful for everyone. Please let me know if you'd like me to add/remove some.
All those listed by default are important and provide a MAP for a trader.
They give great take profits zones, levels where it's better to wait for a pullback before entering.
2.1 👁️🗨️ S/R mode 👁️🗨️
Each type of S/R can be displayed or not.
2.2 📱 Mobile optimized display 📱
Preview : imgur.com I posted 2 images there
The script is made using the newest version of Pinescript, and displaying small labels for every support/resistance.
✨ This will come in handy for mobile users - they'll get nice looking labels displayed at the right of their chart.
Each S/R type have its own labels and label position. The script users can activate/deactivate them at will
Let's review quickly each one.
2.3 Algorithmic SMAs
I cherish, love, sometimes despite them, but they're very relevant for all asset classes. The tool displays as many relevant algorithmic and generic SMAs that I could think of.
The indicator lists about 18 different SMAs in multiple timeframes.
2.4 Pivots
7 pivots are displayed (S1/S2/S3/P/R1/R2/R3)
You can choose one of 4 pivot point types:
- Traditional
- Woodie
- Fibonacci
- Camarilla.
The fun doesn't stop here. You can also select a timeframe between Daily/Weekly/Monthly/Yearly for those pivots.
For INDICES, for example, I use a lot the daily Traditional Pivots.
2.5 Long Terms Levels
Display by default the highest/lowest weekly/monthly/quarterly/monthly levels.
The scripts user can chose to select the previous highest/lowest also.
-------------------------------------------------------------------------------------------------------------------------------------
If you have any doubts or questions, please hit me up directly or ask in the comments section of this script.
I'll never claim I have the best trading methodology or indicators.
You only will judge and I'll appreciate all the questions and feedback you're sending my way.
They helped me a ton for developing indicators based on all the requests I received.
May the force 💪 be with you all 🥳.
Dave

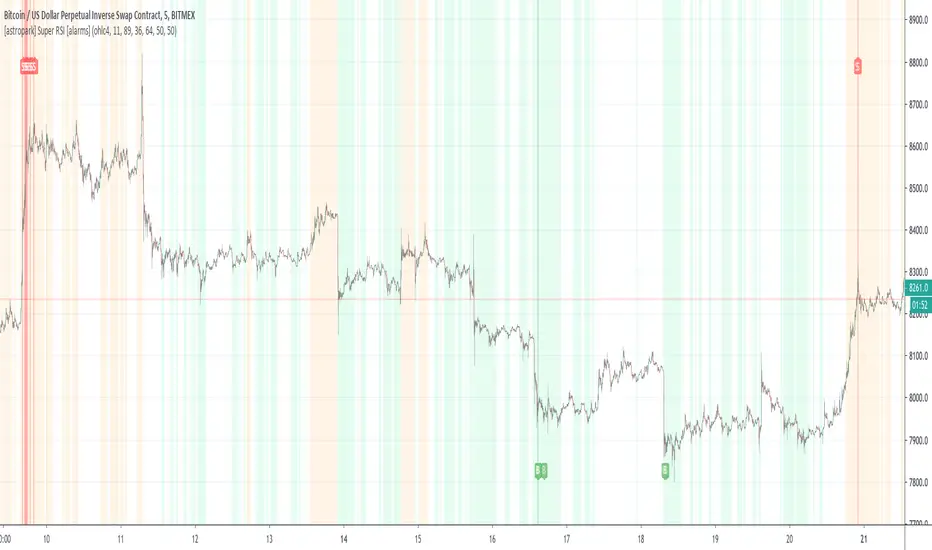
[astropark] Super RSI [alarms]Dear Followers,
today a new Scalper Tool , which works great on 3 minutes and 5 minutes timeframes , but also down to 1m and up to 30m!
I called it " Super RSI ", as it is based on RSI and inherits some basic functionality from it.
If you check its settings, you will see that you can have 3 different buy-sell sources (first two are active by default):
STRONG BUY/SELL : buy when white area deeply falls into oversold-red zone and sell when white area gets into overbought-green zone (you can set and edit at which level oversold and overbought zones start);
CROSSES : buy when the black RSI line in the middle between red and green area cross under the buy cross limit value and sell when it crosso over the sell cross limit value (you can set and edit specific cross ranges for both buy and sell);
WEAK BUY/SELL : buy when green area at least go below 50 level and sell when red area at least goes above 50 level (you can edit both levels); these conditions are highlighted as background color and are very useful for taking (at least partial) profits in trades.
By default the script will be placed as overlay on the chart, but
> you can activate the oscillator plot by disabling the "hide all plot" option
> and place it in a below pane by clicking on the black arrow at then end on the indicator name in chart and selecting "move to -> a new pane below"
This strategy can trigger till 10 buy or 10 sell signals in a row before reverting, so use a proper money management .
Strategy results are calculated on 20 trading days using 1000$ as initial capital and working at 10x leverage.
The user who wants to use this strategy, especially via an automated bot, must always set a stoploss at 3-5% from entry point or use a proper risk management strategy .
This is not the "Holy Grail", so use it with caution.
This script will let you set all notifications you may need in order to be alerted on each triggered signals.
The backtesting script version of this indicator, which will let you backtest this script and find best settings for your preferred market, can be found here below:
This is a premium indicator , so send me a private message in order to get access to this script .
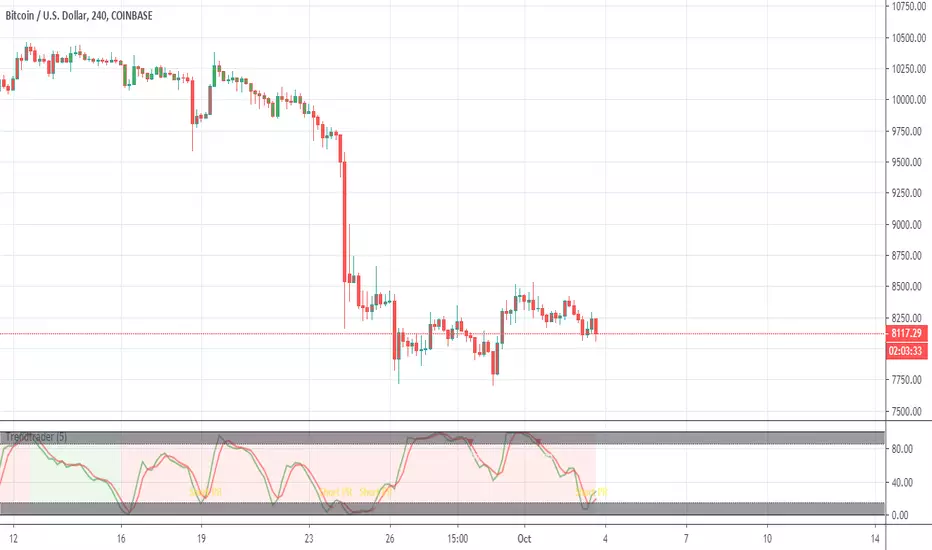
Trendtrader with profit/rentry==Strategy==
Adjust trend code until the majority of the up-trends are green and the downtrends are red. Take 20% profits at the first and second take profit levels while leaving the rest of the trade in until close.
==Indicator includes==
EMA cross, trend analysis, stoc-RSI TP and re-entries.
==Credits==
Trade Indicators for the strategy, jhanson107, for the trend indicator, and Zekis for helping with the TP and re-entries.
Ori Bitcoin Mining ProfitabilityThis indicator shows Mining Profitability USD/Day for 1 THash/s. Have options to toggle line/trend view, log on/off and smoothing for line view.

MarketSpy XMarketSpy trading suite was designed to sniff out momentum swings and allow you to profit riding the wave. No matter what market, no matter the timeframe - this is all you need, from here on out this is your trading desk.
It's made up of three main components (with future add-ons in development):
1. MarketSpy X - the ultimate entry and exit tool that is built using custom momentum algorithm to find exact moments of reversals - without a fail. It's the one on the bottom with "green pulse dot" buy signals and "blood diamond" sell indicators.
2. MarketSpy ARmageddon (Augmented Reality) - price action overlay that analyses trends and is a confirmation tool for MarketSpy X. Can show confluence from top 5 market indicators, gives signals of reversals or chop zones, predicts prices(!) and is fully dynamic that reacts to market conditions LIVE.
3. MarketSpy S/R - This thing sniffs out and draws support and resistance based on math, not human eye. This means that MarketSpy effectively can go head to head with bots and algorithms and see right through the market to give you incredibly accurate points of interest where machines and humans sell and buy - ride the way together with the whales. Sounds cliche until you try it.
For more - visit our discord.

What is ProfitableBTC, BNB or your favorite Alt Coin? This indicator shows what is profitable at the moment. Red bars are alt days, green bars are BTC days. Otherwise, it is a BNB day.
Hmm, most of the time it is a BNB day!

Ingenious SMA CrossoverIntroduction
A popular use for moving averages is to develop simple trading systems based on moving average crossovers. A trading system using two moving averages would give a buy signal when the shorter (faster) moving average advances above the longer (slower) moving average. A sell signal would be given when the shorter moving average crosses below the longer moving average. The speed of the systems and the number of signals generated will depend on the period of the moving averages.
What is this tool?
This tool is a crossover system of two simple moving averages. I called it "Ingenious" because it uses a decision tree-based algorithm under the hood to find and plot the most profitable SMA combination.
It analyzes the range of periods between 4 to 45 and backtests each combination across the entire history of an instrument. If the more profitable periods were detected the indicator will switch periods of the moving averages to the found ones immediately.
NOTE : It does not change what has already been plotted.
Good luck!

Most Profitable HelloEpicWorld v2.0[Eric] This is the most profitable un-repaint fully support auto trading Algo on earth.
Usage:
Buy and Sell && Stop Loss
1. When it shows buy, you can buy it immediately or wait for a small dump to buy it, stop loss at the red cross below.(Both buy and stop signal support alert autoview bots auto trading)
2. When it shows sell, you can sell it immediately or wait for a small pump to sell it, stop loss at the green cross above.(Both buy and stop signal support alert autoview bots auto trading)
Background Color:
It can be turn on and off in the settings. When it is green, you have a 78% probability to get a win trade on buying the pullback. And a 73% probability to get a win trade on selling the pullback when it's red. So, even missed the buy and sell signal, you can still open a trade in the middle, but I don't recommend this kind of trades, it's no good for Risk/Reward ratio. The best ratio is when the signal show up. Background color is more suitable using to hold your trades after entering.
Forex:
Bitcoin:
Altcoin:
MarketSpeed:
RSIC:

[THE MECHANIC] : Buy small and continuously, profit trailThis script is entirely my own original work.
The script is intended for USDT crypto trades. It's hypothesis is that Alts usually go where BTC goes. So, this script considers indicators on a USDT paired ALT, and simultaneously considers BTC's USD movement to make a buy decision. The exact combination of indicators will not be disclosed.
It does not intend to seek the bottom AT ALL. It intends to buy early in upswings. Using profit trailing on a tool such as Gunbot, consistent profits of 2% to 5% is possible. Hourly charts or longer are recommended.
A stop loss is an absolute necessity, but can be set quite tightly because of the stated hypothesis.
Script access is controlled only because it is my terms of use that users provide feedback on their experience and make recommendations for improvement.

-- Simple and Profitable Cryptocurrency Trading Strategy --Script based on this strategy:
Based on 8EMA Close and Open with Weis Wave Volume by Lazybear indicator.
The script will let you know when to Long or Short the market.

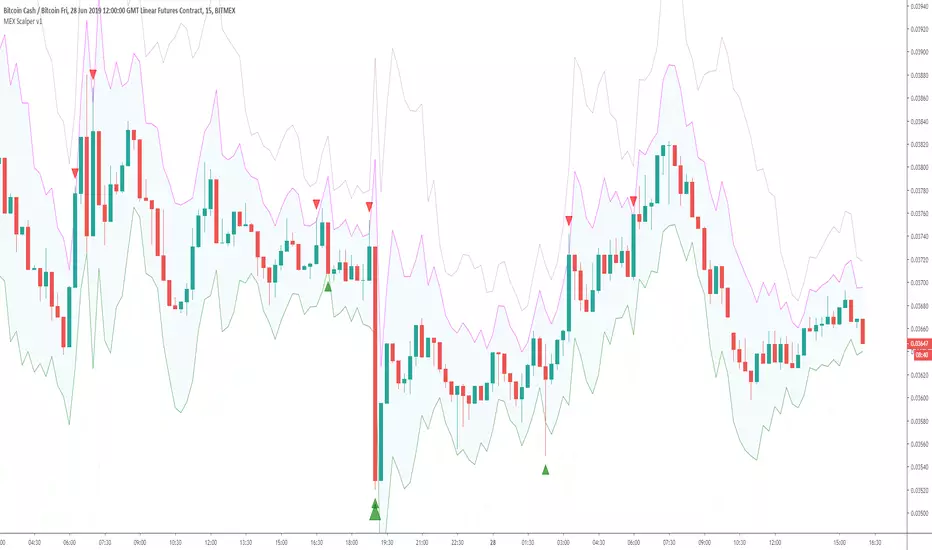
BitMEX Profit Scalper v1I keep getting asked to create a script for Scalping on BitMEX so here is the initial version!
Default settings created for XBTUSD 15m and designed for getting decent profits when using around a 10x margin.
Settings can be tweaked so you can alter this for any time frame
ACCESS For CryptoProTools.com members only!! (Visit our website if you wish to sign up)