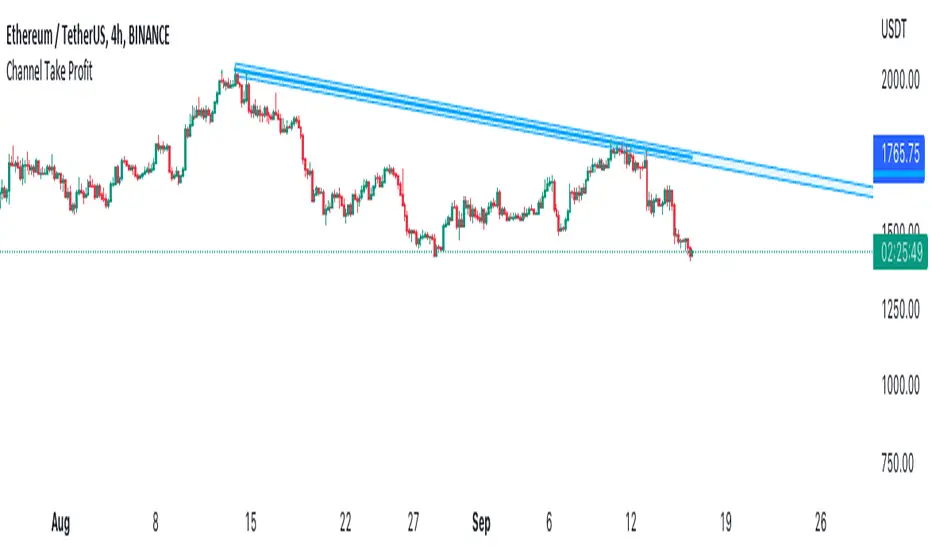
Channel Take Profit Tool for AlertatronWhat is this for
This tool is designed as a companion to an automated strategy running on Alertatron. Sometimes when a strategy opens a trade, you decide that based on TA you would like to close all or or a portion of your trade at a support or resistance level. The strategy may already be programmed to take profit but this tool allows you to add additional take profit criteria that can trigger an alert to Alertatron if it happens before the strategy closes.
How to use it
When you add the indicator to your chart, it will ask you to select two points on the chart. These two points will be connected by a line and create the parallel channel that will be used for triggering a take profit alert. The offset is how wide you want the channel to be. When the high or low of a candle enters the channel from either direction, the alert will be fired. AFTER you add the indicator to the chart and configure ALL of the settings, you need to create an alert on the indicator for "All Alert Functions" and paste your incoming alert webhook from Alertatron into the webhook input.
Alertatron Setup
You will need to provide the API name that you have configured in Alertatron that matches the account the trade is open in. This tool supports ByBit and FTX.us by may work with other exchanges too (this option just chooses which currency/pair divider is used in the alert message).
在腳本中搜尋"profit"
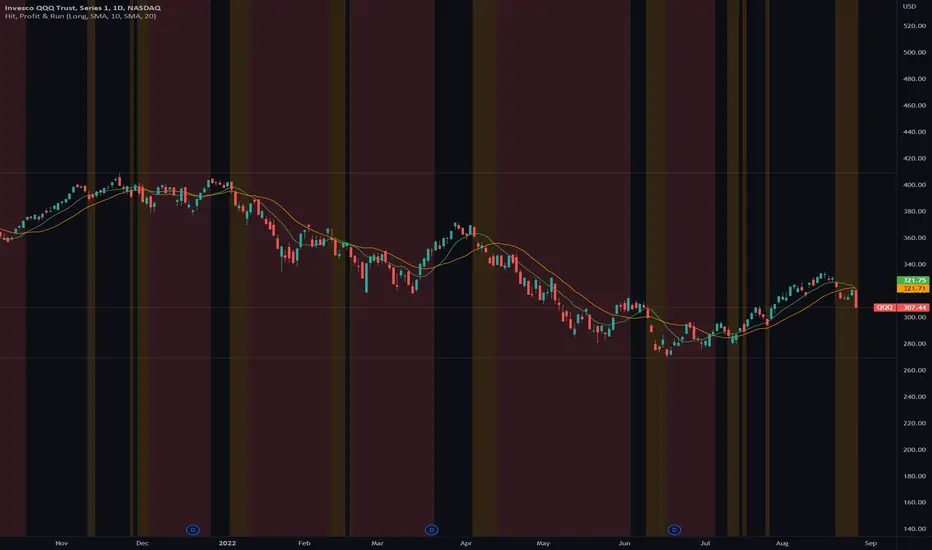
Hit, Profit & RunThis indicator helps traders to identify up-/down trends and see early warning signs when a stock or an index changes its current trend.
With a fast and a slow moving average the trader can define a moving average combo that starts an uptrend when the fast moving average line moves above the slow moving average line and ends its uptrend, when the fast moving average line goes below the slow moving average.
The trader can define a background color for the uptrend and downtrend as well as a take profit zone that is generated, when the price falls below the fast moving average line. With a short and long mode the colors and take profit zones change accordingly.
Market based maximum exposure PT rules:
■ Fast MA > Slow MA = Hit Area (no color)
■ Price < Fast MA = Take Profit Area (yellow color)
■ Fast MA < Slow MA = Run Area (red color)
Features
■ Use SMA or EMA crossovers
■ Define the length of the fast and short MA
■ Plot the fast and short MA
■ Switch between Long or Short mode
■ Hide or show the areas of your choice
■ Multipe customize options
Grid Settings & MMThis script is designed to help you plan your grid trading or when averaging your position in the spot market.
The script has a small error (due to the simplification of the code), it does not take into account the size of the commission.
You can set any values on all parameters on any timeframe, except for the number of orders in the grid (from 2 to 5).
The usage algorithm is quite simple:
1. Connect the script
2. Install a Fibo grid on the chart - optional (settings at the bottom of the description)
3.On the selected pair, determine the HighPrice & LowPrice levels and insert their values
4.Evaluate grid data (levels, estimated profit ’%’, possible profit ‘$’...)
And it's all)
Block of variables for calculating grid and MM parameters
Variables used regularly
--- HighPrice and LowPrice - constant update when changing pairs
--- Deposit - deposit amount - periodically set the actual amount
Variables that do not require permanent changes
--- Grids - set the planned number of grids, default 5
--- Steps - the planned number of orders in the grid, by default 5
--- C_Order - coefficient of increasing the size of orders in the base coin, by default 1.2
--- C_Price - trading levels offset coefficient, default 1.1
--- FirstLevel - location of the first buy level, default 0.5
--- Back_HL - number of candles back, default 150
*** For C_Order and C_Price variables, the value 1 means the same order size and the same distance between buy levels.
The fibo grid is used for visualization, you can do without it, ! it is not tied to the script code !
You can calculate the levels of the Fibo grid using the formula:
(level price - minimum price) / (maximum price - minimum price)
For default values, grid levels are as follows:
1 ... 0.5
2...0.359
3 ... 0.211
4...0.0564
5...-0.1043
Short description:
in the upper right corner
--- indicator of the price movement for the last 150 candles, in % !!! there is no task here to "catch" the peak values - only a relative estimate.
in the upper left corner
--- total amount of the deposit
--- the planned number of grids
--- “cost” of one grid
--- the size of the estimated profit depending on the specified HighPrice & LowPrice
in the lower left corner
--- Buy - price levels for buy orders
--- Amount - the number of purchased coins in the corresponding order
--- Sell - levels of profit taking by the sum of market orders in the grid
--- $$$ - the sum of all orders in the grid, taking into account the last active order
--- TP - profit amount by the amount of orders in the grid

Position Sizing CalculatorThis is an intuitive risk management tool with a minimalist design.
This calculator will determine your position size per trade, profit, loss, risk/reward ratio and leverage if any.
It will calculate your leverage if you are trading financial instruments e.g. Mini Futures , Turbo Warrants etc. that have a financing level.
Tip: Use this as a complement to the Long/Short Position tool.
Provide the following inputs to get a calculation:
- Position type
- Account balance
- Risk per trade percentage
- Financing level (if any for leveraged instruments), else let it be 0
- Entry price
- Target price
- Stopp loss price
You can also choose the color of the output text, its background and position in the chart window.
Enjoy!

Bias Pivot PointA simple indicator that uses Pivot Points as a filter and to generate a Directional Bias .
How to use this indicator?
1. Directional Bias
Bullish => Closing Price > Pivot Point
Bearish => Closing Price < Pivot Point
2. Support / Resistance
Each Pivot Points can be used as Support or Resistance
3. Take Profit Targets
Each Pivot Points can be used as targets for taking profit

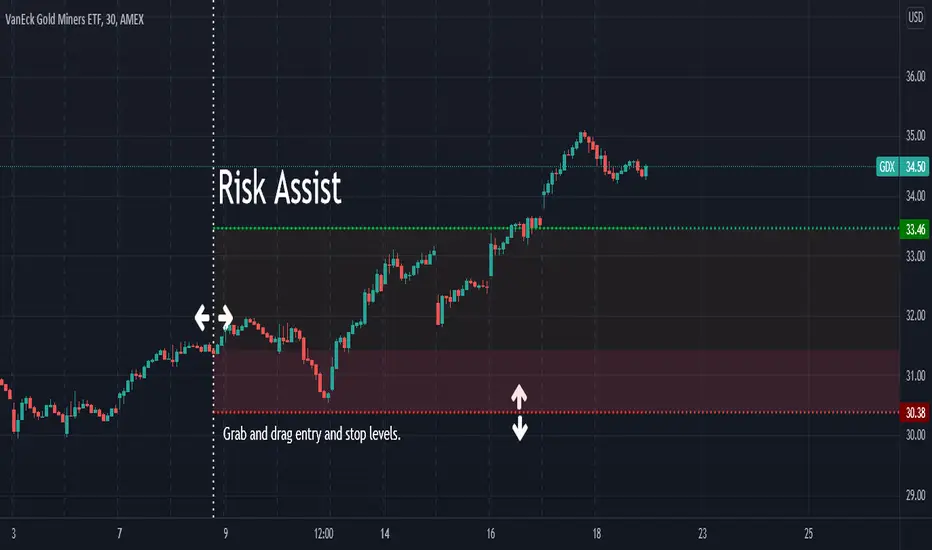
Risk AssistAs the profit level increases, the amount of profit taking required to avoid risk asymptotically reaches zero.
This indicator displays the % of the established position required to exit in order to ensure the trade is not a loss if the stop is hit.
Values in green (at or below 100%) indicate a winning position.
Values in red (above 100%) indicate a losing position.
Alert Examples:
If you are intent on "selling half" to avoid risk, you can set an alert on the value of this indicator for 50.
If you are intent on "selling a 3rd" to avoid risk, you can set an alert on the value of this indicator for 33.3.
Pattern Recognition Pullback Strategy profit calculatorThis script has been designed for use in botting Crypto spot / futures.
The intended use is send signals to a 3commas bot setup for the exchange. The bot uses candle measuring percentile nearest rank filters and range
breakouts to decide if the market is trending. When the market is trending it will look for pullbacks below a moving average and buy in the trend direction on a pullback discount. This is the profit calculator part of the script
With this script you will not be able to send tradingview signals, that is because it is a payed premium service and for security reasons I am the only one with access to making signals from this script.
I provided a user manual:
drive.google.com

MBYLab_Max Profit & Draw DownThis indicator can check the MDD of the stock price for the set period, and is a secondary indicator that shows the highest return (increase rate) from the newly updated low.
In Loss mode, the red line shows the MDD based on the closing price of each candle, and the black line shows the historical MDD .
If the MDD for each closing price reaches 0%, it means that continuous profit is in progress, and when the stock price breaks out of this trend, it can be seen that correction by overbought begins.
In Profit mode, the green line shows the rate of return against the newly updated lowest price, and the blue line shows the rate of return per candle.
This rate of return can be applied as the rate of share price increase,
Comparing the above two values will help you determine how healthy the stock is.
"May the Bit be with You."

FX Profit CalculatorWith this indicator, you will be able to see how much you earn in forex in dollar terms.
It asks you 3 things when adding the indicator.
TP point
SL point
Position Entry point
If you have selected the TP point above, the entry zone below it, and the SL point below it, the indicator will automatically understand that there is a BUY order and will make the calculations accordingly.
The same is true for the opposite.
When you use the indicator in any parity, you will have problems switching to other parities.
So either use it only in one parity, or update your targets from the indicator settings at every parity change.
You will get the same error if:
Your trading entry point should be between your TP and SL points. If you do not set it this way, the indicator will warn that please fix it.
If you are in the trade, tick the settings and show the dollar-based profit of your position according to the instant closing price.
The percentage variable works like this:
When you adjust for one parity, shifts occur in the chart when you switch to the other parity. When switching to non-circulating graphics at the same prices, the user is prompted to re-enter so that the graphic does not deteriorate.
BONUS : You can move these lines up and down with your mouse on the graphic :)

EMA 200 + Parabolic SAR + RSI + Take Profit Stop Loss By NussaraThe Parabolic SAR is a technical indicator developed by J. Welles Wilder to determine the direction that an asset is moving. The indicator is also referred to as a stop and reverse system, which is abbreviated as SAR . It aims to identify potential reversals in the price movement of traded assets.
EMA 200 ( Exponential Moving Average ) is important because it determines the overall trend, filters a trading system, and reacts faster than the 200 MA.
The relative strength index ( RSI ) is a technical indicator used in the analysis of financial markets. It is intended to chart the current and historical strength or weakness of a stock or market based on the closing prices of a recent trading period. RSI movement above 50 indicates that more traders are buying assets than selling, and are driving the price up. If the RSI moves below 50, it shows that more traders are selling than buying, and are driving the price down.
This indicator uses EMA 200, RSI and parabolic SARS.
The order will be entered when 3 conditions are true
1. First reverse point uptrend of Parabolic SAR
2. The price is close above EMA 200
3. RSI is over 50.
This indicator has a function to take profit and stop loss level.
Stop loss level = First reverse point uptrend of Parabolic SAR .
Take profit level = 1:1.5
This indicator is just a tool for technical analysis . It shouldn't be used as the only indication of trade because it causes you to lose your money. You should use other indicators to analyze together.

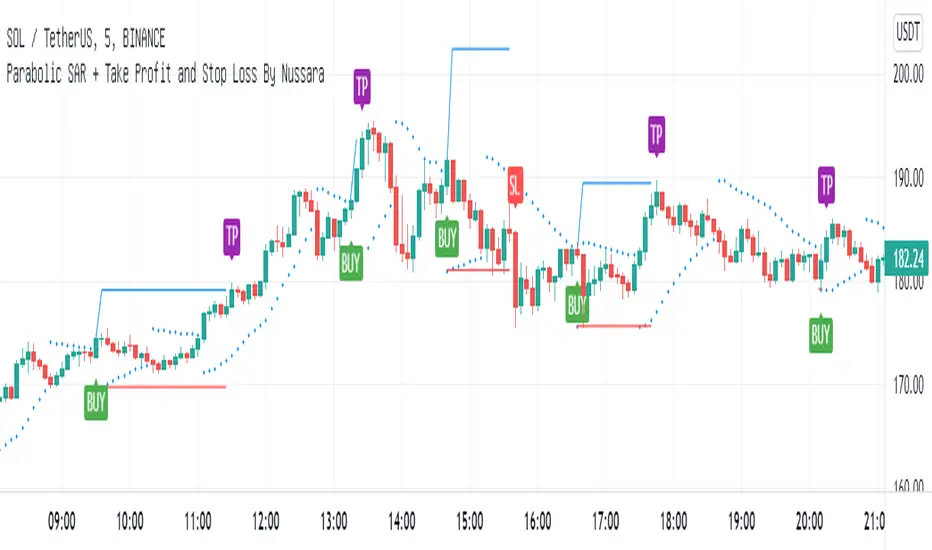
Parabolic SAR + Take Profit and Stop Loss By NussaraThis strategy uses Parabolic SAR. The Parabolic SAR is a technical indicator developed by J. Welles Wilder to determine the direction that an asset is moving. The indicator is also referred to as a stop and reverse system, which is abbreviated as SAR. It aims to identify potential reversals in the price movement of traded assets.
This indicator has a function to take profit and stop loss level.
Stop loss level = First reverse point of uptrend
Take profit level = Entry price + (Entry price-Stop loss level)
User can set a parabolic SARS and a profit point but I fixed stop loss level at first reversals point of uptrend. I also put alert for Buy, Sell, Stop Loss in this indicator.
This indicator is just a tool for technical analysis. It shouldn't be used as the only indication of trade because it causes you to lose your money. You should use other indicators to analyze together.
Smart AlertsThis indicator provides back-tested signals and alerts from multiple technical indicators.
No more guessing whether or not you should trust an indicator. See your indicators' past performance at a glance.
No more false alarms. Disable re-painting of signals.
When multiple indicators overlap, a Confluence indicator will print (large triangle). With your settings properly tuned, this will show a HIGH probability of a move.
Current Signal/Alert Options (more to come):
RSI Oversold
RSI Overbought
EMA Crossing Up
EMA Crossing Down
Buy Signal Confluence
Sell Signal Confluence
Instructions:
-Enable/disable individual indicators so you can fine tune one at a time
-Adjust the indicator's settings
-Adjust your trade parameters (Max Wait, Take Profit %). Signals that would have given the desired profit in the time allowed will be painted orange.
-Repeat this process with each indicator until you're satisfied
-Set-up alerts

CRYPTOPRODear traders,
Welcome to CRYPTOPRO indicator. Only for crypto markets! This is an invite only script, please PM me to request permission for testing and access.
This indicator is developed as a scalping, intraday or swingtrade strategy.
Been working on indicators for years now, now back to trading again and made the best possible indicator for different timeframes.
The indicator uses market data, multiple timeframe ma/rsi charts and price action for determining a long or short strategy.
The indicator does not repaint!
I have made the indicator as easy as possible to use with added background colors.
How to use:
- Long strategy: when background turns to green after bar closing.
- Short strategy: when background turns to red after bar closing.
Alerts:
- Alerts are included in the indicator and are very simple to use.
- Alert "buy" for long strategy (green background)
- Alert "sell" for short strategy (red background)
- The alerts can also be used for automated trading/bot trading.
Time Frames :
- Can be used for all different timeframes.
Chart candles:
- Indicator is to be used with standard prince candles.
Note:
- Trading and financial markets are always risky and unpredictable.
- All trades made based on this indicator and his results are always your own responsibility.
- As an author i will not be held responsible for any of your trading profit or loss. Always be cautious when trading.
Charts can be applied to all TV supported crypto charts.
If you find the indicator usefull share your support and feedback in the comments.
Any questions PM me for more info.Thank you!
DISCLAIMER:
No sharing, copying, reselling, or any other forms of use are authorized for our scripts / strategy, and the information published with them.
This script / strategy is strictly for individual use.
This is not financial or investment advice. Investments are always made at your own risk and are based on your personal judgement.
NYTRADE is not responsible for any losses you may incur. Please trade wisely.


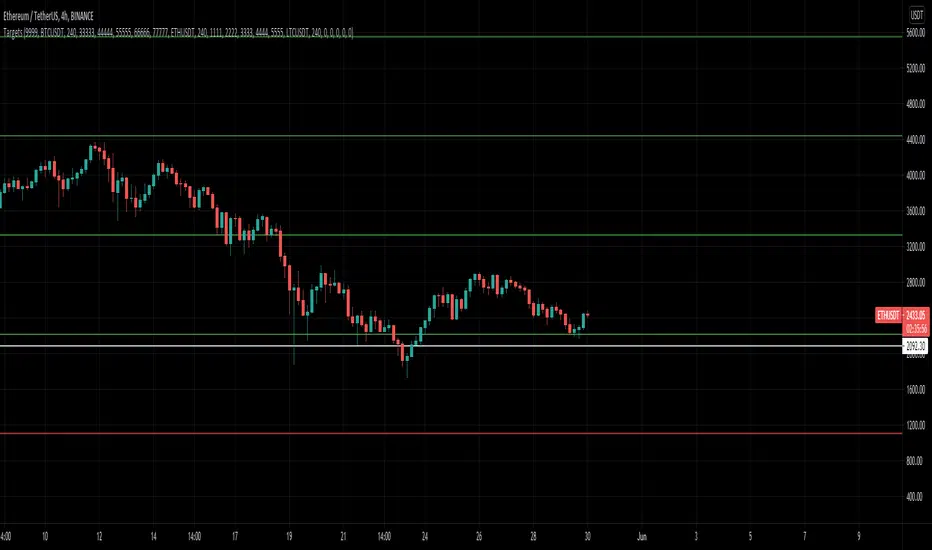
MultiAlert, MultiTargets + TickersThis is my first script, completely made from scratch. Bear with me.
Script that allows one to set an alert for Multiple Price Levels, on Multiple Tickers, complete with Dynamic Messages showing you which ticker, at which price, at which alert (Stop loss, Target 1 etc.), set to Once Per Bar.
Select Ticker, type in price levels that you have for targets & stop loss, move on to the next, or don't and leave 0 and blank.
Disable the targets you do not need in STYLE tab to disable plotting & scaling, leave unused tickers & targets blank & 0.
Create Alert, select this indicator, anyfunction() alert.
MAKE SURE to remake the alert every time you change something, they are not smart enough to change as you change things. Can Confirm by using the numbers in the alert name. You will also have to set the profit level or stop loss to zero every time it triggers to avoid triggered again.
In fact, you do not need the indicator active at all. Add it to a chart and hide it by clicking on the little eyeball icon, to make an alert open the settings for the indicator and type in your targets like normal. Indicator will remain invisable.
I have not found a way to dynamic message the alert name, or else I would.
DISCLAIMER: NONE OF THIS IS FINANCIAL ADVICE. You are completely responsible for whatever happens to you. Do not use the targets in this chart. Do your own research before trading.
Peak Profit v2 (Reversal Points & High/Low Waveform)This script includes two different methods of indication.
It includes a High/Low Waveform . It is a technical indicator that is best performed when using a trailing stop, it also works well as a trend line.
Trade with caution however the general idea is to buy when line turns green, and sell when the line turns red.
This can be disabled by clicking the checkmark in the visual settings of the script.
Second Feature is an indicator for Reversal points . These show a price to "enter long" and "take profit"
This part of the script looks for a series of consecutive closes greater than or less four closing price bars to define an underlying uptrend or downtrend.
In general, minor price reversals are associated with the completion of the trend and major market turning points are identified by the completion of a trend of a specific series of bar openings/closes.
As always, this script should not be relied upon alone for your sole indication of buying and selling. Use your own intuition and other indicators along with this one for the best results.

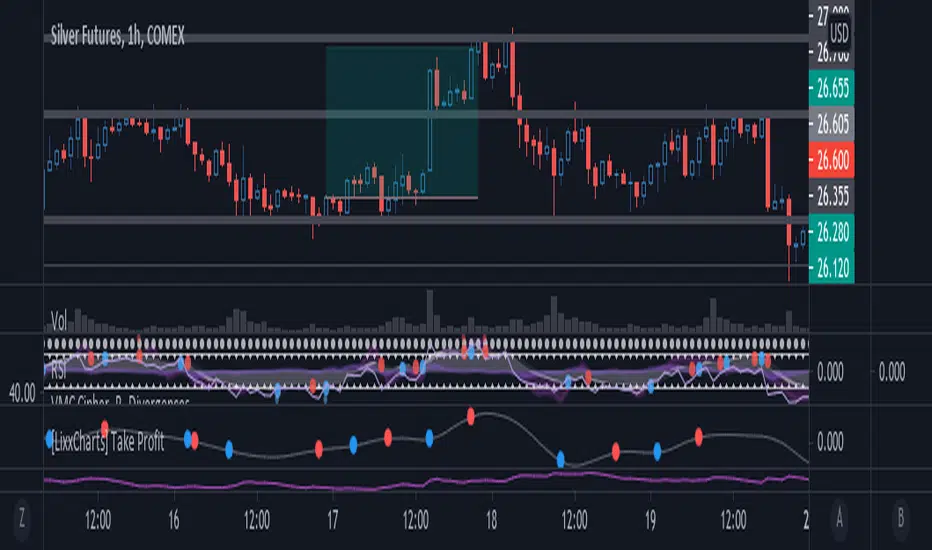
[Lixx] MESA(EMA/SMA) and ROC(ROC/MESA) Take Profit TriggersThis script uses the MESA EMA and SMA as well as the ROC/MESA cross to help find the take profit areas when trading divergences using market cipher or wavetrend. It is inspired by jordanfungs MESA indicator, however this one is different because it is not lagging in the signals.
Hope you enjoy it, and make sure to backtest any strategy before you use it.
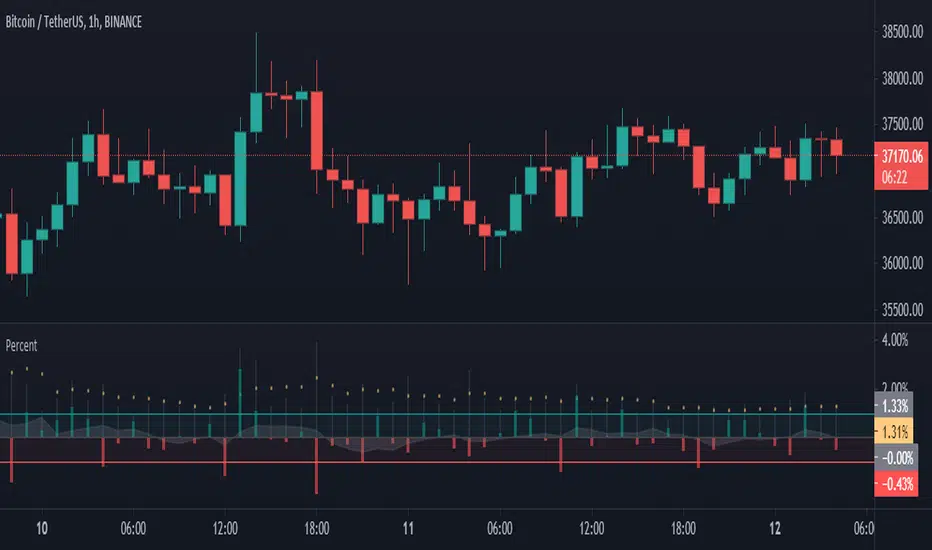
Percentage of Price ProfitThis indicator shows the percentage change in the price per candle, In this way, you will be aware of the amount of profit in the desired time period.
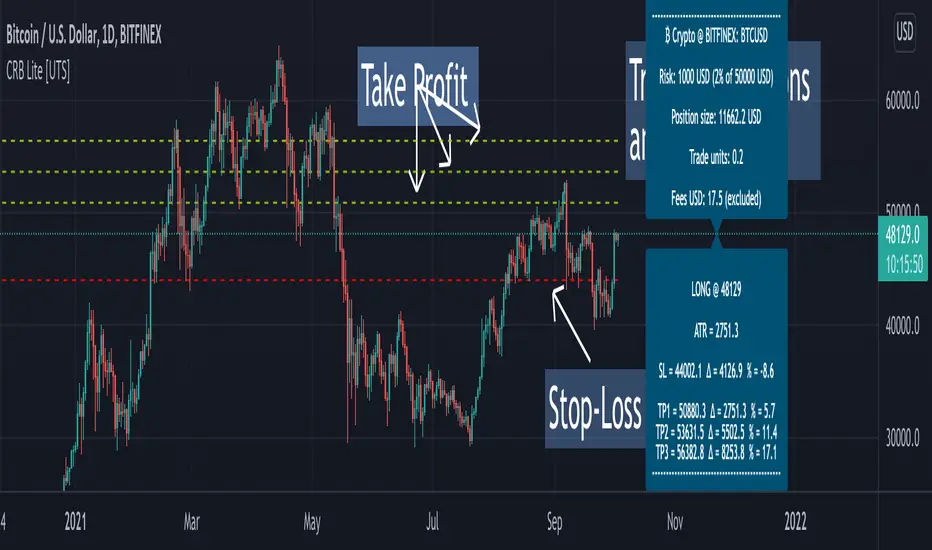
Crypto Risk Buddy - Lite: Position Size, SL & TP System [UTS]
Crypto Risk Buddy - Lite
Position Size, Stop Loss & Take Profit System
The ultimate system to calculate trading risk on crypto assets.
The 'Lite' version is limited to BTC as base currency.
₿ Cyptocurrencies
Position Sizing
De-risk possible drawdown by calculating a proper position size.
Define your risk percent based on your net value
Freely define your account currency
Trade any asset by the customizable Base / Quote currency factor
Calculate trading fees
Show all information on a customizable data screen
Stop Loss
Minimize trade risk by calculating your stop-loss.
Percent, Value and Delta display from current price
ATR based (Average True Range, modifiable)
Custom SL value possible
Adjustable
Two visual representations on chart
Automatically and real-time calculated on screen
Take Profit
Multiple take-profit levels to ensure not giving back to the market.
Up to 3 take profit levels to define
ATR based (Average True Range, modifiable)
Custom TP values possible
Easily customizable
Two visual representations on chart
Automatically and real-time calculated on screen
Currencies
Choose an account currency and calculate your risk for every trading pair.
USD
EUR
GBP
AUD
CAD
CHF
HKD
JPY
NOK
NZD
RUB
SEK
SGD
TRY
ZAR
BTC (crypto)
ETH (crypto)
USDT (crypto)
BUSD (crypto)
USDC (crypto)
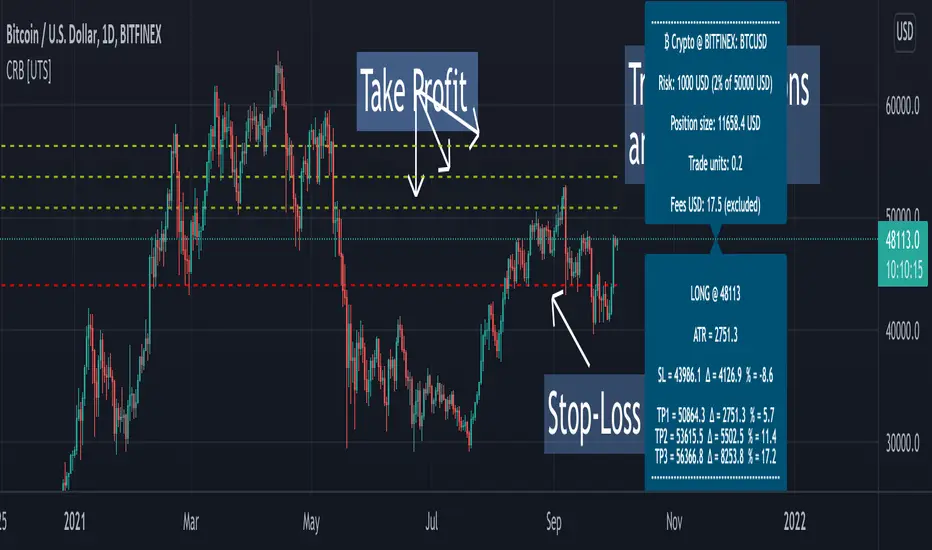
Crypto Risk Buddy: Position Size, SL & TP System [UTS]
Crypto Risk Buddy
Position Size, Stop Loss & Take Profit System
The ultimate system to calculate trading risk on crypto assets.
₿ Cyptocurrencies
Position Sizing
De-risk possible drawdown by calculating a proper position size.
Define your risk percent based on your net value
Freely define your account currency
Trade any asset by the customizable Base / Quote currency factor
Calculate trading fees
Show all information on a customizable data screen
Stop Loss
Minimize trade risk by calculatig your stop-loss.
Percent, Value and Delta display from current price
ATR based (Average True Range, modifiable)
Custom SL value possible
Adjustable
Two visual representations on chart
Automatically and real-time calculated on screen
Take Profit
Multiple take-profit levels to ensure not giving back to the market.
Up to 3 take profit levels to define
ATR based (Average True Range, modifiable)
Custom TP values possible
Easily customizable
Two visual representations on chart
Automatically and real-time calculated on screen
Currencies
Choose an account currency and calculate your risk for every trading pair.
USD
EUR
GBP
AUD
CAD
CHF
HKD
JPY
NOK
NZD
RUB
SEK
SGD
TRY
ZAR
BTC (crypto)
ETH (crypto)
USDT (crypto)
BUSD (crypto)
USDC (crypto)
PIVOT EDGE - The complete trading setup - LITEIntroduction to the Indicator " PIVOT EDGE - The complete trading setup - LITE "
The Foundation layout for this indicator is based on PIVOT's which are nothing but the most important levels that the price has respected in the past.The values for the pivots are derived from the key attributes of the price in any timeframe such as the OPEN, HIGH, LOW and CLOSE. These define the mood of the price and where it intends to move in relation to the previous range formed.Earlier HIGH - LOW i.e the RANGE indicates the possible movement that a stock can make in the current session and as per the calculated pivots we can possible find out the tentative supports and resistances. In addition to this indicator, It is advisable to use the price action theory which helps in taking a right decision for entries.
This indicator by itself is complete in nature, i.e it guides the user for possible entry levels and the projected targets that we can achieve and also the likely stop loss limit in case the price reverses. So beforehand even before entering into a trade position, the user can ascertain what can be his loss or max profit and then he can chose an optimum position size for favorable results.
The beauty of this Indicator lies in the fact that it can be used for all types of trading like Scalping, Intra day, Swing or Positional and Investments also. It works on all timeframes and across all market segments like EQUITY, COMMODITIES, FUTURES , OPTIONS , FOREX etc.
This indicator can be used for any exchange and any timezone also without any changes or adjustments needed.
Now let us understand the features of this Indicator in detail.
TIMEFRAME - It has options to choose between Day,week and month as timeframe. By default it is set to Day timeframe
DISPLAY MAJOR LEVELS - These are the important support and resistance levels calculated based on the past price data. Most important ones are marked in BOLD RED and BOLD GREEN between which the price tends to move generally.
Apart from these, We have breakout level marked in light green and if price breaks this level we can expect targets upto extended levels and beyond marked in blue.
we also have breakdown level marked in light red and if price breaks this level we can expect targets down up to extended levels and below it marked in blue.
In addition I have coded intermediate target levels that appear in light gray between the extended levels or blue lines. Sometimes when the gap between these targets are huge, price cannot reach the targets and reverses at these intermediate targets. You can use them as targets or trailing stoploss based on your plan
DISPLAY HIDDEN LEVELS - These levels are intermediate supports and resistances that can be used whenever the present day indicated range is very wide. Whenever we have an explosive moments in market the range of that day is very huge and so he next day support and resistance band becomes very wide indicating the sideways movement day within that range. And on those days we can switch on the hidden levels and the price respects these levels and most of the days it is inside this range only.
DISPLAY PREVIOUS HIGH / LOW / CLOSE - I have included Daily / Weekly and monthly levels. It is important to know the earlier highs / lows and close since price respects it very must just like support and resistance.
PEMA - This is an important EMA based indicator which potentially indicates curves of support and resistance during retracements or pullbacks. If the curves are breached then the trend is reversed and the price will tend to move to the next pivots.
VALUE AREA - One of the most important feature of this Indicator is this which is derived from the Volume profile concepts. It indicates the fair value area Indicated by orange band and the upper and lower limits indicated by orange lines. Whenever the price is overvalued or undervalued, it is pushed back to its fair value and we can judge the present price position in relation to the value area and then take position in anticipation of the price reaching its fair value area. This must be coupled with price action for favorable results.
IMPORTANT NOTE : This indicator does not guarantee any favorable results nor protect your from any loss. You own the complete risk of your trades. It is suggested that you use this indicator and do back testing for considerable period to understand how it works the the potential win rate it can give.
If you have any doubts or need any clarifications of assistance in understanding, you can message me and i will try to help.
I will soon try to make a Video and explain the use of this indicator for better clarity and understanding.
Happy and Safe trading - Mohan from PIVOT EDGE

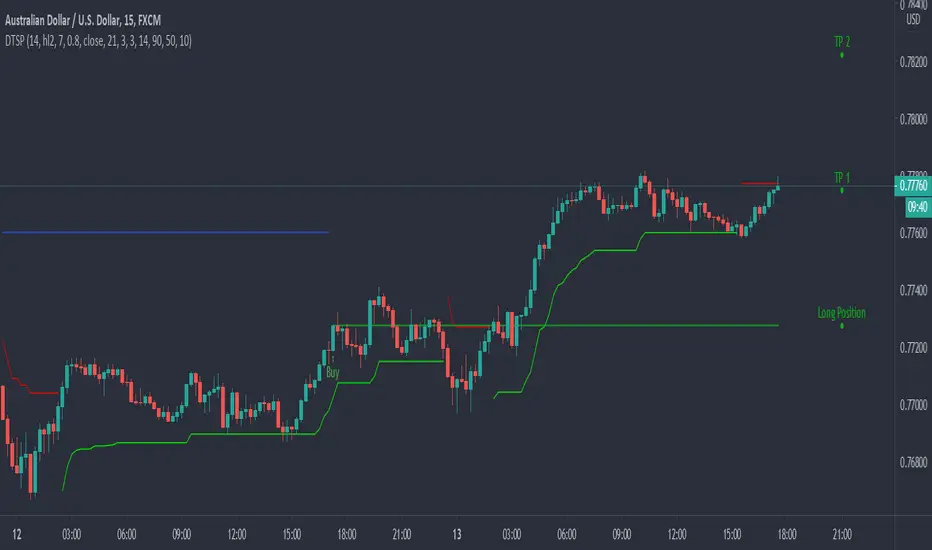
Dynamic Take Profit & Signals (AussieBogan)Dynamic Take Profit & Signals (DTS) help us to dynamically place potential take profit levels. These levels are measured based on standard deviation in conjunction with swing high and low points. Head over to the settings to control your take profit and multiplicative factor setting.
In short, higher values of either setting will return more spread out between tp's. The logic behind using the standard deviation is that a low value of it will return tp closer to where you entered the trade, as such it will have higher chances of the price reaching them.
The Indicator also has alert features for buy and sell so any trader can be aware of every potential signal the indicator produces.
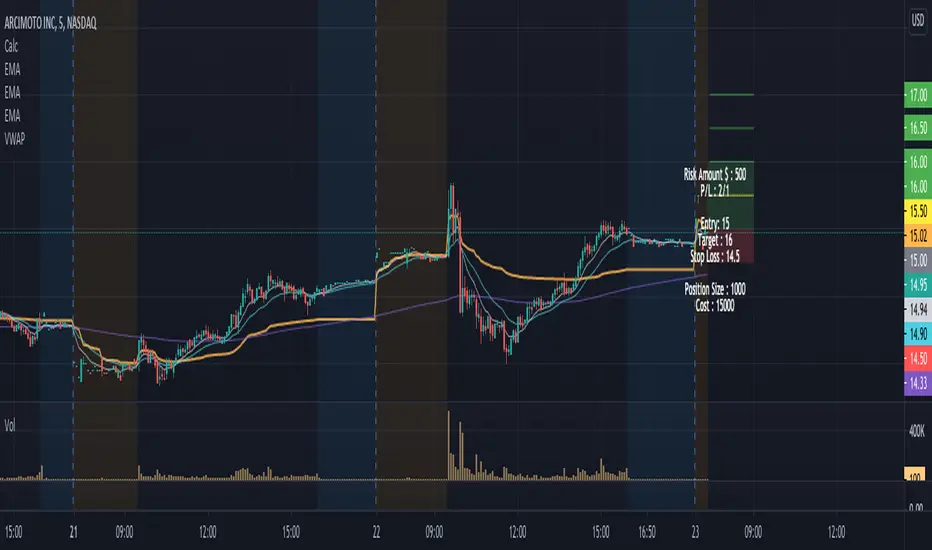
Position Size Calculator w/ profit targetsThis script helps the user visualize profit targets and calculates position size based on the input risk amount.
Input variables:
- Risk amount
- Entry price
- Stop loss amount
- Profit target amount
Calculated variables:
- Profit loss ratio
- Position size
- Postion cost
Plotted variables:
- shaded: entry price --> price target (green filled)
- shaded: entry price --> stop loss target (red filled)
- 1:1 p/l ratio --> yellow line
- 2:1, 3:1, 4:1 p/l ratios --> green lines
Overlay text can be toggled on/off in parameter input section