Position Size CalculatorPosition Size Calculator
This open-source Pine Script® indicator helps traders manage risk by calculating position size, margin, and risk/reward based on account size, leverage, entry, stop-loss, and take-profit. It features a customizable table and optional chart lines/labels for clear trade planning across stocks, forex, crypto, and futures.
What It Does
- Position Size: Computes units to trade based on risk percentage and stop-loss distance, capped by leverage.
- Margin: Calculates initial margin in base currency and USD, with account size percentage.
- Risk/Reward: Shows risk-reward ratio, percentage price movements, and USD gains/losses.
- Visualization: Displays results in a table and optional chart lines/labels with customizable styles.
How It Works
- Precision: Adjusts price formatting using syminfo.mintick for accuracy across assets.
- Calculations: Position size = accountSize * (riskPercent / 100) / |entry - stoploss|, capped by accountSize * leverage / entry. Margin = positionSize / leverage. Risk-reward = |takeprofit - entry| / |stoploss - entry|.
- Display: Table shows metrics; optional lines/labels plot entry, stop-loss, and take-profit with percentage and USD details.
How to Use
- Set Inputs:
1- Account Size (USD): Your capital (e.g., 1000).
2- % Risk per Trade: Risk tolerance (e.g., 1%).
3- Leverage: Broker leverage (e.g., 1x, 10x).
4- Entry, Stop Loss, Take Profit: Trade prices.
5- Show Lines and Labels: Enable chart overlays.
- Customize: Adjust table position, colors, and line styles (Solid, Dashed, Dotted).
- View Results: Table shows position size, margin, and risk/reward. Chart lines/labels (if enabled) display prices, percentages, and USD outcomes.
- Apply: Use metrics for trade execution; modify code for custom features.
Notes
- Ensure valid inputs (entry ≠ stop-loss, both positive) to avoid “N/A”.
- Open-source: Inspect or extend the code for your needs.
- Contact the author via TradingView for feedback.
在腳本中搜尋"profit"

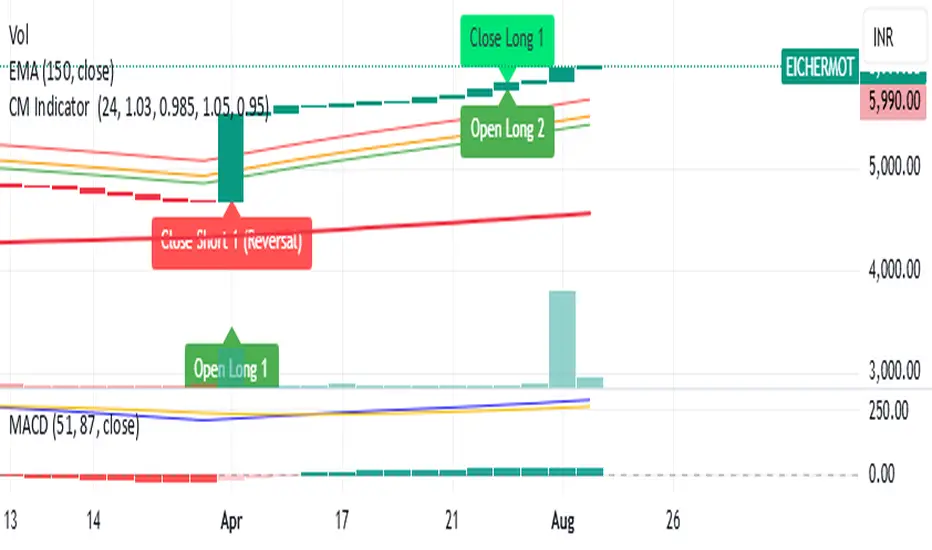
CM Indicator About Indicator:-
1) This is best Indicator for trend identification.
2) This is based on 42 EMA with Upper Band and Lower bands for trend identification.
3) This should be used for Line Bar chart only.
4) Line bar chart should be used at 1 hour for 15 line breaks.
How to Use:-
1) To go with trend is best use of this indicator.
2) This is for stocks and options not for index. Indicator used for Stocks at one hour and options for 10-15 minutes line break.
3) There will be 5% profitability defined for each entry, 3 entries with profit are best posible in same continuous trend 4 and 5th entry is in riskier zone in continuous trend.
4) Loss will only happen if there is trend reversal.
5) Loss could only be one trade of profit out of three profitable trades.
6) Back tested on 200 stocks and 100 options.
MACD StrategyOverview
The "MACD Strategy" is a straightforward trading strategy tested for BTCUSDT Futures on the 1-minute timeframe, leveraging the Moving Average Convergence Divergence (MACD) indicator to identify momentum-based buy and sell opportunities. Developed with input from expert trading analyst insights, this strategy combines technical precision with risk management, making it suitable for traders of all levels on platforms like TradingView. It focuses on capturing trend reversals and momentum shifts, with clear visual cues and automated alerts for seamless integration with trading bots (e.g., Bitget webhooks).
#### How It Works
This strategy uses the MACD indicator to generate trading signals based on momentum and trend direction:
- **Buy Signal**: Triggered when the MACD line crosses above the signal line, and the MACD histogram turns positive (above zero). This suggests increasing bullish momentum.
- **Sell Signal**: Triggered when the MACD line crosses below the signal line, and the MACD histogram turns negative (below zero), indicating growing bearish momentum.
Once a signal is detected, the strategy opens a position (long for buy, short for sell) with a position size calculated based on your risk tolerance. It includes a stop-loss to limit losses and a take-profit to lock in gains, both dynamically adjusted using the Average True Range (ATR) for adaptability to market volatility.
#### Key Features
- **MACD-Based Signals**: Relies solely on MACD for entry points, plotted in a separate pane for clear momentum analysis.
- **Risk Management**: Automatically calculates position size based on a percentage of your account balance and sets stop-loss and take-profit levels using ATR multipliers and a risk:reward ratio.
- **Visual Feedback**: Plots entry, stop-loss, and take-profit lines on the chart with labeled markers for easy tracking.
- **Alerts**: Includes Bitget webhook-compatible alerts for automated trading, notifying you of buy and sell signals in real-time.
#### Input Parameters
- **Account Balance**: Default 10000 – Set your initial trading capital to determine position sizing.
- **MACD Fast Length**: Default 12 – The short-term EMA period for MACD sensitivity.
- **MACD Slow Length**: Default 26 – The long-term EMA period for MACD calculation.
- **MACD Signal Length**: Default 9 – The smoothing period for the signal line.
- **Risk Per Trade (%)**: Default 3.0 – The percentage of your account balance risked per trade (e.g., 3% of 10000 = 300).
- **Risk:Reward Ratio**: Default 3.0 – The ratio of potential profit to risk (e.g., 3:1 means risking 1 to gain 3).
- **SL Multiplier**: Default 1.0 – Multiplies ATR to set the stop-loss distance (e.g., 1.0 x ATR).
- **TP Multiplier**: Default 3.0 – Multiplies ATR to set the take-profit distance, adjusted by the risk:reward ratio.
- **Line Length (bars)**: Default 25 – Duration in bars for displaying trade lines on the chart.
- **Label Position**: Default 'left' – Position of text labels (left or right) relative to trade lines.
- **ATR Period**: Default 14 – The number of periods for calculating ATR to measure volatility.
#### How to Use
1. **Add to Chart**: Load the "MACD Strategy" as a strategy and the "MACD Indicator" as a separate indicator on your TradingView chart (recommended for BTCUSDT Futures on the 1-minute timeframe).
2. **Customize Settings**: Adjust the input parameters based on your risk tolerance and market conditions. For BTCUSDT Futures, consider reducing `Risk Per Trade (%)` during high volatility (e.g., 1%) or increasing `SL Multiplier` for wider stops.
3. **Visual Analysis**: Watch the main chart for trade entry lines (green for buy, red for sell), stop-loss (red), and take-profit (green) lines with labels. Use the MACD pane below to confirm momentum shifts.
4. **Set Alerts**: Create alerts in TradingView for "Buy Signal" and "Sell Signal" to automate trades via Bitget webhooks.
5. **Backtest and Optimize**: Test the strategy on historical BTCUSDT Futures 1-minute data to fine-tune parameters. The short timeframe requires quick execution, so monitor closely for slippage or latency.
#### Tips for Success
- **Market Conditions**: This strategy performs best in trending markets on the 1-minute timeframe. Avoid choppy conditions where MACD crossovers may produce false signals.
- **Risk Management**: Start with the default 3% risk per trade and adjust downward (e.g., 1%) during volatile periods like BTCUSDT news events. The 3:1 risk:reward ratio targets consistent profitability.
- **Timeframe**: Optimized for 1-minute charts; switch to 5-minute or 15-minute for less noise if needed.
- **Confirmation**: Cross-check MACD signals with price action or support/resistance levels for higher accuracy on BTCUSDT Futures.
#### Limitations
- This strategy relies solely on MACD, so it may lag in fast-moving or sideways markets. Consider adding a secondary filter (e.g., RSI) if needed.
- Stop-loss and take-profit are ATR-based and may need adjustment for BTCUSDT Futures’ high volatility, especially during leverage trading.
#### Conclusion
The "MACD Strategy" offers a simple yet effective way to trade momentum shifts using the MACD indicator, tested for BTCUSDT Futures on the 1-minute timeframe, with robust risk management and visual tools. Whether you’re scalping crypto futures or exploring short-term trends, this strategy provides a solid foundation for automated or manual trading. Share your feedback or customizations in the comments, and happy trading!

Script_Algo - ORB Strategy with Filters🔍 Core Concept: This strategy combines three powerful technical analysis tools: Range Breakout, the SuperTrend indicator, and a volume filter. Additionally, it features precise customization of the number of candles used to construct the breakout range, enabling optimized performance for specific assets.
🎯 How It Works:
The strategy defines a trading range at the beginning of the trading session based on a selected number of candles.
It waits for a breakout above the upper or below the lower boundary of this range, requiring a candle close.
It filters signals using the SuperTrend indicator for trend confirmation.
It utilizes trading volume to filter out false breakouts.
⚡ Strategy Features
📈 Entry Points:
Long: Candle close above the upper range boundary + SuperTrend confirmation
Short: Candle close below the lower range boundary + SuperTrend confirmation
🛡️ Risk Management:
Stop-Loss: Set at the opposite range boundary.
Take-Profit: Calculated based on a risk/reward ratio (3:1 by default).
Position Size: 10 contracts (configurable).
⚠️ IMPORTANT SETTINGS
🕐 Time Parameters:
Set the correct time and time zone!
❕ATTENTION: The strategy works ONLY with correct time settings! Set the time corresponding to your location and trading session.
📊 This strategy is optimized for trading TESLA stock!
Parameters are tailored to TESLA's volatility, and trading volumes are adequate for signal filtering. Trading time corresponds to the American session.
📈 If you look at the backtesting results, you can see that the strategy could potentially have generated about 70 percent profit on Tesla stock over six months on 5m timeframe. However, this does not guarantee that results will be repeated in the future; remain vigilant.
⚠️ For other assets, the following is required:
Testing and parameter optimization
Adjustment of time intervals and the number of candles forming the range
Calibration of stop-loss and take-profit levels
⚠️ Limitations and Drawbacks
🔗 Automation Constraints:
❌ Cannot be directly connected via Webhook to CFD brokers!
Additional IT solutions are required for automation, thus only manual trading based on signals is possible.
📉 Risk Management:
Do not risk more than 2-3% of your account per trade.
Test on historical data before live use.
Start with a demo account.
💪 Strategy Advantages
✅ Combined approach – multiple signal filters
✅ Clear entry and exit rules
✅ Visual signals on the chart
✅ Volume-based false breakout filtering
✅ Automatic position management
🎯 Usage Recommendations
Always test the strategy on historical data.
Start with small trading volumes.
Ensure time settings are correct.
Adapt parameters to current market volatility.
Use only for stocks – futures and Forex require adaptation.
📚 Suitable Timeframes - M1-M15
Only highly liquid stocks
🍀 I wish all subscribers good luck in trading and steady profits!
📈 May your charts move in the right direction!
⚠️ Remember: Trading involves risk. Do not invest money you cannot afford to lose!

Script_Algo - High Low Range MA Crossover Strategy🎯 Core Concept
This strategy uses modified moving averages crossover, built on maximum and minimum prices, to determine entry and exit points in the market. A key advantage of this strategy is that it avoids most false signals in trendless conditions, which is characteristic of traditional moving average crossover strategies. This makes it possible to improve the risk/reward ratio and, consequently, the strategy's profitability.
📊 How the Strategy Works
Main Mechanism
The strategy builds 4 moving averages:
Two senior MAs (on high and low) with a longer period
Two junior MAs (on high and low) with a shorter period
Buy signal 🟢: when the junior MA of lows crosses above the senior MA of highs
Sell signal 🔴: when the junior MA of highs crosses below the senior MA of lows
As seen on the chart, it was potentially possible to make 9X on the WIFUSDT cryptocurrency pair in just a year and a half. However, be careful—such results may not necessarily be repeated in the future.
Special Feature
Position closing priority ❗: if an opposite signal arrives while a position is open, the strategy first closes the current position and only then opens a new one
⚙️ Indicator Settings
Available Moving Average Types
EMA - Exponential MA
SMA - Simple MA
SSMA - Smoothed MA
WMA - Weighted MA
VWMA - Volume Weighted MA
RMA - Adaptive MA
DEMA - Double EMA
TEMA - Triple EMA
Adjustable Parameters
Senior MA Length - period for long-term moving averages
Junior MA Length - period for short-term moving averages
✅ Advantages of the Strategy
🛡️ False Signal Protection - using two pairs of modified MAs reduces the number of false entries
🔄 Configuration Flexibility - ability to choose MA type and calculation periods
⚡ Automatic Switching - the strategy automatically closes the current position when receiving an opposite signal
📈 Visual Clarity - all MAs are displayed on the chart in different colors
⚠️ Disadvantages and Risks
📉 Signal Lag - like all MA-based strategies, it may provide delayed signals during sharp movements
🔁 Frequent Switching - in sideways markets, it may lead to multiple consecutive position openings/closings
📊 Requires Optimization - optimal parameters need to be selected for different instruments and timeframes
💡 Usage Recommendations
Backtest - test the strategy's performance on historical data
Optimize Parameters - select MA periods suitable for the specific trading instrument
Use Filters - add additional filters to confirm signals
Manage Risks - always use stop-loss and take-profit orders.
You can safely connect to the exchange via webhook and enjoy trading.
Good luck and profits to everyone!!

TZtraderTZtrader
This is a TrendZones version with features to set stoploss and targets in short and long positions meant for use in intraday charts. It aims to provide signals for opening and closing long and short positions. In the comments under the TrendZones publication several people expressed a need for features for a short position similar to those for a long position as implemented in TrendZones, some want to use it for scalping, some asked for alerts. When I proposed to create a version for day trading with target lines based on ATR, several people liked the idea.
Full disclosure: I don’t do day trading, because, after I lost a lot of money, I had to promise my wife to stay away from it. I restrict myself to long term investing in stocks which are in uptrend. However I understand what a day trader needs. I gather from my experience that day trading or scalping is an attempt to earn something by opening a position in the morning and close, reopen and close it again during the day with a profit. It is usually done with leveraged instruments like CFD’s, futures, options, and what have you. Opening and closing positions is done within minutes, so the trader needs a quick and efficient way to set proper stoploss and target. TZtrader supports this by showing only three or four numbers on the price bar: The price of the instrument, The logical stop level (gray or green or maroon dots), and the target level (navy). All other numbers are suppressed to prevent mistakes. Also a clear feedback for current settings at the top-center of the pane and an alert feedback at bottom that flashes alerts during the development of the current bar and gives suppression status.
The script
First I made a bare bones version of TrendZones to which I added code for long and short trading setups and a bare setup for no position. The code for the logical stops in long setup had to be reviewed, after which this became the basis for stops in short setup.
Then I added code for 10 alert messages, which was a hassle, because this is the first time I coded alerts and the first time I used an array as a stack to avoid a complicated if-then construction. During testing the array caused a runtime error which I solved by adding ‘array.clear’ to the code, also I discovered that in TradingView separate alerts have to be created for all three setups - short, long and bare. Flipping setups is done in the inputs with a dropdown menu because Pine Script has no function for a clickable button.
One visual with three setups.
The visual has the TrendZones structure: Three near parallel very smooth curves, which border the moderate uptrend (green) and downtrend (orange) zone over and under the curve in the middle, the COG (Center Of Gravity). Where the price breaks out of these curves, strong trend zones show up over and under the curves, respectively strong uptrend (blue) and strong downtrend (red).
Three setups were made clearly different to avoid confusion and to provide oversight in case of multiple trades going on simultaneously which I imagine are monitored in one screen. You have to see which one is long, which short and which have no position. The long setup should not trigger short signals, nor should the short trigger long signals nor the bare setup exclusive long or short signals.
The Long setup is default, shown on the example chart. In this setup the Stoploss suggestions (green, gray and maroon dots) are under the price bars and the target line (navy) at a set distance above the High Border. A zone with a width of 1 ATR is drawn under the Low Border. In this setup 5 specific alerts are provided
The Short setup has the Stoploss suggestions over the price bars, the target line at a set distance under the Low Border. A zone with a width of 1 ATR is drawn above the High Border. This setup also has 5 specific alerts.
The Bare setup has no Stoploss suggestions, no target line and supports 4 alerts, 2 in common with the Long setup and 2 with Short.
The table below gives a summary of scripted alerts:
Setup = Where = When = Purpose
Long, Bare = Green Zone = Bars come from lower zones = Uptrend starts
Long, Bare = Green Zone = Sideways ends in uptrend = Uptrend resumes
Long = COG = First crossing = Uptrend might end warning
Long = Orange Zone = Bars come from higher zones = Uptrend ended take care
Long = Red Zone = Bars come from higher zones = Strong downtrend->close Long
Short, Bare = Orange Zone = Bars come from higher zones = Downtrend starts
Short, Bare = Orange Zone = Sideways ends in downtrend = Downtrend resumes
Short = COG = First crossing = Downtrend might end warning
Short = Green Zone = Bars come from lower zones = Downtrend ended take care
Short = Blue Zone = Bars come from lower zones = Strong uptrend -> close short
You can use script alerts in TradingView by clicking the clock in the sidebar, then ‘create alert’ or plus, as condition you choose ‘Tztrader’ in the dialog box, then the “Any alert() function call” option (the first item in the list). The script lets the valid alert trigger by TradingView after the bar is completed, this can differ from the flashed messages during its formation.
When you create alerts in Tradingview, I advice to do that for each setup, then to make only the alert active which matches the current setup, pause the other ones.
Suppressing false and annoying signals
The script has two ways to suppress such signals, which have to do with the numbers in the alert feedback. The numbers left and right of the message with a colored background, depict the zones in which the previous (left) and current (right) bar move. 1 is the strong downtrend zone (red), 2 the moderate downtrend zone (orange), 3 the sideways zones (gray), 4 the COG (gray), 5 the moderate uptrend zone (green), 6 the strong uptrend zone (blue), 7 something went wrong with assigning a zone (black). In extensive testing the number 7 never occurs, because I catch that error in the code. The idea is that an alert is only triggered if the previous bar was in a different zone. When the bars are in the same zone, no alert is possible. This way all annoying signals are suppressed and long, short and bare get the appropriate alerts.
The third number is a counter. It counts how often the COG is crossed without touching the outer curves. The counter will reset to zero when the upper or lower curve is touched. When the count is 1 you have zone situation 4 and appropriate alerts are flashed. When the count is 2 or higher, a sideways situation (3) is called and while the recrossings are going on, no alerts can be flashed. This suppresses false signals. The ATR zone and curves are brownish-gray where sideways happens(ed). When the channel is narrowed down to just the three curves, some false signals still might occur.
Inputs
“Setup”, default is long, drop down menu provides long, short and bare.
“Target ATR”, default is 2, sets the amount of ATR for the target line. In 1 minute charts 4 seems an appropriate setting, you have to learn by experience which setting works.
“show feedback …” default is on, This creates two feedback labels, a Setup feedback on top of the pane, which shows charted instrument, Setup type, Trend and timeframe of the chart. Background color of Trend feedback is green when it matches the setup, red when mismatches and gray when no match. The alert feedback at the bottom of the pane shows a number, a message and two numbers. The numbers will be explained in the chapter about false and annoying signals below. During formation of the bar, valid alerts are flashed with a blue background, otherwise the message ‘alerts for current bar suppressed’.
Logical Stops
The curves are the logical place to put stops, because, as these are averages of the high and low border of a Donchian channel, they signify the ‘natural’ current highest, lowest and main level in the lookback period that fit the monitored trend setup. A downtrend turns into an uptrend when a breakout of the upper curve occurs. If you are short, that is where you want to close position, so the logical place for the stoploss is the upper curve. Vice versa, when you are long, the logical stop is on the lower curve. The stops show up as green or gray dots on the curves, the green dots signify a nice entry level, the gray stops are there to suggest levels where unrealized profits might be secured, the maroon dots indicate that the trend mismatches the setup.
COG versus other lines
Any line used to identify a trend, be it some MA or some other line, is interpreted the same way: When the bars move above the line there is an uptrend and when below, a downtrend. COG is not different in that sense. If you put such a line in the same chart as TZtrader, you can see situations in which the other line shows uptrend or downtrend earlier than COG, also some other lines, e.g. Hull MA, are very good at showing tops and bottoms, while COG ignores these. On the other hand the other lines are usually a little nervous and let you shake out of position too soon. Just like the other lines, COG gives false signals when it is near horizontal. The advantage of the placement COG is the tolerance for pull backs. This way TZtrader keeps you longer in the trend. Such pull backs are often ‘flags’ which are interpreted in TA as confirming the trend. Tztrader aims to get you in position reasonably soon when a trend begins and out of position as soon as the trend turns against you. The placement of COG is done with a fundamentally different algorithm than other lines as it is not an average of prices, but the middle of two averages of borders of a Donchian channel. This gives the two zones between the curves the same quality as the two zones above and below the middle line of a standard Donchian Channel.
A multi timeframe application.
In this scenario you put a 5 minutes and 1 minute chart with Tztrader side by side. If the 5 minutes shows uptrend, set the 1 minute on long trading and open positions when the trend matches uptrend en close when it mismatches. Don’t open short positions. Once the 5 minute changes to downtrend, set Tztrader in the 1 minute to short trading and open positions when the trend matches downtrend and close when it mismatches.
The idea is that in a long ‘context’, provided by the 5 minutes, the uptrends in the 1 minute will last longer and go further, vice versa for the short ‘context’. This way you do swing trading in the 5 minute in a smart way, maximizing profits.
You can do this with any timeframe pairs with a proportion of around 5:1, 4:1, 6:1, like e.g. 60 minutes and 15 minutes or weeks and days (5 trading days in a week).
Dear day-traders, may this tool be helpful and may your days be blessed.
Take care

Opening-Range BreakoutNote: Default trading date range looks mediocre. Set date range to "Entire History" to see full effect of the strategy. 50.91% profitable trades, 1.178 profit factor, steady profits and limited drawdown. Total P&L: $154,141.18, Max Drawdown: $18,624.36. High R^2
█ Overview
The Opening-Range Breakout strategy is a mechanical, session‑based day‑trading system designed to capture the initial burst of directional momentum immediately following the market open. It defines a user‑configurable “opening range” window, measures its high and low boundaries, then places breakout stop orders at those levels once the range closes. Built‑in filters on minimum range width, reward‑to‑risk ratios, and optional reversal logic help refine entries and manage risk dynamically.
█ How It Works
Opening‑Range Formation
Between 9:30–10:15 AM ET (configurable), the script tracks the highest high and lowest low to form the day’s opening range box.
On the first bar after the range window closes, the range high (OR_high) and low (OR_low) are “locked in.”
Range‑Width Filter
To avoid false breakouts in low‑volatility mornings, the range must be at least X% of the current price (default 0.35%).
If the measured opening-range width < minimum threshold, no orders are placed that day.
Entry & Order Placement
Long: a stop‑buy order at the opening‑range high.
Short: a stop‑sell order at the opening‑range low.
Only one side can trigger (or both if reverse logic is enabled after a losing trade).
Risk Management
Once triggered, each trade uses an ATR‑style stop-loss defined as a percentage retracement of the range (default 50% of range width).
Profit target is set at a configurable Reward/Risk Ratio (default 1.1×).
Optional: Reverse on Stop‑Loss – if the initial breakout loses, immediately reverse into the opposite side on the same day.
Session Exit
Any open positions are closed at the end of the regular trading day (default 3:45 PM ET window end, with hard flat at session close).
Visual cues are provided via green (range high) and red (range low) step‑line plots directly on the chart, allowing you to see the range box and breakout triggers in real time.
█ Why It Works
Early Momentum Capture: The first 15 – 60 minutes of trading encapsulate overnight news digestion and institutional order flow, creating a well‑defined volatility “range.”
Mechanical Discipline: Clear, rule‑based entries and exits remove emotional guesswork, ensuring consistency.
Volatility Filtering: By requiring a minimum range width, the system avoids choppy, low‑range days where false breakouts are common.
Dynamic Sizing: Stops and targets scale with the opening range, adapting automatically to each day’s volatility environment.
█ How to Use
Set Your Instruments & Timeframe
-Apply to any futures contract on a 1‑ to 5‑minute chart.
-Ensure chart timezone is set to America/New_York.
Configure Inputs
-Opening‑Range Window: e.g. “0930-1015” for a 45‑minute range.
-Min. OR Width (%): e.g. 0.35 for 0.35% of current price.
-Reward/Risk Ratio: e.g. 1.1 for a modest profit target above your stop.
-Max OR Retracement %: e.g. 50 to set stop at 50% of range width.
-One Trade Per Day: toggle to limit to a single breakout.
-Reverse on Stop Loss: toggle to flip direction after a losing breakout.
Monitor the Chart
-Watch the green and red range boundaries form during the session open.
-Orders will automatically submit on the first bar after the range window closes, conditioned on your filters.
Review & Adjust
-Backtest across multiple months to validate performance on your preferred contract.
-Tweak range duration, minimum width, and R/R multiple to fit your risk tolerance and desired win‑rate vs. expectancy balance.
█ Settings Reference
Input Defaults
Opening‑Range Window - Time window to form OR (HHMM-HHMM) - 0930–1015
Regular Trading Day - Full session for EOD flat (HHMM-HHMM) - 0930–1545
Min. OR Width (%) - Minimum OR size as % of close to trigger orders - 0.35
Reward/Risk Ratio - Profit target multiple of stop‑loss distance - 1.1
Max OR Retracement (%) - % of OR width to use as stop‑loss distance - 50
One Trade Per Day - Limit to a single breakout order per day - false
Reverse on Stop Loss - Reverse direction immediately after a losing trade - true
Disclaimer
This strategy description and any accompanying code are provided for educational purposes only and do not constitute financial advice or a solicitation to trade. Futures trading involves substantial risk, including possible loss of capital. Past performance is not indicative of future results. Traders should assess their own risk tolerance and conduct thorough backtesting and forward-testing before committing real capital.

Breakout Range Signal with Quality Analysis [Dova Lazarus]📌 Breakout Range Signal with Quality Analysis
🎓 Training-focused indicator for breakout logic, SL & TP behavior and signal quality assessment
🔷 PURPOSE
This tool identifies breakout candles from a calculated channel range and visually simulates entries, stop losses, and take profits, providing live and historical performance metrics.
⚙️ MAIN SETTINGS
1️⃣ Channel Setup
channel_length = 10 → how many candles are averaged to form channel boundaries
channel_multiplier = 0.0 → adds expansion above/below the base channel
channel_smoothing_type = SMA → smoothing method for high/low averaging
📊 The channel consists of two moving averages: one from highs, the other from lows. When expanded (via multiplier), it creates a buffer range for breakout validation.
2️⃣ Signal Detection
Body > Channel % = 50 → a breakout candle's body must exceed 150% of the channel width
Signal Mode:
• Weak → every valid breakout candle is highlighted
• Strong → only the first signal in a sequence is shown (helps reduce noise)
🟦 Bullish signals (blue):
• Candle opens inside the channel
• Closes above the channel
• Body is large enough
• Optional: confirms with trend (if enabled)
🟨 Bearish signals (yellow):
• Candle opens inside the channel
• Closes below the channel
• Body is large enough
• Optional: confirms with trend
3️⃣ Trend Filter (optional)
Enabled via checkbox
Uses a higher timeframe MA to filter signals
Bullish signals are allowed only if price is below the trend MA
Bearish signals only if price is above it
⏱️ trend_timeframe = 1D (typically set higher than the chart's timeframe)
🟢 Trend line is plotted if enabled
🎯 ENTRY, STOP LOSS & TAKE PROFIT LOGIC
SL and TP are based on channel width, not fixed pip/tick size:
📍 Entry Price = close of the breakout candle
🛑 Stop Loss:
• Bullish → below the lower channel border (minus offset)
• Bearish → above the upper channel border (plus offset)
🎯 Take Profit:
• Bullish → entry + channel width × profit multiplier
• Bearish → entry − channel width × profit multiplier
You can control:
Profit Target Multiplier (e.g., 1.0 → TP = 1×channel width)
Stop Loss Target Multiplier (e.g., 0.5 → SL = 0.5×channel width)
Signals to Show = how many historical SL/TP setups to display
📈 Lines and labels ("TP", "SL") are drawn on the chart for clarity.
🧪 QUALITY ANALYSIS MODULE
If enabled, the indicator will:
Track each new signal (entry, SL, TP)
Analyze outcomes:
• Win = TP hit before SL
• Loss = SL hit before TP
• Expired = signal unresolved after N bars
Display statistics in a table (top-right corner):
📋 Table fields:
✅ Overall win rate
📈 Bullish win rate
📉 Bearish win rate
🔢 Total signals
🕓 Pending (still active trades)
Maximum bars to wait for outcome is customizable (max_bars_to_analyze).
📐 VISUALIZATION TOOLS
TP / SL lines per signal
Labels “TP” and “SL”
Optional channel lines and trendline for better context
Colored bars for valid signals (blue/yellow)
📌 BEST USE CASES
Understand how breakout signals are formed
Learn SL/TP logic based on dynamic range
Test how volatility affects trade outcomes
Use as a visual simulation of trade behavior over time

RSI-Adaptive T3 + Squeeze Momentum Strategy✅ Strategy Guide: RSI-Adaptive T3 + Squeeze Momentum Strategy
📌 Overview
The RSI-Adaptive T3 + Squeeze Momentum Strategy is a dynamic trend-following strategy based on an RSI-responsive T3 moving average and Squeeze Momentum detection .
It adapts in real-time to market volatility to enhance entry precision and optimize risk.
⚠️ This strategy is provided for educational and research purposes only.
Past performance does not guarantee future results.
🎯 Strategy Objectives
The main objective of this strategy is to catch the early phase of a trend and generate consistent entry signals.
Designed to be intuitive and accessible for traders from beginner to advanced levels.
✨ Key Features
RSI-Responsive T3: T3 length dynamically adjusts according to RSI values for adaptive trend detection
Squeeze Momentum: Combines Bollinger Bands and Keltner Channels to identify trend buildup phases
Visual Triggers: Entry signals are generated from T3 crossovers and momentum strength after squeeze release
📊 Trading Rules
Long Entry:
When T3 crosses upward, momentum is positive, and the squeeze has just been released.
Short Entry:
When T3 crosses downward, momentum is negative, and the squeeze has just been released.
Exit (Reversal):
When the opposite condition to the entry is triggered, the position is reversed.
💰 Risk Management Parameters
Pair & Timeframe: BTC/USD (30-minute chart)
Capital (simulated): $30,00
Order size: `$100` per trade (realistic, low-risk sizing)
Commission: 0.02%
Slippage: 2 pips
Risk per Trade: 5%
Number of Trades (backtest period): 181
📊 Performance Overview
Symbol: BTC/USD
Timeframe: 30-minute chart
Date Range: January 1, 2024 – July 3, 2025
Win Rate: 47.8%
Profit Factor: 2.01
Net Profit: 173.16 (units not specified)
Max Drawdown: 5.77% or 24.91 (0.79%)
⚙️ Indicator Parameters
Indicator Name: RSI-Adaptive T3 + Squeeze Momentum
RSI Length: 14
T3 Min Length: 5
T3 Max Length: 50
T3 Volume Factor: 0.7
BB Length: 27 (Multiplier: 2.0)
KC Length: 20 (Multiplier: 1.5, TrueRange enabled)
🖼 Visual Support
T3 slope direction, squeeze status, and momentum bars are visually plotted on the chart,
providing high clarity for quick trend analysis and execution.
🔧 Strategy Improvements & Uniqueness
Inspired by the RSI Adaptive T3 by ChartPrime and Squeeze Momentum Indicator by LazyBear ,
this strategy fuses both into a hybrid trend-reversal and momentum breakout detection system .
Compared to traditional trend-following methods, it excels at capturing early trend signals with greater sensitivity .
✅ Summary
The RSI-Adaptive T3 + Squeeze Momentum Strategy combines momentum detection with volatility-responsive risk management.
With a strong balance between visual clarity and practicality, it serves as a powerful tool for traders seeking high repeatability.
⚠️ This strategy is based on historical data and does not guarantee future profits.
Always use appropriate risk management when applying it.

All SMAs Bullish/Bearish Screener (Enhanced)All SMAs Bullish/Bearish Screener Enhanced: Uncover High-Conviction Trend Alignments with Confidence
Description:
Are you ready to elevate your trading from mere guesswork to precise, data-driven decisions? The "All SMAs Bullish/Bearish Screener Enhanced" is not just another indicator; it's a sophisticated, yet user-friendly, trend-following powerhouse designed to cut through market noise and pinpoint high-probability trading opportunities. Built on the foundational strength of comprehensive Moving Average confluence and fortified with critical confirmation signals from Momentum, Volume, and Relative Strength, this script empowers you to identify truly robust trends and manage your trades with unparalleled clarity.
The Power of Multi-Factor Confluence: Beyond Simple Averages
In the unpredictable world of financial markets, true strength or weakness is rarely an isolated event. It's the harmonious alignment of multiple technical factors that signals a high-conviction move. While our original "All SMAs Bullish/Bearish Screener" intelligently identified stocks where price was consistently above or below a full spectrum of Simple Moving Averages (5, 10, 20, 50, 100, 200), this Enhanced version takes it a crucial step further.
We've integrated a powerful three-pronged confirmation system to filter out weaker signals and highlight only the most compelling setups:
Momentum (Rate of Change - ROC): A strong trend isn't just about price direction; it's about the speed and intensity of that movement. Positive momentum confirms that buyers are still aggressively pushing price higher (for bullish signals), while negative momentum validates selling pressure (for bearish signals).
Volume: No trend is truly trustworthy without the backing of smart money. Above-average volume accompanying an "All SMAs" alignment signifies strong institutional participation and conviction behind the move. It separates genuine trend starts from speculative whims.
Relative Strength Index (RSI): This versatile oscillator ensures the trend isn't just "there," but that it's developing healthily. We use RSI to confirm a bullish bias (above 50) or a bearish bias (below 50), adding another layer of confidence to the direction.
When the price aligns above ALL six critical SMAs, and is simultaneously confirmed by robust positive momentum, healthy volume, and a bullish RSI bias, you have an exceptionally strong "STRONGLY BULLISH" signal. This confluence often precedes sustained upward moves, signaling prime accumulation phases. Conversely, a "STRONGLY BEARISH" signal, where price is below ALL SMAs with negative momentum, confirming volume, and a bearish RSI bias, indicates powerful distribution and potential for significant downside.
How to Use This Enhanced Screener:
Add to Chart: Go to TradingView's Pine Editor, paste the script, and click "Add to Chart."
Customize Parameters: Fine-tune the lengths of your SMAs, RSI, Momentum, and Volume averages via the indicator's settings. Experiment to find what best suits your trading style and the assets you trade.
Choose Your Timeframe Wisely:
Daily (1D) and 4-Hour (240 min) are highly recommended. These timeframes cut through intraday noise and provide more reliable, actionable signals for swing and position trading.
Shorter timeframes (e.g., 15min, 60min) can be used by advanced day traders for very short-term entries, but be aware of increased volatility and noise.
Visual Confirmation:
Green/Red Triangles: Appear on your chart, indicating confirmed bullish or bearish signals.
Background Color: The chart background will subtly turn lime green for "STRONGLY BULLISH" and red for "STRONGLY BEARISH" conditions.
On-Chart Status Table: A clear table displays the current signal status ("STRONGLY BULLISH/BEARISH," or "SMAs Mixed") for immediate feedback.
Set Up Alerts (Your Primary Screener Tool): This is the game-changer! Create custom alerts on TradingView based on the "Confirmed Bullish Trade" and "Confirmed Bearish Trade" conditions. Receive instant notifications (email, pop-up, mobile) for any stock in your watchlist that meets these stringent criteria. This allows you to scan the entire market effortlessly and act decisively.
Strategic Stop-Loss Placement: The Trader's Lifeline
Even the most robust signals can fail. Protecting your capital is paramount. For this trend-following strategy, your stop-loss should be placed where the underlying trend structure is broken.
For a "STRONGLY BULLISH" Trade: Place your stop-loss just below the most recent significant swing low (higher low). This is the last point where buyers stepped in to support the price. If price breaks below this, your bullish thesis is invalidated.
For a "STRONGLY BEARISH" Trade: Place your stop-loss just above the most recent significant swing high (lower high). If price breaks above this, your bearish thesis is invalidated.
Alternatively, consider placing your stop-loss just below the 20-period SMA (for bullish trades) or above the 20-period SMA (for bearish trades). A significant close beyond this intermediate-term average often indicates a critical shift in momentum. Always ensure your chosen stop-loss adheres to your pre-defined risk per trade (e.g., 1-2% of capital).
Disciplined Profit Booking: Maximizing Gains
Just as important as knowing when you're wrong is knowing when to take profits.
Trailing Stop-Loss: As your trade moves into profit, trail your stop-loss upwards (for longs) or downwards (for shorts). You can trail it using:
Previous Swing Lows/Highs: Move your stop to just below each new higher low (for longs) or just above each new lower high (for shorts).
A Moving Average (e.g., 10-period or 20-period SMA): If price closes below your chosen trailing SMA, exit. This allows you to ride the trend while protecting accumulated profits.
Target Levels: Identify potential resistance levels (for longs) or support levels (for shorts) using pivot points, previous highs/lows, or Fibonacci extensions. Consider taking partial profits at these levels and letting the rest run with a trailing stop.
Loss of Confluence: If the "STRONGLY BULLISH/BEARISH" condition ceases to be met (e.g., RSI crosses below 50, or volume drops significantly), this can be a signal to reduce or exit your position, even if your stop-loss hasn't been hit.
The "All SMAs Bullish/Bearish Screener Enhanced" is your comprehensive partner in navigating the markets. By combining robust trend identification with critical confirmation signals and disciplined risk management, you're equipped to make smarter, more confident trading decisions. Add it to your favorites and unlock a new level of precision in your trading journey!
#PineScript #TradingView #SMA #MovingAverage #TrendFollowing #StockScreener #TechnicalAnalysis #Bullish #Bearish #QQQ #Momentum #Volume #RSI #SPY #TradingStrategy #Enhanced #Signals #Analysis #DayTrading #SwingTrading

TitanGrid L/S SuperEngineTitanGrid L/S SuperEngine
Experimental Trend-Aligned Grid Signal Engine for Long & Short Execution
🔹 Overview
TitanGrid is an advanced, real-time signal engine built around a tactical grid structure.
It manages Long and Short trades using trend-aligned entries, layered scaling, and partial exits.
Unlike traditional strategy() -based scripts, TitanGrid runs as an indicator() , but includes its own full internal simulation engine.
This allows it to track capital, equity, PnL, risk exposure, and trade performance bar-by-bar — effectively simulating a custom backtest, while remaining compatible with real-time alert-based execution systems.
The concept was born from the fusion of two prior systems:
Assassin’s Grid (grid-based execution and structure) + Super 8 (trend-filtering, smart capital logic), both developed under the AssassinsGrid framework.
🔹 Disclaimer
This is an experimental tool intended for research, testing, and educational use.
It does not provide guaranteed outcomes and should not be interpreted as financial advice.
Use with demo or simulated accounts before considering live deployment.
🔹 Execution Logic
Trend direction is filtered through a custom SuperTrend engine. Once confirmed:
• Long entries trigger on pullbacks, exiting progressively as price moves up
• Short entries trigger on rallies, exiting as price declines
Grid levels are spaced by configurable percentage width, and entries scale dynamically.
🔹 Stop Loss Mechanism
TitanGrid uses a dual-layer stop system:
• A static stop per entry, placed at a fixed percentage distance matching the grid width
• A trend reversal exit that closes the entire position if price crosses the SuperTrend in the opposite direction
Stops are triggered once per cycle, ensuring predictable and capital-aware behavior.
🔹 Key Features
• Dual-side grid logic (Long-only, Short-only, or Both)
• SuperTrend filtering to enforce directional bias
• Adjustable grid spacing, scaling, and sizing
• Static and dynamic stop-loss logic
• Partial exits and reset conditions
• Webhook-ready alerts (browser-based automation compatible)
• Internal simulation of equity, PnL, fees, and liquidation levels
• Real-time dashboard for full transparency
🔹 Best Use Cases
TitanGrid performs best in structured or mean-reverting environments.
It is especially well-suited to assets with the behavioral profile of ETH — reactive, trend-intraday, and prone to clean pullback formations.
While adaptable to multiple timeframes, it shows strongest performance on the 15-minute chart , offering a balance of signal frequency and directional clarity.
🔹 License
Published under the Mozilla Public License 2.0 .
You are free to study, adapt, and extend this script.
🔹 Panel Reference
The real-time dashboard displays performance metrics, capital state, and position behavior:
• Asset Type – Automatically detects the instrument class (e.g., Crypto, Stock, Forex) from symbol metadata
• Equity – Total simulated capital: realized PnL + floating PnL + remaining cash
• Available Cash – Capital not currently allocated to any position
• Used Margin – Capital locked in open trades, based on position size and leverage
• Net Profit – Realized gain/loss after commissions and fees
• Raw Net Profit – Gross result before trading costs
• Floating PnL – Unrealized profit or loss from active positions
• ROI – Return on initial capital, including realized and floating PnL. Leverage directly impacts this metric, amplifying both gains and losses relative to account size.
• Long/Short Size & Avg Price – Open position sizes and volume-weighted average entry prices
• Leverage & Liquidation – Simulated effective leverage and projected liquidation level
• Hold – Best-performing hold side (Long or Short) over the session
• Hold Efficiency – Performance efficiency during holding phases, relative to capital used
• Profit Factor – Ratio of gross profits to gross losses (realized)
• Payoff Ratio – Average profit per win / average loss per loss
• Win Rate – Percent of profitable closes (including partial exits)
• Expectancy – Net average result per closed trade
• Max Drawdown – Largest recorded drop in equity during the session
• Commission Paid – Simulated trading costs: maker, taker, funding
• Long / Short Trades – Count of entry signals per side
• Time Trading – Number of bars spent in active positions
• Volume / Month – Extrapolated 30-day trading volume estimate
• Min Capital – Lowest equity level recorded during the session
🔹 Reference Ranges by Strategy Type
Use the following metrics as reference depending on the trading style:
Grid / Mean Reversion
• Profit Factor: 1.2 – 2.0
• Payoff Ratio: 0.5 – 1.2
• Win Rate: 50% – 70% (based on partial exits)
• Expectancy: 0.05% – 0.25%
• Drawdown: Moderate to high
• Commission Impact: High
Trend-Following
• Profit Factor: 1.5 – 3.0
• Payoff Ratio: 1.5 – 3.5
• Win Rate: 30% – 50%
• Expectancy: 0.3% – 1.0%
• Drawdown: Low to moderate
Scalping / High-Frequency
• Profit Factor: 1.1 – 1.6
• Payoff Ratio: 0.3 – 0.8
• Win Rate: 80% – 95%
• Expectancy: 0.01% – 0.05%
• Volume / Month: Very high
Breakout Strategies
• Profit Factor: 1.4 – 2.2
• Payoff Ratio: 1.2 – 2.0
• Win Rate: 35% – 60%
• Expectancy: 0.2% – 0.6%
• Drawdown: Can be sharp after failed breakouts
🔹 Note on Performance Simulation
TitanGrid includes internal accounting of fees, slippage, and funding costs.
While its logic is designed for precision and capital efficiency, performance is naturally affected by exchange commissions.
In frictionless environments (e.g., zero-fee simulation), its high-frequency logic could — in theory — extract substantial micro-edges from the market.
However, real-world conditions introduce limits, and all results should be interpreted accordingly.

(Mustang Algo) Stochastic RSI + Triple EMAStochastic RSI + Triple EMA (StochTEMA)
Overview
The Stochastic RSI + Triple EMA indicator combines the Stochastic RSI oscillator with a Triple Exponential Moving Average (TEMA) overlay to generate clear buy and sell signals on the price chart. By measuring RSI overbought/oversold conditions and confirming trend direction with TEMA, this tool helps traders identify high-probability entries and exits while filtering out noise in choppy markets.
Key Features
Stochastic RSI Calculation
Computes a standard RSI over a user-defined period (default 50).
Applies a Stochastic oscillator to the RSI values over a second user-defined period (default 50).
Smooths the %K line by taking an SMA over a third input (default 3), and %D is an SMA of %K over another input (default 3).
Defines oversold when both %K and %D are below 20, and overbought when both are above 80.
Triple EMA (TEMA)
Calculates three successive EMAs on the closing price with the same length (default 9).
Combines them using TEMA = 3×(EMA1 – EMA2) + EMA3, producing a fast-reacting trend line.
Bullish trend is identified when price > TEMA and TEMA is rising; bearish trend when price < TEMA and TEMA is falling; neutral/flat when TEMA change is minimal.
Signal Logic
Strong Buy: Previous bar’s Stoch RSI was oversold (both %K and %D < 20), %K crosses above %D, and TEMA is in a bullish trend.
Medium Buy: %K crosses above %D (without requiring oversold), TEMA is bullish, and previous %K < 50.
Weak Buy: Previous bar’s %K and %D were oversold, %K crosses above %D, TEMA is flat or bullish (not bearish).
Strong Sell: Previous bar’s Stoch RSI was overbought (both %K and %D > 80), %K crosses below %D, and TEMA is bearish.
Medium Sell: %K crosses below %D (without requiring overbought), TEMA is bearish, and previous %K > 50.
Weak Sell: Previous bar’s %K and %D were overbought, %K crosses below %D, TEMA is flat or bearish (not bullish).
Visual Elements on Chart
TEMA Line: Plotted in cyan (#00BCD4) with a medium-thick line for clear trend visualization.
Buy/Sell Markers:
BUY STRONG: Lime label below the candle
BUY MEDIUM: Green triangle below the candle
BUY WEAK: Semi-transparent green circle below the candle
SELL STRONG: Red label above the candle
SELL MEDIUM: Orange triangle above the candle
SELL WEAK: Semi-transparent orange circle above the candle
Candle & Background Coloring: When a strong buy or sell signal occurs, the candle body is tinted (semi-transparent lime/red) and the chart background briefly flashes light green (buy) or light red (sell).
Dynamic Support/Resistance:
On a strong buy signal, a green dot is plotted under that bar’s low as a temporary support marker.
On a strong sell signal, a red dot is plotted above that bar’s high as a temporary resistance marker.
Alerts
Strong Buy Alert: Triggered when Stoch RSI is oversold, %K crosses above %D, and TEMA is bullish.
Strong Sell Alert: Triggered when Stoch RSI is overbought, %K crosses below %D, and TEMA is bearish.
General Buy Alert: Triggered on any bullish crossover (%K > %D) when TEMA is not bearish.
General Sell Alert: Triggered on any bearish crossover (%K < %D) when TEMA is not bullish.
Inputs
Stochastic RSI Settings (group “Stochastic RSI”):
K (smoothK): Period length for smoothing the %K line (default 3, minimum 1)
D (smoothD): Period length for smoothing the %D line (default 3, minimum 1)
RSI Length (lengthRSI): Number of bars used for the RSI calculation (default 50, minimum 1)
Stochastic Length (lengthStoch): Number of bars for the Stochastic oscillator applied to RSI (default 50, minimum 1)
RSI Source (src): Price source for the RSI (default = close)
TEMA Settings (group “Triple EMA”):
TEMA Length (lengthTEMA): Number of bars used for each of the three EMAs (default 9, minimum 1)
How to Use
Add the Script
Copy and paste the indicator code into TradingView’s Pine Editor (version 6).
Save the script and add it to your chart as “Stochastic RSI + Triple EMA (StochTEMA).”
Adjust Inputs
Choose shorter lengths for lower timeframes (e.g., intraday scalping) and longer lengths for higher timeframes (e.g., swing trading).
Fine-tune the Stochastic RSI parameters (K, D, RSI Length, Stochastic Length) to suit the volatility of the instrument.
Modify TEMA Length if you prefer a faster or slower moving average response.
Interpret Signals
Primary Entries/Exits: Focus on “BUY STRONG” and “SELL STRONG” signals, as they require both oversold/overbought conditions and a confirming TEMA trend.
Confirmation Signals: Use “BUY MEDIUM”/“BUY WEAK” to confirm or add to an existing position when the market is trending. Similarly, “SELL MEDIUM”/“SELL WEAK” can be used to scale out or confirm bearish momentum.
Support/Resistance Dots: These help identify recent swing lows (green dots) and swing highs (red dots) that were tagged by strong signals—useful to place stop-loss or profit-target orders.
Set Alerts
Open the Alerts menu (bell icon) in TradingView, choose this script, and select the desired alert condition (e.g., “BUY Signal Strong”).
Configure notifications (popup, email, webhook) according to your trading workflow.
Notes & Best Practices
Filtering False Signals: By combining Stoch RSI crossovers with TEMA trend confirmation, most false breakouts during choppy price action are filtered out.
Timeframe Selection: This indicator works on all timeframes, but shorter timeframes may generate frequent signals—consider higher-timeframe confirmation when trading lower timeframes.
Risk Management: Always use proper position sizing and stop-loss placement. An “oversold” or “overbought” reading can remain extended for some time in strong trends.
Backtesting/Optimization: Before live trading, backtest different parameter combinations on historical data to find the optimal balance between sensitivity and reliability for your chosen instrument.
No Guarantee of Profits: As with any technical indicator, past performance does not guarantee future results. Use in conjunction with other forms of analysis (volume, price patterns, fundamentals).
Author: Your Name or Username
Version: 1.0 (Pine Script v6)
Published: June 2025
Feel free to customize input values and visual preferences. If you find bugs or have suggestions for improvements, open an issue or leave a comment below. Trade responsibly!

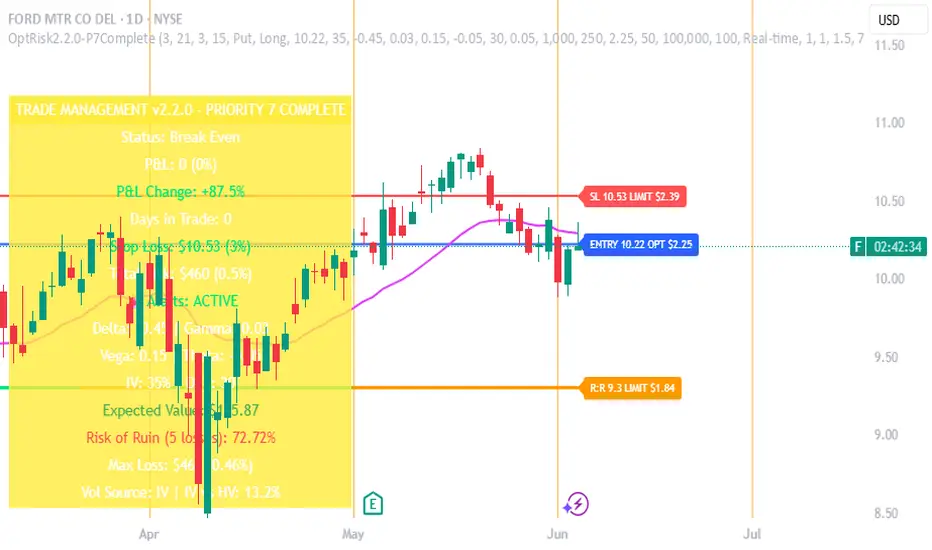
Options Risk Manager v2.2.0 - Priority 7 CompleteScript Description for TradingView Publication
Options Risk Manager v2.2.0 - Priority 7 Complete
What does this script do?
Options Risk Manager v2.2.0 is a comprehensive position management system designed specifically for options traders. The indicator calculates precise stop loss levels, risk/reward targets, and position sizing based on user-defined risk parameters. It provides real-time profit/loss tracking, options Greeks monitoring, and automated alert systems for critical price levels.
The script displays entry points, stop losses, and profit targets directly on the chart while continuously calculating position metrics including dollar risk, account exposure, and probability of success. Version 2.2.0 introduces Priority 7 advanced alerts with dynamic risk warnings and multi-condition notifications.
How does it do it?
The script performs several key calculations:
1. Risk-Based Stop Loss Calculation - Determines stop loss levels based on percentage of entry price, automatically adjusting for calls versus puts. Put positions place stops above entry, while calls place stops below.
2. Position Sizing Algorithm - Calculates optimal contract quantities using account size, risk
percentage, and stop distance to ensure consistent risk per trade regardless of underlying price.
3. Options-Specific P&L Tracking - Incorporates Delta, Gamma, Vega, and Theta to provide accurate profit/loss calculations for options positions, including time decay effects.
4. Three-Phase Trade Management - Implements systematic position management through Entry
Phase (initial risk), Profit Phase (approaching target), and Trailing Phase (EMA-based exit
management).
5. Multi-Level Alert System - Monitors price action, Greeks thresholds, time decay acceleration, and account risk levels to generate context-aware notifications.
How to use it?
Initial Setup:
1. Apply indicator to any optionable security
2. Toggle "In Position" ON when entering a trade
3. Set Direction (Call/Put) and Side (Long/Short)
4. Enter the underlying price at position entry
5. Specify number of contracts and risk percentage
Position Management:
Blue line shows entry price
Red line indicates stop loss level
Orange line displays risk/reward target
Purple EMA line activates after target hit
Monitor real-time P&L in trade panels
Alert Configuration:
Enable Advanced Alerts in settings
Set profit/loss notification thresholds
Configure Greek-based warnings
Activate time decay alerts for expiration
Risk Parameters:
Risk % determines stop distance from entry
Account Value sets position sizing limits
Contract Multiplier (standard = 100)
R:R Ratio defines profit targets
What makes it unique?
Options Risk Manager addresses the specific challenges of options trading that generic indicators miss. The script accounts for the inverse relationship in put options (profiting from price declines), incorporates Greeks for accurate P&L calculations, and provides options-specific limit orders for TradeStation integration.
The three-phase management system removes emotional decision-making by defining clear rules for position management. Phase transitions occur automatically based on price action, shifting from initial risk management to profit protection to trend-following modes.
Version 2.2.0's Priority 7 alert system provides intelligent notifications that include live metrics, risk warnings, and market context rather than simple price crosses.
Key Features Summary
Options-Specific Calculations - Proper handling of calls/puts with inverse relationships
Risk-Based Position Sizing - Consistent risk regardless of underlying price
Greeks Integration - Delta, Gamma, Vega, Theta for accurate tracking
Phase Management System - Systematic three-stage position handling
Advanced Alert System - Context-aware notifications with metrics
TradeStation Integration - Option limit orders for execution
Visual Risk Display - Clear chart overlays for all levels
Probability Calculator - Win/loss probability with expected value
Multi-Account Support - Scales from small to large accounts
Important Notes
This indicator requires manual input of option prices and Greeks (available from your broker's option chain). It functions as a risk management overlay and does not generate entry signals. The calculations assume standard options contracts of 100 shares.
Designed for TradeStation platform with full functionality. Basic features available on other platforms
without options data integration. Always verify calculations with your broker's risk system before placing
trades.
Strategy Builder With IndicatorsThis strategy script is designed for traders who enjoy building systems using multiple indicators.
Please note: This script does not include any built-in indicators. Instead, it works by referencing the plot outputs of the indicators you’ve already added to your chart.
For example, if you add a MACD and an ATR indicator to your chart, you can assign their plot values as inputs in the settings panel of this strategy.
• MACD as a trigger
• ATR as a filter
How Filters Work
Filters check whether certain conditions are met before a trade can be opened. For instance, if you set a filter like ATR > 30, then no trade will be executed unless that condition is true — even if the trigger fires.
All filters are linked, meaning every active filter must be satisfied for a trade to occur.
How Triggers Work
Triggers are what actually fire a trade signal — such as a moving average crossover or RSI breaking above a specific level. Unlike filters, triggers are independent. Only one active trigger needs to be true for the trade to execute.
Thanks to its modular structure, this strategy can be used with any indicator of your choice.
⸻
Risk Management Features
In the settings, you’ll find flexible options for:
• Stop Loss (SL)
• Trailing Stop Loss (TSL)
• Multi Take-Profit (TP)
These features enhance trade safety and let you tailor your risk management.
SL types available:
• Tick-based SL
• Percent-based SL
• ATR-based SL
Once you select your preferred SL type, you can fine-tune its distance using the offset field.
Trailing SL allows your stop to follow price as it moves in your favor — helping to lock in profits.
Multi-TP lets you take profits at two different levels, helping you secure gains while leaving room for extended moves.
Breakeven option is also available to automatically move your SL to entry after reaching a profit threshold.
⸻
How to Build a Solid Strategy
Let’s break down a good setup into three key components:
1. Trend Filter
Avoid trading against the trend — that’s like swimming against the current.
Use a filter like:
• Supertrend
• Momentum indicators
• Candlestick bias, etc.
Example: In this case, I used Supertrend and filtered for trades only if the price is above the uptrend line.
2. Trigger Condition
Once we confirm the trend is on our side, we need a trigger to execute at the right moment. This can be:
• RSI cross
• Candlestick patterns
• Trendline breaks
• Moving average crossovers, etc.
Example: I used RSI crossing above 50 as the entry trigger.
3. Risk Management
Even in the right trend at the right time — anything can happen. That’s why you should always define Stop Loss and Take Profit levels.
⸻
And there you have it! Your strategy is ready to backtest, refine, and deploy with alerts for live trading.
Questions or suggestions? Feel free to reach out

Dr.Avinash Talele quarterly earnings, VCP and multibagger trakerDr. Avinash Talele Quarterly Earnings, VCP and Multibagger Tracker.
📊 Comprehensive Quarterly Analysis Tool for Multibagger Stock Discovery
This advanced Pine Script indicator provides a complete financial snapshot directly on your chart, designed to help traders and investors identify potential multibagger stocks and VCP (Volatility Contraction Pattern) setups with precision.
🎯 Key Features:
📈 8-Quarter Financial Data Display:
EPS (Earnings Per Share) - Track profitability trends
Sales Revenue - Monitor business growth
QoQ% (Quarter-over-Quarter Growth) - Spot acceleration/deceleration
ROE (Return on Equity) - Assess management efficiency
OPM (Operating Profit Margin) - Evaluate operational excellence
💰 Market Metrics:
Market Cap - Current company valuation
P/E Ratio - Valuation assessment
Free Float - Liquidity indicator
📊 Technical Positioning:
% Down from 52-Week High - Identify potential bottoming patterns
% Up from 52-Week Low - Track momentum from lows
Turnover Data (1D & 50D Average) - Volume analysis
ADR% (Average Daily Range) - Volatility measurement
Relative Volume% - Institutional interest indicator
🚀 How It Helps Find Multibaggers:
1. Growth Acceleration Detection:
Consistent EPS Growth: Identifies companies with accelerating earnings
Revenue Momentum: Tracks sales growth patterns quarter-over-quarter
Margin Expansion: Spots improving operational efficiency through OPM trends
2. VCP Pattern Recognition:
Volatility Contraction: ADR% helps identify tightening price ranges
Volume Analysis: Relative volume shows institutional accumulation
Distance from Highs: Tracks healthy pullbacks in uptrends
3. Fundamental Strength Validation:
ROE Trends: Ensures management is efficiently using shareholder capital
Debt-Free Growth: High ROE with growing margins indicates quality growth
Scalability: Revenue growth vs. margin expansion analysis
4. Entry Timing Optimization:
52-Week Positioning: Enter near lows, avoid near highs
Volume Confirmation: High relative volume confirms breakout potential
Valuation Check: P/E ratio helps avoid overvalued entries
💡 Multibagger Characteristics to Look For:
✅ Consistent 15-20%+ EPS growth across multiple quarters
✅ Accelerating revenue growth with QoQ% improvements
✅ ROE above 15% and expanding
✅ Operating margins improving over time
✅ Low debt (indicated by high ROE with growing profits)
✅ Strong cash generation (reflected in consistent growth metrics)
✅ 20-40% down from 52-week highs (ideal entry zones)
✅ Above-average volume during consolidation phases
🎨 Visual Design:
Clean white table with black borders for maximum readability
Color-coded QoQ% changes (Green = Growth, Red = Decline)
Centered positioning for easy chart analysis
8-quarter historical view for trend identification
📋 Perfect For:
Long-term investors seeking multibagger opportunities
Growth stock enthusiasts tracking earnings acceleration
VCP pattern traders looking for breakout candidates
Fundamental analysts requiring quick financial snapshots
Swing traders timing entries in growth stocks
⚡ Quick Setup:
Simply add the indicator to any NSE/BSE stock chart and instantly view comprehensive quarterly data. The table updates automatically with the latest financial information, making it perfect for screening and monitoring your watchlist.
🔍 Start identifying your next multibagger today with this powerful combination of fundamental analysis and technical positioning data!
Disclaimer: This indicator is for educational and analysis purposes. Always conduct thorough research and consider risk management before making investment decisions.

Chaikin Momentum Scalper🎯 Overview
The Chaikin Momentum Scalper is a powerful trading strategy designed to identify momentum shifts in the market and ride the trend for maximum profits. This strategy is ideal for trading the USD/JPY currency pair on a 15-minute chart, making it perfect for high-frequency trading (HFT). Whether you’re starting with a small account of $1,000 or managing a larger portfolio, this strategy can scale to suit your needs.
________________________________________
🔑 How the Strategy Works
Here’s how the Chaikin Momentum Scalper identifies trade opportunities:
1️⃣ Momentum Detection
The core of this strategy is the Chaikin Oscillator, a tool that measures the flow of money into or out of a market. It helps us understand whether buyers (bulls) or sellers (bears) are in control.
• When the indicator crosses above zero, it signals that buying momentum is picking up – a buying opportunity.
• When the indicator crosses below zero, it signals that selling momentum is increasing – a selling opportunity.
2️⃣ Trend Confirmation
We don’t just jump into trades based on momentum alone. We also use a 200-period simple moving average (SMA) to confirm the overall trend.
• If the price is above the SMA, it confirms an uptrend, so we look for buy trades.
• If the price is below the SMA, it confirms a downtrend, so we look for sell trades.
This way, we align our trades with the broader market direction for higher success rates.
3️⃣ Volatility & Risk Management
We use a tool called the Average True Range (ATR) to measure market volatility. This helps us:
• Set a stop-loss (where we’ll exit the trade if the market moves against us) at a safe distance from our entry point.
• Set a take-profit (where we’ll lock in profits) at a target that’s larger than the stop-loss, ensuring a good reward-to-risk ratio.
This approach adapts to the market’s behavior, tightening stops in calmer conditions and widening them when volatility increases.
________________________________________
📈 Why This Strategy Works
✅ It combines momentum and trend-following principles, increasing the chances of trading in the right direction.
✅ It dynamically adjusts risk levels based on market volatility, keeping losses small and profits big.
✅ It’s scalable – perfect for both small accounts (like $1,000) and larger, corporate-sized portfolios.
✅ It has been deep-backtested on USD/JPY 15-minute charts, proving its consistency across different market conditions.
________________________________________
📝 Important Notes
📌 This strategy is best used for USD/JPY on a 15-minute chart, making it great for high-frequency trading while you continue to build and refine your trading system.
📌 It’s designed to work on both small ($1,000+) and large accounts, so it can grow with you as your capital increases.
📌 While it has passed deep backtesting on this pair and timeframe, remember that no strategy is perfect. It’s crucial to test it yourself, start with a demo account, and apply proper risk management before trading real money.
🌟 Final Thoughts
The Chaikin Momentum Scalper is a solid, adaptable trading approach combining momentum, trend direction, and volatility awareness. If you’re looking for a strategy to kick-start your trading journey—or to add to your existing system—it offers a strong foundation.

Grid Tendence V1The “Grid Tendence V1” strategy is based on the classic Grid strategy, only in this case the entries and exits are made in favor of the trend, which allows to take advantage of large movements to maximize profits, since it is also possible to enter and exit with the balance with a controlled risk, because precisely the distance between each Grid works as a natural and adaptable stop loss and take profit. This fact helps to avoid overlapping entries and exits that would result from using stop loss and take profit as limit orders.
In this version of the script the entries and exits are always at market, and based on the percentage change of the price, not on the profit or loss of the current position.
The user will notice that the strategy setup is based on a controlled risk, risking 5% on each trade, a fairly standard commission and a modest initial capital, all this in order to protect the user of the strategy from unexpected or unrealistic results.
However, it is always recommended to optimize the parameters so that the strategy is effective for each asset and for each time frame.

[blackcat] L2 Multi-Level Price Condition TrackerOVERVIEW
The L2 Multi-Level Price Condition Tracker represents an innovative approach to analyzing financial markets by simultaneously monitoring multiple price levels, thus providing traders with a holistic view of market dynamics. By combining dynamic calculations based on moving averages and price deviations, this tool aims to deliver precise and actionable insights into potential entry and exit points. It leverages sophisticated statistical measures to identify key thresholds that signify shifts in market sentiment, thereby aiding traders in making well-informed decisions. 🎯
Key benefits encompass:
• Comprehensive calculation of midpoints and average prices indicating short-term trend directions.
• Interactive visualization elements enhancing interpretability effortlessly.
• Real-time generation of buy/sell signals driven by precise condition evaluations.
TECHNICAL ANALYSIS COMPONENTS
📉 Midpoint Calculations:
Computes central reference points derived from high-low ranges establishing baseline supports/resistances.
Utilizes Simple Moving Averages (SMAs) along with standardized deviation formulas smoothing out volatility while preserving long-term trends accurately.
Facilitates identification of directional biases reflecting underlying market forces dynamically.
🕵️♂️ Advanced Price Level Detection:
Derives upper/lower bounds adjusting sensitivities adaptively responding to changing conditions flexibly.
Employs proprietary logic distinguishing between bullish/bearish sentiments promptly signaling transitions effectively.
Ensures consistent adherence to predefined statistical protocols maintaining accuracy robustly.
🎥 Dynamic Signal Generation:
Detects crossovers indicating dominance shifts between buyers/sellers promptly triggering timely alerts.
Integrates conditional logic reinforcing signal validity minimizing erroneous activations systematically.
Supports adaptive thresholds tuning sensitivities based on evolving market conditions flexibly accommodating varying scenarios.
INDICATOR FUNCTIONALITY
🔢 Core Algorithms:
Utilizes moving averages alongside standardized deviation formulas generating precise net volume measurements.
Implements Arithmetic Mean Line Algorithm (AMLA) smoothing techniques improving interpretability.
Ensures consistent alignment with established statistical principles preserving fidelity.
🖱️ User Interface Elements:
Dedicated plots displaying real-time midpoint markers facilitating swift decision-making.
Context-sensitive color coding distinguishing positive/negative deviations intuitively highlighting key activations clearly.
Background shading emphasizing proximity to crucial threshold activations enhancing visibility focusing attention on vital signals promptly.
STRATEGY IMPLEMENTATION
✅ Entry Conditions:
Confirm bullish/bearish setups validated through multiple confirmatory signals assessing concurrent market sentiment factors.
Validate entry decisions considering alignment between calculated midpoints and broader trend directions ensuring coherence.
Monitor cumulative breaches signifying potential trend reversals executing partial/total closes contingent upon predetermined loss limits preserving capital efficiently.
🚫 Exit Mechanisms:
Trigger exits upon hitting predefined thresholds derived from historical analyses promptly executing closures.
Execute partial/total closes contingent upon cumulative loss limits preserving capital efficiently managing exposures prudently.
Conduct periodic reviews gauging strategy effectiveness rigorously identifying areas needing refinement implementing corrective actions iteratively enhancing performance metrics steadily.
PARAMETER CONFIGURATIONS
🎯 Optimization Guidelines:
Lookback Period: Governs responsiveness versus stability balancing sensitivity/stability governing moving averages aligning with preferred granularity.
Price Source: Dictates primary data series driving volume calculations selecting relevant inputs accurately tailoring strategies accordingly.
💬 Customization Recommendations:
Commence with baseline defaults; iteratively refine parameters isolating individual impacts evaluating adjustments independently prior to combined modifications minimizing disruptions.
Prioritize minimizing erroneous trigger occurrences first optimizing signal fidelity sustaining balanced risk-reward profiles irrespective of chosen settings upholding disciplined approaches preserving capital efficiently.
ADVANCED RISK MANAGEMENT
🛡️ Proactive Risk Mitigation Techniques:
Enforce strict compliance with pre-defined maximum leverage constraints adhering strictly to guidelines managing exposures prudently.
Mandatorily apply trailing stop-loss orders conforming to script outputs enforcing discipline rigorously preventing adverse consequences.
Allocate positions proportionately relative to available capital reserves conducting periodic reviews gauging effectiveness continuously identifying improvement opportunities steadily.
⚠️ Potential Pitfalls & Solutions:
Address frequent violations arising during heightened volatility phases necessitating manual interventions judiciously preparing contingency plans proactively mitigating risks effectively.
Manage false alerts warranting immediate attention avoiding adverse consequences systematically implementing corrective actions reliably.
Prepare proactive responses amid adverse movements ensuring seamless functionality amidst fluctuating conditions fortifying resilience against anomalies robustly.
PERFORMANCE MONITORING METRICS
🔍 Evaluation Criteria:
Assess win percentages consistently across diverse trading instruments gauging reliability measuring profitability efficiency accurately evaluating downside risks comprehensively uncovering systematic biases potentially skewing outcomes.
Calculate average profit ratios per successful execution benchmarking actual vs expected performances documenting results meticulously tracking progress dynamically addressing identified shortcomings proactively fostering continuous improvements.
📈 Historical Data Analysis Tools:
Maintain detailed logs capturing every triggered event recording realized profits/losses comparing simulated projections accurately identifying discrepancies warranting investigation implementing iterative refinements steadily enhancing performance metrics progressively.
Identify recurrent systematic errors demanding corrective actions implementing iterative refinements steadily addressing identified shortcomings proactively fostering continuous enhancements dynamically improving robustness resiliently.
PROBLEM SOLVING ADVICE
🔧 Frequent Encountered Challenges:
Unpredictable behaviors emerging within thinly traded markets requiring filtration processes enhancing signal integrity excluding low-liquidity assets prone to erratic movements effectively.
Latency issues manifesting during abrupt price fluctuations causing missed opportunities introducing buffer intervals safeguarding major news/event impacts mitigating distortions seamlessly verifying reliable connections ensuring uninterrupted data flows guaranteeing accurate interpretations dependably.
💡 Effective Resolution Pathways:
Limit ongoing optimization attempts preventing model degradation maintaining optimal performance levels consistently recalibrating parameters periodically adapting strategies flexibly responding appropriately amidst varying conditions dynamically improving robustness resiliently.
Verify reliable connections ensuring uninterrupted data flows guaranteeing accurate interpretations dependably bolstering overall efficacy systematically addressing identified shortcomings dynamically fostering continuous advancements.
THANKS
Heartfelt acknowledgment extends to all developers contributing invaluable insights regarding multi-level price condition-based trading methodologies! ✨

[blackcat] L1 Net Volume DifferenceOVERVIEW
The L1 Net Volume Difference indicator serves as an advanced analytical tool designed to provide traders with deep insights into market sentiment by examining the differential between buying and selling volumes over precise timeframes. By leveraging these volume dynamics, it helps identify trends and potential reversal points more accurately, thereby supporting well-informed decision-making processes. The key focus lies in dissecting intraday changes that reflect short-term market behavior, offering critical input for both swing and day traders alike. 📊
Key benefits encompass:
• Precise calculation of net volume differences grounded in real-time data.
• Interactive visualization elements enhancing interpretability effortlessly.
• Real-time generation of buy/sell signals driven by dynamic volume shifts.
TECHNICAL ANALYSIS COMPONENTS
📉 Volume Accumulation Mechanisms:
Monitors cumulative buy/sell volumes derived from comparative closing prices.
Periodically resets accumulation counters aligning with predefined intervals (e.g., 5-minute bars).
Facilitates identification of directional biases reflecting underlying market forces accurately.
🕵️♂️ Sentiment Detection Algorithms:
Employs proprietary logic distinguishing between bullish/bearish sentiments dynamically.
Ensures consistent adherence to predefined statistical protocols maintaining accuracy.
Supports adaptive thresholds adjusting sensitivities based on changing market conditions flexibly.
🎯 Dynamic Signal Generation:
Detects transitions indicating dominance shifts between buyers/sellers promptly.
Triggers timely alerts enabling swift reactions to evolving market dynamics effectively.
Integrates conditional logic reinforcing signal validity minimizing erroneous activations.
INDICATOR FUNCTIONALITY
🔢 Core Algorithms:
Utilizes moving averages along with standardized deviation formulas generating precise net volume measurements.
Implements Arithmetic Mean Line Algorithm (AMLA) smoothing techniques improving interpretability.
Ensures consistent alignment with established statistical principles preserving fidelity.
🖱️ User Interface Elements:
Dedicated plots displaying real-time net volume markers facilitating swift decision-making.
Context-sensitive color coding distinguishing positive/negative deviations intuitively.
Background shading highlighting proximity to key threshold activations enhancing visibility.
STRATEGY IMPLEMENTATION
✅ Entry Conditions:
Confirm bullish/bearish setups validated through multiple confirmatory signals.
Validate entry decisions considering concurrent market sentiment factors.
Assess alignment between net volume readings and broader trend directions ensuring coherence.
🚫 Exit Mechanisms:
Trigger exits upon hitting predetermined thresholds derived from historical analyses.
Monitor continuous breaches signifying potential trend reversals promptly executing closures.
Execute partial/total closes contingent upon cumulative loss limits preserving capital efficiently.
PARAMETER CONFIGURATIONS
🎯 Optimization Guidelines:
Reset Interval: Governs responsiveness versus stability balancing sensitivity/stability.
Price Source: Dictates primary data series driving volume calculations selecting relevant inputs accurately.
💬 Customization Recommendations:
Commence with baseline defaults; iteratively refine parameters isolating individual impacts.
Evaluate adjustments independently prior to combined modifications minimizing disruptions.
Prioritize minimizing erroneous trigger occurrences first optimizing signal fidelity.
Sustain balanced risk-reward profiles irrespective of chosen settings upholding disciplined approaches.
ADVANCED RISK MANAGEMENT
🛡️ Proactive Risk Mitigation Techniques:
Enforce strict compliance with pre-defined maximum leverage constraints adhering strictly to guidelines.
Mandatorily apply trailing stop-loss orders conforming to script outputs reinforcing discipline.
Allocate positions proportionately relative to available capital reserves managing exposures prudently.
Conduct periodic reviews gauging strategy effectiveness rigorously identifying areas needing refinement.
⚠️ Potential Pitfalls & Solutions:
Address frequent violations arising during heightened volatility phases necessitating manual interventions judiciously.
Manage false alerts warranting immediate attention avoiding adverse consequences systematically.
Prepare contingency plans mitigating margin call possibilities preparing proactive responses effectively.
Continuously assess automated system reliability amidst fluctuating conditions ensuring seamless functionality.
PERFORMANCE AUDITS & REFINEMENTS
🔍 Critical Evaluation Metrics:
Assess win percentages consistently across diverse trading instruments gauging reliability.
Calculate average profit ratios per successful execution measuring profitability efficiency accurately.
Measure peak drawdown durations alongside associated magnitudes evaluating downside risks comprehensively.
Analyze signal generation frequencies revealing hidden patterns potentially skewing outcomes uncovering systematic biases.
📈 Historical Data Analysis Tools:
Maintain comprehensive records capturing every triggered event meticulously documenting results.
Compare realized profits/losses against backtested simulations benchmarking actual vs expected performances accurately.
Identify recurrent systematic errors demanding corrective actions implementing iterative refinements steadily.
Document evolving performance metrics tracking progress dynamically addressing identified shortcomings proactively.
PROBLEM SOLVING ADVICE
🔧 Frequent Encountered Challenges:
Unpredictable behaviors emerging within thinly traded markets requiring filtration processes.
Latency issues manifesting during abrupt price fluctuations causing missed opportunities.
Overfitted models yielding suboptimal results post-extensive tuning demanding recalibrations.
Inaccuracies stemming from incomplete/inaccurate data feeds necessitating verification procedures.
💡 Effective Resolution Pathways:
Exclude low-liquidity assets prone to erratic movements enhancing signal integrity.
Introduce buffer intervals safeguarding major news/event impacts mitigating distortions effectively.
Limit ongoing optimization attempts preventing model degradation maintaining optimal performance levels consistently.
Verify reliable connections ensuring uninterrupted data flows guaranteeing accurate interpretations reliably.
USER ENGAGEMENT SEGMENT
🤝 Community Contributions Welcome
Highly encourage active participation sharing experiences & recommendations!
THANKS
Heartfelt acknowledgment extends to all developers contributing invaluable insights about volume-based trading methodologies! ✨

Smart Fib StrategySmart Fibonacci Strategy
This advanced trading strategy combines the power of adaptive SMA entries with Fibonacci-based exit levels to create a comprehensive trend-following system that self-optimizes based on historical market conditions. Credit goes to Julien_Eche who created the "Best SMA Finder" which received an Editors Pick award.
Strategy Overview
The Smart Fibonacci Strategy employs a two-pronged approach to trading:
1. Intelligent Entries: Uses a self-optimizing SMA (Simple Moving Average) to identify optimal entry points. The system automatically tests multiple SMA lengths against historical data to determine which period provides the most robust trading signals.
2. Fibonacci-Based Exits: Implements ATR-adjusted Fibonacci bands to establish precise exit targets, with risk-management options ranging from conservative to aggressive.
This dual methodology creates a balanced system that adapts to changing market conditions while providing clear visual reference points for trade management.
Key Features
- **Self-Optimizing Entries**: Automatically calculates the most profitable SMA length based on historical performance
- **Adjustable Risk Parameters**: Choose between low-risk and high-risk exit targets
- **Directional Flexibility**: Trade long-only, short-only, or both directions
- **Visualization Tools**: Customizable display of entry lines and exit bands
- **Performance Statistics**: Comprehensive stats table showing key metrics
- **Smoothing Option**: Reduces noise in the Fibonacci bands for cleaner signals
Trading Rules
Entry Signals
- **Long Entry**: When price crosses above the blue center line (optimal SMA)
- **Short Entry**: When price crosses below the blue center line (optimal SMA)
### Exit Levels
- **Low Risk Option**: Exit at the first Fibonacci band (1.618 * ATR)
- **High Risk Option**: Exit at the second Fibonacci band (2.618 * ATR)
Strategy Parameters
Display Settings
- Toggle visibility of the stats table and indicator components
Strategy Settings
- Select trading direction (long, short, or both)
- Choose exit method (low risk or high risk)
- Set minimum trades threshold for SMA optimization
SMA Settings
- Option to use auto-optimized or fixed-length SMA
- Customize SMA length when using fixed option
Fibonacci Settings
- Adjust ATR period and SMA basis for Fibonacci bands
- Enable/disable smoothing function
- Customize Fibonacci ratio multipliers
Appearance Settings
- Modify colors, line widths, and transparency
Optimization Methodology
The strategy employs a sophisticated optimization algorithm that:
1. Tests multiple SMA lengths against historical data
2. Evaluates performance based on trade count, profit factor, and win rate
3. Calculates a "robustness score" that balances profitability with statistical significance
4. Selects the SMA length with the highest robustness score
This ensures that the strategy's entry signals are continuously adapting to the most effective parameters for current market conditions.
Risk Management
Position sizing is fixed at $2,000 per trade, allowing for consistent exposure across all trading setups. The Fibonacci-based exit system provides two distinct risk management approaches:
- **Conservative Approach**: Using the first Fibonacci band for exits produces more frequent but smaller wins
- **Aggressive Approach**: Using the second Fibonacci band allows for larger potential gains at the cost of increased volatility
Ideal Usage
This strategy is best suited for:
- Trending markets with clear directional moves
- Timeframes from 4H to Daily for most balanced results
- Instruments with moderate volatility (stocks, forex, commodities)
Traders can further enhance performance by combining this strategy with broader market analysis to confirm the prevailing trend direction.

[blackcat] L2 Z-Score of PriceOVERVIEW
The L2 Z-Score of Price indicator offers traders an insightful perspective into how current prices diverge from their historical norms through advanced statistical measures. By leveraging Z-scores, it provides a robust framework for identifying potential reversals in financial markets. The Z-score quantifies the number of standard deviations that a data point lies away from the mean, thus serving as a critical metric for recognizing overbought or oversold conditions. 🎯
Key benefits encompass:
• Precise calculation of Z-scores reflecting true price deviations.
• Interactive plotting features enhancing visual clarity.
• Real-time generation of buy/sell signals based on crossover events.
STATISTICAL ANALYSIS COMPONENTS
📉 Mean Calculation:
Utilizes Simple Moving Averages (SMAs) to establish baseline price references.
Provides smooth representations filtering short-term noise preserving long-term trends.
Fundamental for deriving subsequent deviation metrics accurately.
📈 Standard Deviation Measurement:
Quantifies dispersion around established means revealing underlying variability.
Crucial for assessing potential volatility levels dynamically adapting strategies accordingly.
Facilitates precise Z-score derivations ensuring statistical rigor.
🕵️♂️ Z-SCORE DETECTION:
Measures standardized distances indicating relative positions within distributions.
Helps pinpoint extreme conditions signaling impending reversals proactively.
Enables early identification of trend exhaustion phases prompting timely actions.
INDICATOR FUNCTIONALITY
🔢 Core Algorithms:
Integrates SMAs along with standardized deviation formulas generating precise Z-scores.
Employs Arithmetic Mean Line Algorithm (AMLA) smoothing techniques improving interpretability.
Ensures consistent adherence to predefined statistical protocols maintaining accuracy.
🖱️ User Interface Elements:
Dedicated plots displaying real-time Z-score markers facilitating swift decision-making.
Context-sensitive color coding distinguishing positive/negative deviations intuitively.
Background shading highlighting proximity to key threshold activations enhancing visibility.
STRATEGY IMPLEMENTATION
✅ Entry Conditions:
Confirm bullish/bearish setups validated through multiple confirmatory signals.
Validate entry decisions considering concurrent market sentiment factors.
Assess alignment between Z-score readings and broader trend directions ensuring coherence.
🚫 Exit Mechanisms:
Trigger exits upon hitting predetermined thresholds derived from historical analyses.
Monitor continuous breaches signifying potential trend reversals promptly executing closures.
Execute partial/total closes contingent upon cumulative loss limits preserving capital efficiently.
PARAMETER CONFIGURATIONS
🎯 Optimization Guidelines:
Length: Governs responsiveness versus smoothing trade-offs balancing sensitivity/stability.
Price Source: Dictates primary data series driving Z-score computations selecting relevant inputs accurately.
💬 Customization Recommendations:
Commence with baseline defaults; iteratively refine parameters isolating individual impacts.
Evaluate adjustments independently prior to combined modifications minimizing disruptions.
Prioritize minimizing erroneous trigger occurrences first optimizing signal fidelity.
Sustain balanced risk-reward profiles irrespective of chosen settings upholding disciplined approaches.
ADVANCED RISK MANAGEMENT
🛡️ Proactive Risk Mitigation Techniques:
Enforce strict compliance with pre-defined maximum leverage constraints adhering strictly to guidelines.
Mandatorily apply trailing stop-loss orders conforming to script outputs reinforcing discipline.
Allocate positions proportionately relative to available capital reserves managing exposures prudently.
Conduct periodic reviews gauging strategy effectiveness rigorously identifying areas needing refinement.
⚠️ Potential Pitfalls & Solutions:
Address frequent violations arising during heightened volatility phases necessitating manual interventions judiciously.
Manage false alerts warranting immediate attention avoiding adverse consequences systematically.
Prepare contingency plans mitigating margin call possibilities preparing proactive responses effectively.
Continuously assess automated system reliability amidst fluctuating conditions ensuring seamless functionality.
PERFORMANCE AUDITS & REFINEMENTS
🔍 Critical Evaluation Metrics:
Assess win percentages consistently across diverse trading instruments gauging reliability.
Calculate average profit ratios per successful execution measuring profitability efficiency accurately.
Measure peak drawdown durations alongside associated magnitudes evaluating downside risks comprehensively.
Analyze signal generation frequencies revealing hidden patterns potentially skewing outcomes uncovering systematic biases.
📈 Historical Data Analysis Tools:
Maintain comprehensive records capturing every triggered event meticulously documenting results.
Compare realized profits/losses against backtested simulations benchmarking actual vs expected performances accurately.
Identify recurrent systematic errors demanding corrective actions implementing iterative refinements steadily.
Document evolving performance metrics tracking progress dynamically addressing identified shortcomings proactively.
PROBLEM SOLVING ADVICE
🔧 Frequent Encountered Challenges:
Unpredictable behaviors emerging within thinly traded markets requiring filtration processes.
Latency issues manifesting during abrupt price fluctuations causing missed opportunities.
Overfitted models yielding suboptimal results post-extensive tuning demanding recalibrations.
Inaccuracies stemming from incomplete/inaccurate data feeds necessitating verification procedures.
💡 Effective Resolution Pathways:
Exclude low-liquidity assets prone to erratic movements enhancing signal integrity.
Introduce buffer intervals safeguarding major news/event impacts mitigating distortions effectively.
Limit ongoing optimization attempts preventing model degradation maintaining optimal performance levels consistently.
Verify reliable connections ensuring uninterrupted data flows guaranteeing accurate interpretations reliably.
USER ENGAGEMENT SEGMENT
🤝 Community Contributions Welcome
Highly encourage active participation sharing experiences & recommendations!
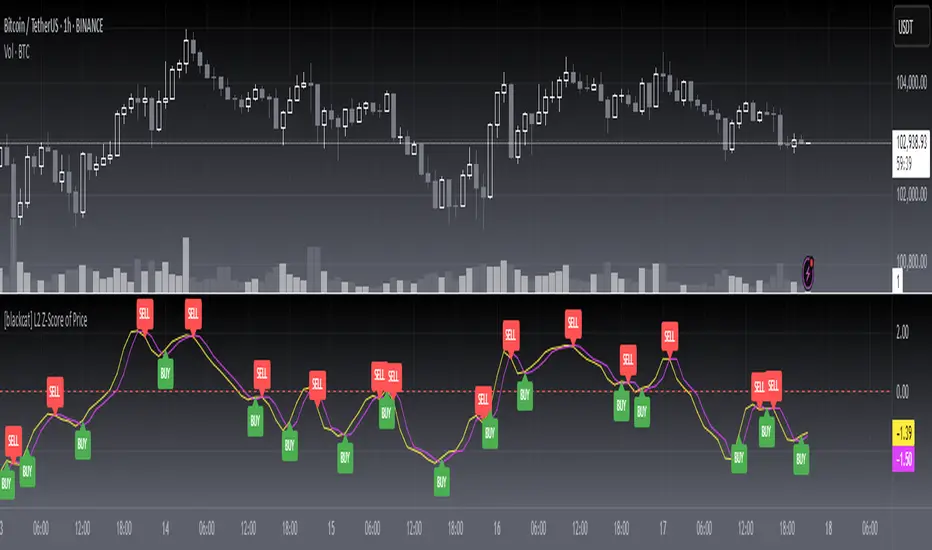
Best SMA FinderThis script, Best SMA Finder, is a tool designed to identify the most robust simple moving average (SMA) length for a given chart, based on historical backtest performance. It evaluates hundreds of SMA values (from 10 to 1000) and selects the one that provides the best balance between profitability, consistency, and trade frequency.
What it does:
The script performs individual backtests for each SMA length using either "Long Only" or "Buy & Sell" logic, as selected by the user. For each tested SMA, it computes:
- Total number of trades
- Profit Factor (total profits / total losses)
- Win Rate
- A composite Robustness Score, which integrates Profit Factor, number of trades (log-scaled), and win rate.
Only SMA configurations that meet the user-defined minimum trade count are considered valid. Among all valid candidates, the script selects the SMA length with the highest robustness score and plots it on the chart.
How to use it:
- Choose the strategy type: "Long Only" or "Buy & Sell"
- Set the minimum trade count to filter out statistically irrelevant results
- Enable or disable the summary stats table (default: enabled)
The selected optimal SMA is plotted on the chart in blue. The optional table in the top-right corner shows the corresponding SMA length, trade count, Profit Factor, Win Rate, and Robustness Score for transparency.
Key Features:
- Exhaustive SMA optimization across 991 values
- Customizable trade direction and minimum trade filters
- In-chart visualization of results via table and plotted optimal SMA
- Uses a custom robustness formula to rank SMA lengths
Use cases:
Ideal for traders who want to backtest and auto-select a historically effective SMA without manual trial-and-error. Useful for swing and trend-following strategies across different timeframes.
📌 Limitations:
- Not a full trading strategy with position sizing or stop-loss logic
- Only one entry per direction at a time is allowed
- Designed for exploration and optimization, not as a ready-to-trade system
This script is open-source and built entirely from original code and logic. It does not replicate any closed-source script or reuse significant external open-source components.

MÈGAS ALGO : CNA (Cognitio Analysis) [INDICATOR]Overview
The CNA (Cognitio Analysis) is a comprehensive financial analysis tool designed to evaluate the overall health and potential of a market or company based on fundamental metrics. It aggregates data across five key metric groups—**Growth**, **Profitability**, **Cash Flow**, **Income**, and **Valuation**—to provide a final interpretation of market conditions. The indicator dynamically adapts to the selected fiscal period (Quarter, Year, or Trailing Twelve Months) and delivers insights into dominant trends and conflicting signals.
Key Features
1. Customizable Fiscal Period:
- Users can select between "Quarter", "Year", or "Trailing Twelve Months" (TTM) to analyze data for their desired timeframe.
2. Dynamic Table Visualization:
- Displays raw metric values, aggregated scores, and the final interpretation in an intuitive
table.
- Highlights the final interpretation with dynamic background colors (`color.teal` for bullish,
`color.red` for bearish, etc.).
3. Comprehensive Data Integration:
- Pulls financial data using TradingView's `request.financial()` function for metrics like
revenue, earnings, margins, and valuation ratios.
4. Normalization and Scoring:
- Normalizes data to create a consistent scoring system, ensuring accurate comparisons across
metrics.
How It Works
1. Metric Group Analysis
- Growth Metrics: Measures revenue growth, earnings per share (EPS) growth, and tax
efficiency.
- Profitability Metrics: Analyzes net profit margin, return on equity (ROE), and EBITDA margin.
- Cash Metrics: Assesses operating cash flow margin, free cash flow to operating cash flow
ratio, and cash flow coverage.
- Income Metrics: Examines gross profit margin, operating profit margin, and EBIT margin.
- Valuation Metrics: Evaluates price-to-earnings (P/E), price-to-sales (P/S), and enterprise
value-to-EBITDA (EV/EBITDA).
2. Dynamic Scoring System
- Metrics are normalized to ensure consistency across different scales.
- A geometric mean is used to calculate scores for each metric group, ensuring that all metrics
within a group contribute equally to the final score.
3. Dominant Trend Identification
- Scores from all five metric groups are aggregated to determine the **dominant trend** of the
market.
- The dominant trend is categorized as:
- Bullish: Strong fundamentals across most metrics.
- Bearish: Weak fundamentals across most metrics.
- Neutral: Balanced conditions with no clear direction.
- Unclear: Mixed signals dominate, requiring further monitoring.
4. Conflicting Signals Interpretation
- The indicator identifies scenarios where metrics conflict (e.g., high growth but low valuation).
- These conflicting signals provide nuanced insights into market conditions, highlighting rare opportunities or potential risks.
How to Use the Indicator
1. Select Fiscal Period:
- Choose between "FQ", "FY", or "TTM" to analyze data for the desired timeframe.
2. Review Metric Scores:
- Examine the scores for each metric group (Growth, Profitability, Cash, Income, Valuation) to
understand the underlying performance.
3. Interpret Final Output:
- The final interpretation provides a summary of the dominant trend and conflicting signals,
helping users make informed decisions.
4. Dynamic Coloring:
- Use the dynamic background colors in the table to quickly identify market sentiment
(bullish, bearish, neutral, or mixed).
Applications
- Identifying Opportunities:
- Look for bullish dominant trends combined with undervalued growth opportunities for
potential long positions.
- Avoiding Risks:
- Watch out for bearish dominant trends with overvaluation alerts to avoid potential losses.
- Monitoring Neutral Markets:
- Use the indicator to identify neutral markets and wait for clearer signals before making
decisions.
Conclusion
The CNA (Cognitio Analysis) is a powerful tool for traders and investors seeking to make informed decisions based on fundamental analysis. By combining detailed metric evaluations, dynamic scoring, and sentiment-based interpretations, this indicator provides a comprehensive view of market conditions. Whether you're identifying undervalued opportunities, avoiding overvalued risks, or monitoring neutral markets, this indicator equips you with the insights needed to navigate complex financial landscapes.
Please Note:
This indicator is provided for informational and educational purposes only. It is not financial advice, and it should not be considered a recommendation to buy, sell, or trade any financial instrument. Trading involves significant risks, including the potential loss of your entire investment. Always conduct your own research and consult with a licensed financial advisor before making any trading decisions.
The results and images provided are based on algorithms and historical/paid real-time market data but do not guarantee future results or accuracy. Use this tool at your own risk, and understand that past performance is not indicative of future outc
