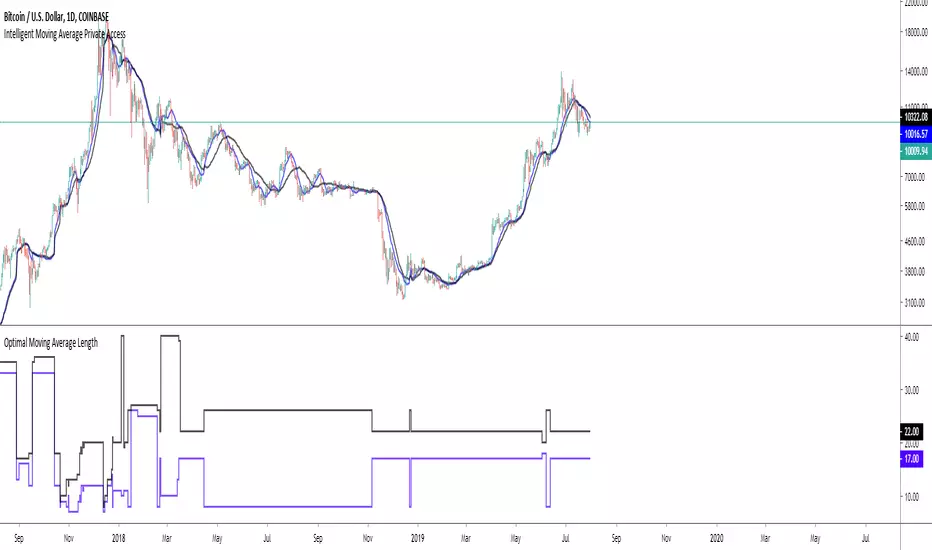
Intelligent Moving Average Private AccessNote: This indicator is intended for those who have been granted private access and may be more frequently updated than the previous versions.
Introduction
This indicator uses machine learning (Artificial Intelligence) to solve a real human problem.
The Moving Average is the most used indicator on the planet, yet no one really knows what pair of moving average lengths works best in combination with each other.
A reason for this is because no two moving averages are always going to be the best on every instrument, time-frame, and at any given point in time.
The " Intelligent Moving Average " solves the moving average problem by adapting the period length to match the most profitable combination of moving averages in real time.
How does the Intelligent Moving Average work?
The artificial intelligence that operates these moving average lengths was created by an algorithm that tests every single combination across the entire chart history of an instrument for maximum profitability in real-time.
No matter what happens, the combination of these moving averages will be the most profitable.
Can we learn from the Intelligent Moving Average?
There are many lessons to be learned from the Intelligent Moving Average. Most will come with time as it is still a new concept.
Adopting the usefulness of this AI will change how we perceive moving averages to work.
Limitations
Ultimately, there are no limiting factors within the range of combinations that has been programmed. The moving averages will operate normally, but may change lengths in unexpected ways - maybe it knows something we don't?
Thresholds
The range of moving average lengths is between 5 to 40.
Additional coverage resulted in TradingView server errors.
Future Updates!
This indicator will be maintained and many updates will come in the near future! Stay tuned.
View the documentation on this indicator here: www.kenzing.com
在腳本中搜尋"profit"
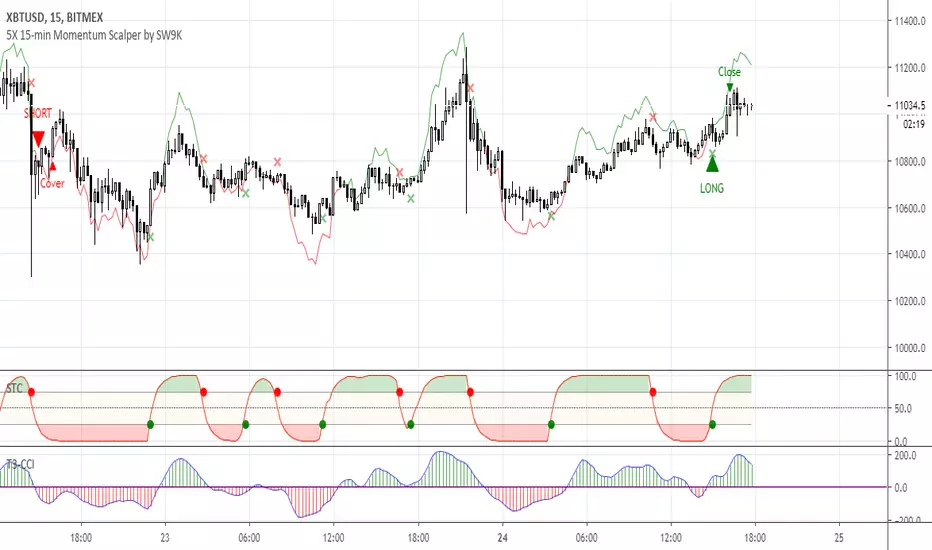
5X 15-min Momentum Scalper by SW9KThis is the alpha release-candidate study script with indicator alerts included. It is currently open for select individuals to test.
The core of this momentum scalper is primarily based on a modified Schaff Trend (which in itself is based on Stochastic elements and MACD) and a modified T3-CCI oscillator, specifically calibrated for 15-minute type movements -- do not apply to any other timeframes. Although it will take small scalps, it is designed to recognize when to ride out underwater positions so use maximum leverage or 5X or you may risk liquidation. Also, there is a stop loss setting feature, but it may reduce profits and win rate.
You can verify the highly accurate 75% win rate performance statistics with 100,000 XBTUSD contracts simulated at .
Features:
40% 3-month net profit, 74.48% win rate, 2.988 profit factor, 3.13% max drawdown, adjusted Sharpe ratio of ~3
Optimized for 15 minute timeframe scalping
Attempts to recognize when to keep position open and ride them out into profitable or breakeven
Profitable even with full Bitmex taker fees (0.075%)
Pyramiding Setting (default 3)
Aggressive Mode to increase entries and potential profits at higher risk
Easy-to-set binary Alerts
Follow SW9K at www.twitter.com
[HTI] Hiubris Trend Indicator 1.4Hiubris Trend Indicator is super easy to use.
The Indicator includes Long and Short signals on chart, based on the current Trend direction - These signals can be also set up as Alerts.
It also includes multiple partial Exit Points (Take Profits) that can be used to lock in the profit you have made - These signals can be also set up as Alerts.
The Take Profits have a custom input that can be adjusted by the user regarding the frequency of the take profits - (The risk involved in each trade)
The indicator has a special Stop Loss feature that activates after a certain custom number of Take Profit points passed, locking down your profits you have made so far - These signals can be also set up as Alerts.
Hiubris Trend Indicator is very profitable on higher timeframes (45min, 2h, 4h) - It can also be used on lower timeframes, together with another HigherTimeframe Trend indicator, acting as a filter for the alerts (Ex: Hiubris Long Term Trend)

ALPHA: ReversalWhat is a divergence?
In the case of strength and momentum indicators, it is when the price deviates from the movement of the oscillator, it can have significant implications for trade management.
Divergences in an uptrend occurs when the price makes a higher high but the indicator does not. In a downtrend, divergence occurs when the price makes a lower low, but the indicator does not. When a divergence is spotted, there is a higher probability of a price reversal.
Divergences helps the trader recognize and react appropriately to a change in price action. It tells us something is changing and the trader must make a decision, such as tighten the stop-loss or take profit. Seeing divergences increases profitability by alerting the trader to protect profits or open a position.
Divergences indicate that something is changing, but it does not automatically mean the trend will reverse. It signals the trader must consider holding, tightening the stop loss, opening a position or take profit.
Introduction
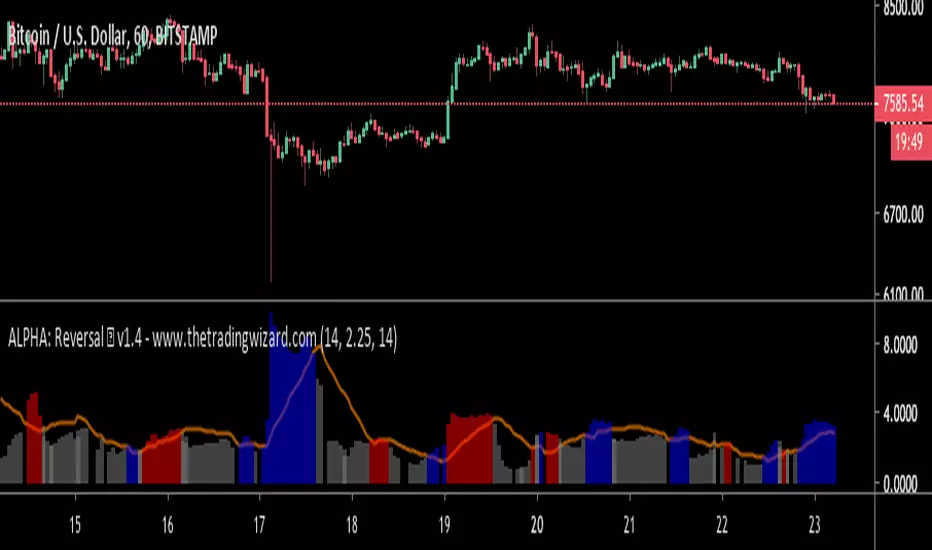
The Alpha: Reversal is an indicator based off of the Stochastic, Relative Strength Index and Momentum indicator. Its sole purpose is to be able to identify divergences when they matter and identify high probability reversal areas. The formula used between the three indicators will be kept proprietary, in addition to the slight changes made on the Stochastic formula. The indicator plots the histogram with a divergence formula within a 14 period look-back on default. Additionally, there is a moving average of the histograms movement to identify the divergences when they matter.
Divergences exist on just about every candle, most of the time they are at a minuscule level. Rarely do the price and oscillator movement collude, the question becomes when do these divergences matter?
With that in mind I approached the task of finding a reliable reversal model. On default, the indicator has a moving average that measures the past histogram (the formula of the three indicators) movement to identify when a high potential trend shift may happen.
Keeping volatility in mind there is a feature called "Fixed Threshold" in settings. Various assets move at different speeds, so the indicator needs the ability to adjust to fit the assets speed. This "Threshold" option does not have a set of rules to use for each asset, the option is there though, so it may be adjusted by the analyst manually if the histogram moving average seems inaccurate due to volatility or lack thereof. In future publications (or possibly indicator updates) I plan on expanding on a fixed set of rules for various assets. This will take considerable time to research and backtest the various values needed for an asset's speed, so for now the default MA can be used until you are comfortable with adjusting the threshold level manually.
The look-back period on the histogram and threshold MA can be adjusted to whichever time period you would like. However, the default 14 is typically what is best considering the inputs of the three underlying indicators.
Analysis
The indicator is actually quite simple to read. When the price spikes blue, there is a high probability of reversal, same goes for red but in the opposite fashion. Now as always, you should use this indicator as an analysis tool and not rely on it by itself. Many times Cryptocurrencies couldn't care less about strength or oversold/overbought and volume explodes out of nowhere, I highly recommend you use price action in addition to Alpha: Exhaustion and Alpha: Volume with this tool. Oh wait, Alpha: Volume is not out yet.... SOON. :)
Point is, use proper analysis techniques with this indicator, nothing is perfect. NOTHING. But the Alpha: Reversal is a great tool to use for not only the beginner trader, but the advanced also. There is a ton of ways to use this indicator beyond the high probability reversal areas, I am discovering some really neat patterns within my new formula that I plan on expanding on in future publications, i.e. dead cat bounces and relief candles plus a few more.
Conclusion
The Alpha: Reversal is a great analysis tool that I now use on all my charts, as time goes on I plan on holding classes for its users on a regular basis to expand on the various techniques that can be implemented in addition to publishing research relevant to its purpose.
Access to the indicator can be purchased on my site www.thetradingwizard.com with either a monthly option for this & the Alpha: Exhaustion (), or a lifetime subscription independently. All updates and changes will be done automatically and included for every user. The Alpha series is designed to help you make your analysis easier to comprehend and more accurate, I really think this one will be enjoyed by many for years to come, I have enjoyed designing and using this immensely. As always, please make your own decisions when trading and use proper analysis techniques.
Note: The options within the Alpha: Reversal allow the indicator to be used on any timeframe & any asset. As with any indicator, the higher the timeframe, the higher the accuracy.
Disclaimer
Nothing in this post is to be used or construed as financial advice. This post is meant as an educational post to explain the functions of the indicator.
Bold PlotA remarkable algorithm creates entry, re-entry, take profit, safety exit signals. Nothing to set. There is only config code.All signals are being created when new candle opens. Ergo, never repaints. This also helps alarms to be set directly as "once per bar".
Now only for XBTUSD - Bitmex - 2h
Entries: When the algorithm creates an initial entry signal, it also follows the recent trend.
Re-Entries: If the algorithm senses a retracement or correction however the price movement within recent trend, the script creates re-entry signal.
Take Profit: Apart from the main entry algorithm, completely different algorithm has been developed for take profit signals. Expect maximum of 3 take profit signals after each initial entry and re-entries. Maximum of 3 TP signals aim to reach best profit levels rather than contingency.
Safety Exit Signals: Another individual algorithm apart from both entries and take profit signals. If the algorithm senses that the price movement might be in danger opposite to recent position, it creates safety exit signal for only once. This type of signals can also be considered as contingency signals. They can either be a take profit or stop loss. Be aware! This type of signals do not focus on exiting the position completely. They have designed to exit the position 60%-80% and re-enter if the the algorithm creates re-entry signals. There might be take profit signals following the safety exit signals as this situation does not affect take profits.
Current Config Codes:
XBTUSD - Bitmex - 2h / Config Code: 1

Efficient PriceTrading The Movements That Matters
Inspired by the Price Volume Trend indicator the Efficient Price aim to create a better version of the price containing only the information a trend trader must need.
Calculation
This indicator use the Efficiency Ratio as a smoothing constant, it is calculated as follow :
ER = abs(change(close,length))/sum(abs(change(close)),length)
The goal of the Efficiency Ratio is to show if the market is trending or ranging.If ER is high then the market is considered to be trending, if ER is low then the market is considered to be ranging.
Then the Efficient Price is calculated :
EP = cum(change(close)*ER)
When the price is trending, the indicator will show movements of the price with unchanged volatility, but if the price is not trending then the indicator will flatten those movements.Think of this indicator as both a filter and a compressor and the Efficient Price as some kind of threshold.
The Efficient Price As Input For Indicators/Strategies
If the indicator show the movement of the trending price, it can be interesting to use it as input in order to reduce the number of false signals in a strategy.
We will test 2 MACD strategy provided by tradingview, one using the closing price (In Red) and one with the efficient price (In White) as input
with both the following parameters :
fastLength = 50
slowlength = 200
MACDLength = 20
length = 50
Where length is the parameter of the Efficient Price.A spread of 2 pips is used.
Without Efficient Price : 26.88% of profitability, 69 pips of profit.
With Efficient Price : 38.46% of profitability, 336 pips of profit.
The difference of profitability is of 11.58%, the strategy with the Efficient Price made few trades and its equity have a lower variance than the equity of the MACD strategy using closing price.
Smoothed Version
It is possible to smooth the indicator output by using the following code :
EP = cum(change(close,length)*ER)
Hope you enjoy
For any questions/demands feel free to pm me, i would be happy to help you

Intelligent Volume-weighted Moving Average (AI)Introduction
This indicator uses machine learning (Artificial Intelligence) to solve a real human problem.
The volume-weighted moving average (VWMA) is one of the most used indicators on the planet, yet no one really knows what pair of volume-weighted moving average lengths works best in combination with each other. A reason for this is because no two VWMA lengths are always going to be the best on every instrument, time-frame, and at any given point in time.
The "Intelligent Volume-weighted Moving Average" solves the moving average problem by adapting the period length to match the most profitable combination of volume-weighted moving averages in real time.
How does the Intelligent Volume-weighted Moving Average work?
The artificial intelligence that operates these moving average lengths was created by an algorithm that tests every single combination across the entire chart history of an instrument for maximum profitability in real-time.
No matter what happens, the combination of these volume-weighted moving averages will be the most profitable.
Can we learn from the Intelligent Volume-weighted Moving Average?
There are many lessons to be learned from the Intelligent VWMA. Most will come with time as it is still a new concept. Adopting the usefulness of this AI will change how we perceive moving averages to work.
Limitations
This indicator does not change what has already been plotted and does not repaint in any way shape or form which means it is excellent for trading in real-time!
Ultimately, there are no limiting factors within the range of combinations that has been programmed. The volume-weighted moving averages will operate normally, but may change lengths in unexpected ways - maybe it knows something we don't?
Thresholds
The range of VWMA lengths is between 5 to 40.
The black crosses can be turned off in the settings panel.
Test this indicator!
I am also publishing tools that can be used to back-test this indicator and understand what period length is currently being used.
There will be many more updates to come so stay tuned!
Updated documentation and access to this indicator can be found at www.kenzing.com

Intelligent Exponential Moving Average (AI)Introduction
This indicator uses machine learning (Artificial Intelligence) to solve a real human problem.
The Exponential Moving Average (EMA) is one of the most used indicators on the planet, yet no one really knows what pair of exponential moving average lengths works best in combination with each other.
A reason for this is because no two EMA lengths are always going to be the best on every instrument, time-frame, and at any given point in time.
The "Intelligent Exponential Moving Average" solves the moving average problem by adapting the period length to match the most profitable combination of exponential moving averages in real time.
How does the Intelligent Exponential Moving Average work?
The artificial intelligence that operates these moving average lengths was created by an algorithm that tests every single combination across the entire chart history of an instrument for maximum profitability in real-time.
No matter what happens, the combination of these exponential moving averages will be the most profitable.
Can we learn from the Intelligent Moving Average?
There are many lessons to be learned from the Intelligent EMA. Most will come with time as it is still a new concept. Adopting the usefulness of this AI will change how we perceive moving averages to work.
Limitations
Ultimately, there are no limiting factors within the range of combinations that has been programmed. The exponential moving averages will operate normally, but may change lengths in unexpected ways - maybe it knows something we don't?
Thresholds
The range of exponential moving average lengths is between 5 to 40.
Additional coverage resulted in TradingView server errors.
Future Updates!
Soon, I will be publishing tools to test the AI and visualise what moving average combination the AI is currently using.

Intelligent Moving Average (AI)
Introduction
This indicator uses machine learning (Artificial Intelligence) to solve a real human problem.
The Moving Average is the most used indicator on the planet, yet no one really knows what pair of moving average lengths works best in combination with each other.
A reason for this is because no two moving averages are always going to be the best on every instrument, time-frame, and at any given point in time.
The " Intelligent Moving Average " solves the moving average problem by adapting the period length to match the most profitable combination of moving averages in real time.
How does the Intelligent Moving Average work?
The artificial intelligence that operates these moving average lengths was created by an algorithm that tests every single combination across the entire chart history of an instrument for maximum profitability in real-time.
No matter what happens, the combination of these moving averages will be the most profitable.
Can we learn from the Intelligent Moving Average?
There are many lessons to be learned from the Intelligent Moving Average. Most will come with time as it is still a new concept.
Adopting the usefulness of this AI will change how we perceive moving averages to work.
Limitations
Ultimately, there are no limiting factors within the range of combinations that has been programmed. The moving averages will operate normally, but may change lengths in unexpected ways - maybe it knows something we don't?
Thresholds
The range of moving average lengths is between 5 to 40.
Additional coverage resulted in TradingView server errors.
Future Updates!
Soon, I will be publishing tools to test the AI and visualise what moving average combination the AI is currently using.

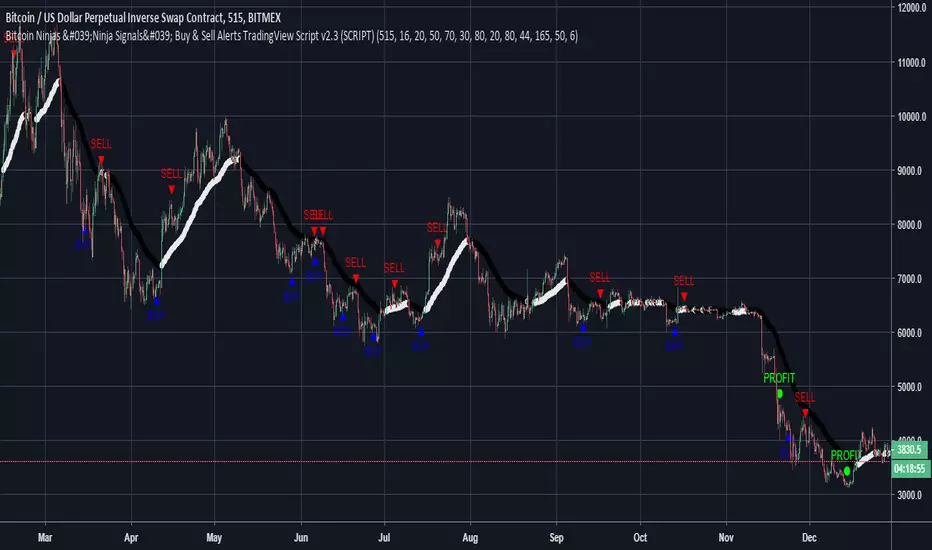
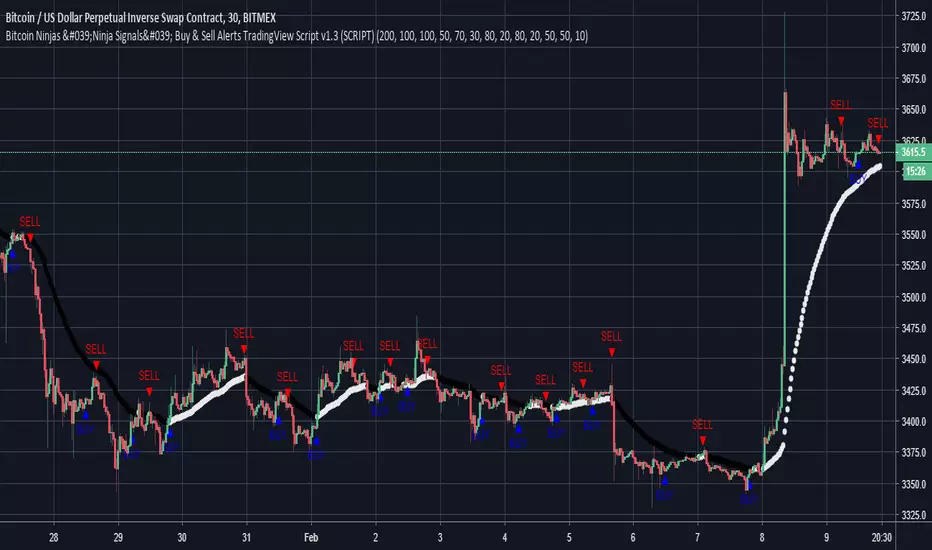
BitcoinNinjas 'Ninja Signals' Buy/Sell Alert Trading Script v3.0Bitcoin Ninjas 'Ninja Signals' Buy/Sell Alerts & Backtesting TradingView Script v3.0
(for Cryptocurrencies, Forex, GunBot, ProfitTrailer, automatic trading software, and more)
This is version 3 of our popular Ninja Signals trading script, which is similar to version 2, but with a new hard-coded calibration (resolution) setting that automatically matches candle size (period) to ensure that no repainting occurs regardless of the number or type of indicators and filters traders apply when configuring the script.
'Ninja Signals' v3.0 (SCRIPT)
'Ninja Signals' v3.0 (STRATEGY)
'Ninja Signals' v2.0 (SCRIPT)
'Ninja Signals' v2.0 (STRATEGY)
'Ninja Signals' v1.0 (SCRIPT)
'Ninja Signals' v1.0 (STRATEGY)
-Allows users to easily set automated buy and sell alerts on TradingView for use with automatic and manual trading of cryptocurrencies, Forex securities, and more (alerts are compatible with automatic trading software such as GunBot, ProfitTrailer, and more).
-Synthesizes many powerful indicators [e.g. Relative Strength Index (RSI), stochastic RSI, Money Flow Index (MFI), Moving Average Convergence Divergence (MACD), etc.) into one super script to generate very precise buy and sell signals in almost any market condition.
-Buy arrows (blue) and sell arrows (red) can be changed or hidden for ease of viewing.
-No lag EMA trendline featuring trend-reversal color-coding (white uptrend, black downtrend).
-Adjustable ‘calibration’ setting allows users to customize the script to work for any currency or security available through TradingView, on any exchange, simply by adjusting a number.
-Complete with backtesting strategy version of script which allows users to test various buy and sell strategies based on the alerts the script generates (see info and screenshots below).
-Backtesting strategy incorporates a user-defined adjustable date range, so users can estimate the script’s performance over specific periods of time, such as the last day, week, or month.
-Backtesting strategy utilizes a minimum protective gain setting to help you never sell for a loss. Simply adjust your minimum profit (%) per trade, and the test results will update.
-Backtesting strategy allows for pyramid buying to test various average down / double up buying strategies. Simply adjust the number of pyramid buys and the quantity of each buy.
- Free 7-day trial available for TradingView users who join our free BitcoinNinjas community.
-Free 24/7 support via BitcoinNinjas Telegram GunBot support group with script purchase.
-Fully compatible with GunBot automatic trading software (TradingView plugin is required).
-Special discount available for traders who purchase GunBot automatic trading software and the GunBot TradingView plugin from BitcoinNinjas, allowing for fully automatic trading.
-Contact us via Email or Telegram for more information, to request additional / custom screenshots, or to start your free trial.
DISCLAIMER: By using our BitcoinNinjas ‘Ninja Signals’ planning script, you agree to the BitcoinNinjas 'Terms of Use', as presented on our website (www.BitcoinNinjas.org) and as stated here. No sharing, copying, reselling, modifying, or any other forms of use are authorized for our documents, script / strategy, and the information published with them. This informational planning script / strategy is strictly for individual use and educational purposes only. This is not financial or investment advice. Investments are always made at your own risk and are based on your personal judgement. Bitcoin Ninjas is not responsible for any losses you may incur. Please invest wisely.

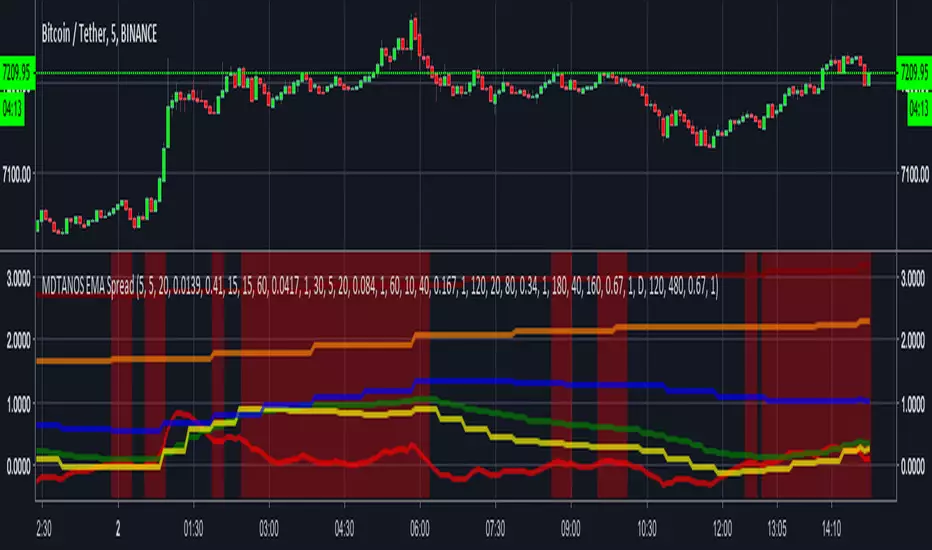
MDTANOS EMA Spread Indicator [v2018-09-01]Built an indicator providing buy / sell signals for MDTANOS from the
ProfitTrailer discord discord.gg as an educational exercise to
show him and the rest of the profit trailer community how to create an indicator
on TradingView using PineScript.
He requested:
i would like to know how to see on tradingview a combination of EMASPREADS
on 5 min and 15 min time frame is it possible?
i have a buy strategy from A to D that combines several time frames
all using EMASPREAD
and the bot buys when all them are true
each of them uses a different time frame
5 min, 15 min, 30 min, 1hour 2 hours 4 hours and 1 day
is there a way to visualize thid condition on tradingview?
Rather than build directly to the requested strategy I made this a
generic and more flexible indicator that can be used and configured
to work on any market, timeframe and trading pair.
Note it is using the timeframes defined for the CandlePeriod parameter
rather than the chart resolution.
I first published the basis of this indicator on the ProfitTrailer discord.
The script uses an EMA spread as its main signal and displays the
spread values as lines on the indicator based on whatever input
criteria you provide.
Based on the buy value and buy limit values it works out buy signals.
The display of the buy signals is optional as displaying them altogether
would not be particularly useful.
This software is provided under a commercial license that grants
personal use only, please refer:
github.com
Copyright (c) 2018, Grant Cause aka CryptoCoyn
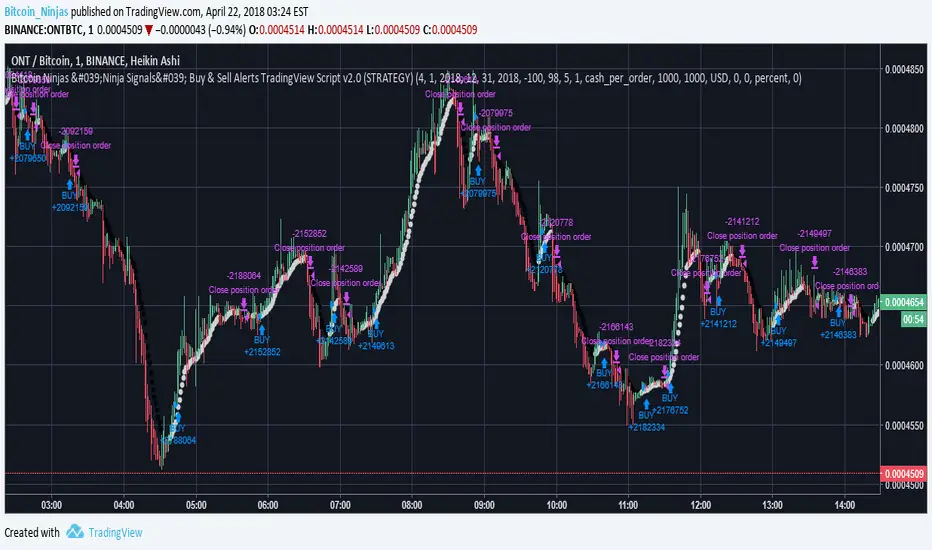
BitcoinNinjas Ninja Signals Buy/Sell Alert Trading Script v2.0Bitcoin Ninjas 'Ninja Signals' Buy/Sell Alerts & Backtesting TradingView Script v2.0
(for Cryptocurrencies, Forex, GunBot, ProfitTrailer, automatic trading software, and more)
'Ninja Signals' v2.0 (STRATEGY)
'Ninja Signals' v2.0 (SCRIPT)
'Ninja Signals' v1.0 (STRATEGY)
'Ninja Signals' v1.0 (SCRIPT)
-Allows users to easily set automated buy and sell alerts on TradingView for use with automatic and manual trading of cryptocurrencies, Forex securities, and more (alerts are compatible with automatic trading software such as GunBot, ProfitTrailer, and more).
-Synthesizes many powerful indicators [e.g. Relative Strength Index (RSI), stochastic RSI, Money Flow Index (MFI), Moving Average Convergence Divergence (MACD), etc.) into one super script to generate very precise buy and sell signals in almost any market condition.
-Buy arrows (blue) and sell arrows (red) can be changed or hidden for ease of viewing.
-No lag EMA trendline featuring trend-reversal color-coding (white uptrend, black downtrend).
-Adjustable ‘calibration’ setting allows users to customize the script to work for any currency or security available through TradingView, on any exchange, simply by adjusting a number.
-Complete with backtesting strategy version of script which allows users to test various buy and sell strategies based on the alerts the script generates (see info and screenshots below).
-Backtesting strategy incorporates a user-defined adjustable date range, so users can estimate the script’s performance over specific periods of time, such as the last day, week, or month.
-Backtesting strategy utilizes a minimum protective gain setting to help you never sell for a loss. Simply adjust your minimum profit (%) per trade, and the test results will update.
-Backtesting strategy allows for pyramid buying to test various average down / double up buying strategies. Simply adjust the number of pyramid buys and the quantity of each buy.
- Free 7-day trial available for TradingView users who join our free BitcoinNinjas community.
-Free 24/7 support via BitcoinNinjas Telegram GunBot support group with script purchase.
-Fully compatible with GunBot automatic trading software (TradingView plugin is required).
-Special discount available for traders who purchase GunBot automatic trading software and the GunBot TradingView plugin from BitcoinNinjas, allowing for fully automatic trading.
-Contact us via Email or Telegram for more information, to request additional / custom screenshots, or to start your free trial.
DISCLAIMER: By using this BitcoinNinjas document or ‘Ninja Signals’ planning script, you agree to the BitcoinNinjas 'Terms of Use', as presented on our website (www.BitcoinNinjas.org) and as stated here. No sharing, copying, reselling, modifying, or any other forms of use are authorized for our documents, script / strategy, and the information published with them. This informational document and planning script / strategy is strictly for individual use and educational purposes only. This is not financial or investment advice. Investments are always made at your own risk and are based on your personal judgement. BitcoinNinjas is not responsible for any losses you may incur. Please invest wisely.
BitcoinNinjas Ninja Signals Buy/Sell Alert Trading Strategy v2.0Bitcoin Ninjas 'Ninja Signals' Buy/Sell Alerts & Backtesting TradingView Script v2.0
(for Cryptocurrencies, Forex, GunBot, ProfitTrailer, automatic trading software, and more)
'Ninja Signals' v2.0 (SCRIPT)
'Ninja Signals' v2.0 (STRATEGY)
'Ninja Signals' v1.0 (SCRIPT)
'Ninja Signals' v1.0 (STRATEGY)
-Allows users to easily set automated buy and sell alerts on TradingView for use with automatic and manual trading of cryptocurrencies, Forex securities, and more (alerts are compatible with automatic trading software such as GunBot, ProfitTrailer, and more).
-Synthesizes many powerful indicators [e.g. Relative Strength Index (RSI), stochastic RSI, Money Flow Index (MFI), Moving Average Convergence Divergence (MACD), etc.) into one super script to generate very precise buy and sell signals in almost any market condition.
-Buy arrows (blue) and sell arrows (red) can be changed or hidden for ease of viewing.
-No lag EMA trendline featuring trend-reversal color-coding (white uptrend, black downtrend).
-Adjustable ‘calibration’ setting allows users to customize the script to work for any currency or security available through TradingView, on any exchange, simply by adjusting a number.
-Complete with backtesting strategy version of script which allows users to test various buy and sell strategies based on the alerts the script generates (see info and screenshots below).
-Backtesting strategy incorporates a user-defined adjustable date range, so users can estimate the script’s performance over specific periods of time, such as the last day, week, or month.
-Backtesting strategy utilizes a minimum protective gain setting to help you never sell for a loss. Simply adjust your minimum profit (%) per trade, and the test results will update.
-Backtesting strategy allows for pyramid buying to test various average down / double up buying strategies. Simply adjust the number of pyramid buys and the quantity of each buy.
- Free 7-day trial available for TradingView users who join our free BitcoinNinjas community.
-Free 24/7 support via BitcoinNinjas Telegram GunBot support group with script purchase.
-Fully compatible with GunBot automatic trading software (TradingView plugin is required).
-Special discount available for traders who purchase GunBot automatic trading software and the GunBot TradingView plugin from BitcoinNinjas, allowing for fully automatic trading.
-Contact us via Email or Telegram for more information, to request additional / custom screenshots, or to start your free trial.
DISCLAIMER: By using this BitcoinNinjas document or ‘Ninja Signals’ planning script, you agree to the BitcoinNinjas 'Terms of Use', as presented on our website (www.BitcoinNinjas.org) and as stated here. No sharing, copying, reselling, modifying, or any other forms of use are authorized for our documents, script / strategy, and the information published with them. This informational document and planning script / strategy is strictly for individual use and educational purposes only. This is not financial or investment advice. Investments are always made at your own risk and are based on your personal judgement. BitcoinNinjas is not responsible for any losses you may incur. Please invest wisely.
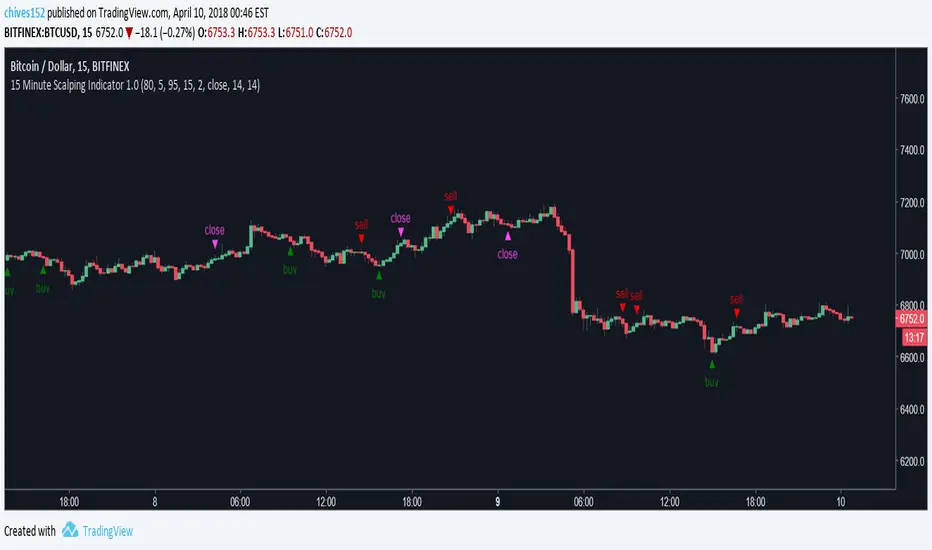
15 Minute Bitcoin Indicator 1.0Indicator Description:
This is a premium indicator that is intended for trading on the 15 minute time scale. This script uses ADX to judge the strength of trends. When a trend is confirmed by ADX, the indicator uses SRSI to find the optimal entry. The indicator works best on BITFINEX:BTCUSD .
Instructions:
Whenever there is a sell signal exit the current long and vice versa. If a close signal appears close the current position but do not open another trade in opposite direction. There is a indicator based stop loss system that is built into the signals, but no static stop loss based on % loss or pips moved in one direction.
Available Settings :
1. Buying and Selling Thresholds: These are the values that are used with SRSI to determine entries. The default values were experimentally determined
to be the most profitable.
2. Stacked Orders Allowed: This limits the amount of positions that can be entered in the same direction. This is useful for trading with leverage. This is defaulted to 2 because I limit myself to 2x leverage. Backtesting shows the more orders allowed, the more profitable, but also risk is increased.
3. ADX/DI Settings: These are settings the ADX smoothing and DI length.
Backtesting:
CLICK HERE
This is a strategy that enters and exits positions on the exact same criteria as this indicator. For the simulation the capital was 10,000 dollars and it was allowed to go up to 2x leverage. Each trade used 100% of available funds. The same simulation done from 1/1/2018 to 4/10/2018 resulted in:
3658.38 % Net Profit
316 Total Closed Trades
77.22 % Profitable
4.552 Profit Factor
24 % Max Drawdown
+11.58% Average Trade
20 15m candles in each trade on average.
Future Plans:
More robust stop loss system.
Factoring trend into trading signals.
EMA integration.
MULTI-TIMEFRAME SUPPORT
Availability
This indicator is currently in a testing stage of development with a full release planned for mid April. While the indicator is not completed, it currently is profitable for me to consider it ready for release. During this testing phase anyone can test it for free for three days, just comment below. Lifetime access currently costs .005 btc, and this price will increase once the full release occurs, if you are interested, DM me for further details.
Please comment with any ideas, suggestions, or criticisms.
Bitcoin Ninjas 'Ninja Signals' Buy & Sell Alert Trading ScriptBitcoin Ninjas 'Ninja Signals' Buy/Sell Alerts & Backtesting TradingView Script
(for Cryptocurrencies, Forex, GunBot, ProfitTrailer, automatic trading software, and more)
-Allows users to easily set automated buy and sell alerts on TradingView for use with automatic and manual trading of cryptocurrencies, Forex securities, and more (alerts are compatible with automatic trading software such as GunBot, ProfitTrailer, and more).
-Synthesizes many powerful indicators [e.g. Relative Strength Index (RSI), stochastic RSI, Money Flow Index (MFI), Moving Average Convergence Divergence (MACD), etc.) into one super script to generate very precise buy and sell signals in almost any market condition.
-Buy arrows (blue) and sell arrows (red) can be changed or hidden for ease of viewing.
-No lag EMA trendline featuring trend-reversal color-coding (white uptrend, black downtrend).
-Adjustable ‘calibration’ setting allows users to customize the script to work for any currency or security available through TradingView, on any exchange, simply by adjusting a number.
-Complete with backtesting strategy version of script which allows users to test various buy and sell strategies based on the alerts the script generates (see info and screenshots below).
-Backtesting strategy incorporates a user-defined adjustable date range, so users can estimate the script’s performance over specific periods of time, such as the last day, week, or month.
-Backtesting strategy utilizes a minimum protective gain setting to help you never sell for a loss. Simply adjust your minimum profit (%) per trade, and the test results will update.
-Backtesting strategy allows for pyramid buying to test various average down / double up buying strategies. Simply adjust the number of pyramid buys and the quantity of each buy.
-Free 7-day trial available for TradingView users who join our free BitcoinNinjas community.
-Free 24/7 support via BitcoinNinjas Telegram GunBot support group with script purchase.
-Fully compatible with GunBot automatic trading software (TradingView plugin is required).
-Special discount available for traders who purchase GunBot automatic trading software and the GunBot TradingView plugin from BitcoinNinjas, allowing for fully automatic trading.
-Contact us for more information, to request additional / custom screenshots, or to start your free trial.
DISCLAIMER: By viewing and/or using this TradingView script, you agree to the BitcoinNinjas 'Terms of Use', as presented on our website and as stated here. No sharing, copying, reselling, modifying, or any other forms of use, are authorized for this document. This document is strictly for individual use and informational purposes only. This is not financial or investment advice. Investments are always made at your own risk, and are ba
Pulsar Heatmap CVD/OBV [by Oberlunar]Pulsar Heatmap CVD/OBV by Oberlunar is a non-repainting order-flow-like indicator designed to support fast, practical decisions—especially for day trading and scalping. It blends OBV and CVD into a structured heatmap with three lanes (OBV, CVD, and a blended COMBO) and splits each lane into two halves: flow pressure and price reaction (PriceΔ) . All values are normalised into the same range, so the intensity of each component is easy to compare at a glance.
In a simple sense, Pulsar Heatmap aims to provide a clean, integrated order-flow view: one framework that turns well-known volume concepts into a clearer read of market pressure and response. Personally, it feels like the kind of tool I would have always wanted on my chart, because it brings familiar information together into a more organic picture that is easier to use in real time.
Visually, the indicator is built around three main elements: the heatmap lanes , a pulsing triangle HUD , and a timed dashboard table . Under the hood, it follows a clear hierarchy: a Bias layer (directional context with a confidence percentage), a strict Signal layer (triggered only when full alignment occurs, with optional confirmation and stickiness), and optional timing logic based on ROC + Acceleration to validate impulses and highlight potential Exhaustion or Absorption regimes. With the option "Safe Mode" enabled, calculations update only on confirmed bars, so signals remain stable and do not repaint.
Optionally, the script can also print signal arrows/labels on the main chart only when a real Signal triggers (not when you only have Bias). To keep the chart clean, the same-direction label is not repeated unless the next signal appears at a more advantageous price than the previous one (for shorts: a higher price; for longs: a lower price). If the direction flips (SHORT → LONG or LONG → SHORT), label printing is re-enabled immediately.
What makes Pulsar Heatmap feel different is that it doesn’t leave you with two separate lines and a lot of guesswork. It organises the information into a readable decision map: pressure , response , agreement , disagreement , impulse , and timing . It was built with scalping in mind, but it’s not limited to scalping: the structure is useful whenever you want context first, and a strict trigger only when alignment is truly present.
Clean Trend Alignment (Ideal Continuation)
A “best case” scenario where flow and price response agree across lanes, so the system produces a high-confidence direction and a clean trigger. Show the heatmap with consistent colouring, the Bias band strong, and a confirmed signal/bias.
Setup 1 — Long Signal (Clean Alignment + Impulse)
In this example, Pulsar Heatmap transitions into a clear long setup when the system prints a LONG SIGNAL . The key idea is simple: the indicator does not enter on “bias” alone. It waits for full alignment across the internal lanes, optionally reinforced by the ROC/Acceleration impulse layer, and only then does it confirm a signal on a closed bar (Safe Mode).
What to highlight on the screenshot
The LONG SIGNAL label: this is the only moment the setup is considered “triggered”.
The LONG BIAS % label: this is context (direction + confidence), not the trigger.
The Triangle HUD : it visually summarises which component is driving the move (OBV/CVD/COMBO weight).
The Timed Table : show that Exhaustion is OFF while impulse metrics are supportive ( dynROC U and dynACC U positive).
If present, the Absorption state (e.g., ABS_LONG + “tight range”): it often appears during compression before expansion, and it adds context to why the breakout can accelerate.
How to read this long setup
Context : Bias is long (even if the % is not huge yet), and the system is not showing exhaustion.
Trigger : A LONG SIGNAL appears only after full alignment (with confirmation bars). If dynamic gating is enabled, the signal is valid only when the impulse agrees.
Quality checks : Positive dynROC and dynACC support the timing; absence of exhaustion reduces the risk of “late entry”. Absorption/tight range can indicate a “pressure build-up” phase.
Practical scalping execution (simple rule set)
Entry timing: consider the entry only on (or immediately after) the confirmed LONG SIGNAL candle.
Risk idea: invalidate the setup if the signal flips, or if price falls back into the compression/range that preceded the move (common absorption-breakout logic).
Exit clue: if Exhaustion turns ON or impulse weakens (acceleration flips), treat it as a warning to reduce exposure or take profit.
Setup 2 — Short Signal After Compression (Absorption → Release)
In this screenshot the short trade idea is not coming from “red candles” alone, but from a very specific sequence: the heatmap shows a shift into bearish alignment, the system prints a SHORT SIGNAL , and the timed module confirms that the market was in a tight range while sell pressure started to dominate.
What this image is really showing
You have a SHORT SIGNAL label on the chart: this is the trigger moment (not the bias).
The context reads SHORT BIAS 18% : it’s supportive, but the execution decision is driven by the signal.
The table shows Absorption = SHORT with a tight range (Range % is low): this often means price was compressed while one side kept applying pressure.
dyn metrics are negative ( dynROC U < 0 and dynACC U < 0): the impulse is coherent with the short direction, so the move is not just “random drift.”
How to read the heatmap here
Earlier, the lanes are mixed (more “two-sided”), then near the signal, the heatmap becomes decisively bearish. That change matters: it tells you the market stopped being balanced and started leaning in one direction with better internal coherence.
Why is this short “high quality” in scalping terms
Compression first : absorption/tight range means the market was storing energy.
Alignment next : the signal appears when the internal lanes agree.
Impulse last : negative ROC + negative acceleration support a real downside push, reducing the odds of a weak, slow fade.
Simple ensure-you-don’t-overtrade rule
Treat the SHORT SIGNAL as the only “go” moment. If you only see bias without signal, or the heatmap stays mixed/disagreeing, it’s usually a lower-quality scalp environment.
Disagreement Zone (Mixed Votes, Higher Risk) — A Practical Exit Area
In this screenshot, Pulsar Heatmap is clearly warning that the market is no longer “one-sided”. You can still see a directional context ( SHORT BIAS 11% ), but the key message is the DISAGREE tag: the reminder that the internal votes are split and the flow/price components are no longer moving in a clean, coherent way.
What this means in a trend continuation is very practical: a Disagreement Zone is often a good EXIT area . When you are already in a short trend, this is the moment where continuation becomes less reliable and where the market can start rotating, stalling, or snapping back.
Why it works as an exit trigger
In a healthy continuation, the lanes tend to stay aligned. Here they don’t: one or more halves contradict the dominant direction.
That loss of coherence typically shows up before the chart becomes obvious, so it can act as an early warning.
For scalping, this is where risk/reward often deteriorates: spreads, noise, and whipsaws increase exactly when the indicator starts disagreeing.
How to use it in a simple way
If you are already short , treat DISAGREE as a signal to take profit, tighten the stop, or scale out .
Avoid adding to the position inside disagreement: even if bias remains short, the internal structure is not “clean” enough to justify aggressive continuation entries.
If later the heatmap returns to full alignment and a new SHORT SIGNAL appears (ideally at a better price), then the continuation becomes actionable again.
“DISAGREE during a short continuation: coherence breaks down. In practice, this is often an exit/scale-out zone, not a fresh entry zone.”
Setup 3 — Neutral State (Stand-By Zone, No Trade Yet)
In the following screenshot, Pulsar Heatmap is doing something very important: it is clearly saying NEUTRAL 0% . Even if, visually, price could “look” like it might resume upward, the indicator is not providing a directional edge yet. This is a classic stand-by condition: the market is transitioning, and the internal components are not aligned enough to justify a directional scalp.
“Neutral 0%: mixed votes and no dominant driver. Even if the price looks promising, Pulsar stays in stand-by until bias rebuilds and a confirmed signal appears.”
What to highlight on the screenshot
The centre label NEUTRAL 0% : this is the key message—no bias strength worth following.
The heatmap is mixed/transitioning: lanes are not consistently one colour, meaning votes are not coherent.
The triangle HUD sits close to the centre: it visually reflects “no dominant driver” right now.
The table can still show background context (e.g., Absorption with a tight range), but that does not override neutrality: it’s information, not a trigger.
How to interpret “Neutral” in practice
When the indicator is neutral, it means the system sees a balance between pressure and reaction (or conflicting components), so direction is statistically less reliable. In scalping terms, this is usually where spreads and noise can eat you alive if you force entries.
Why this is still useful (even without a trade)
Neutral is not “nothing”—it is a filter. It prevents you from trading when the signal quality is low, and it forces the workflow to be clean: wait for Bias to build, then wait for a confirmed Signal , and only then treat it as a real setup.
What you wait for next
If the market turns bullish again, you want to see heatmap alignment returning and eventually a confirmed LONG SIGNAL —however, in the following examples, the heatmap does not follow the trade completely (unlike the previous generated long signal). Thus, a long entry is very risky.
If the market rolls over, you want the opposite: bearish alignment and a confirmed SHORT SIGNAL . Until one of these happens, Neutral = stand-by .
Setup 4 — Impulse + Exhaustion (Late-Stage Move, Don’t Chase)
In this screenshot, you’re basically seeing a “timing warning” configuration. Price prints a sharp bearish extension, but Pulsar Heatmap is not presenting it as a clean continuation setup: the center read is NEUTRAL 0% , while the timed engine shows both Absorption = SHORT and Exhaustion = SHORT . That combination often means: the downside pressure was real, but the move is already in a late/fragile phase (good for managing an existing short, not for opening a new one).
How to read it (practical scalping logic)
Absorption SHORT = there was compression/tight action with persistent bearish pressure building under the surface.
Exhaustion SHORT = the impulse is “spent” or destabilising (acceleration signature is no longer healthy for continuation entries).
Neutral 0% on the main HUD = the system is not granting directional confidence anymore, even if the last candles look aggressive.
Translation: if you were already short, this zone is often for taking profit / tightening risk . If you are not in, it’s usually a wait-for-reset moment.
Possible mean reversions in yellow
Those yellow tiles are the indicator’s “caution prints” (the same colour family used to express DISAGREE ). They appear when the internal structure becomes mixed —i.e., some halves/lanes are not supporting the dominant direction cleanly (or a divergence-style conflict is detected). In practice, they often mark the transition from clean pressure to noisy/late pressure , which is exactly where chasing entries tends to be punished.
How to use them
In a trend continuation, yellow tiles are a strong hint to stop adding and to manage risk more defensively (or treat the phase as “risky trend reversion”).
When they show up near an extension candle (like here), they often signal that the move is shifting into a less stable regime—better for protecting profits than for initiating new entries.
Stepping back for a moment, OBV (On-Balance Volume) and CVD (Cumulative Volume Delta) are both classic tools for studying volume flow, but they differ in what they measure. OBV tracks cumulative volume using price direction: it adds volume on up closes and subtracts it on down closes. CVD tracks the net difference between buying and selling pressure, aiming to reflect the effective push from buyers versus sellers. Both describe the "force behind price" , but from different angles.
OBV is the more traditional approach. It increases when the market closes higher and decreases when it closes lower, so it often works well as a trend-support and divergence tool: if price rises while OBV falls, that mismatch can suggest weakness beneath the move. Because it relies on the close-to-close direction, OBV naturally aligns with trend confirmation across bars.
CVD , instead, is about the ongoing battle between buyers and sellers. Conceptually, it accumulates the net delta between aggressive buying and aggressive selling over time. Positive values tend to indicate stronger buying pressure; negative values indicate stronger selling pressure. Its focus is the tug-of-war itself—who is pushing, rather than simply whether the bar ended up closing up or down.
The practical differences are straightforward. OBV uses the closing direction to assign the full volume, so it tends to be more connected to the overall trend structure. CVD is usually more sensitive to shifts in pressure and can react faster when the market changes character. OBV is commonly used to confirm trends and highlight divergences; CVD is commonly used to spot early pressure changes and moments where one side starts to dominate.
This is also why combining them inside one normalised framework can be so effective. You are not relying on a single volume interpretation. You are pairing a trend-confirmation view (OBV) with a pressure-sensitive view (CVD), and you are making them comparable in a shared scale so agreement and divergence become immediately visible. When they agree, conviction is clearer. When they diverge, you often see important information—hesitation, absorption, or pressure that the price is not fully accepting.
👁️ by Oberlunar ⭐

MARAL - Ultra Filtered Execution Master EngineMARAL — Super Premium Execution Intelligence
Ultra-Filtered Master Engine + Signals + Entry Checklist + Live Execution Board
What “MARAL” Means
MARAL = Market Awareness + Risk Alignment + Action Logic
Built to align context → risk → decision clearly on the chart.
________________________________________
What MARAL
MARAL is a super-premium TradingView framework that provides:
• ✅ Sharp Buy/Sell signals
• ✅ Pre-entry permission using a visual checklist
• ✅ Post-entry trade management guidance via a live execution board
• ✅ Probability/score readability to support decisions under pressure
Most indicators stop at: “Buy/Sell.”
MARAL goes further: “Should I take it? Should I stay? Should I protect? Should I partially exit? Should I exit?”
________________________________________
Built From Real Trading (Loss → Discipline → System)
MARAL was developed from 3–4 years of live market study, including my own losses and wins.
It’s built for real execution reliability, not “perfect marketing backtests.”
________________________________________
Why MARAL Is Super Premium
Retail traders don’t fail only because of entries. They fail because of execution mistakes:
• entering without context (bias/structure/volatility mismatch)
• trading inside chop/range repeatedly
• holding losers + cutting winners (emotion exits)
• no partial-profit structure
• revenge trading
• late entries/late exits in overextended moves
MARAL is designed to reduce these execution errors with a structured workflow.
________________________________________
MARAL Architecture & “8-Layer” Intelligence
Many premium tools give 1–3 layers (signals + a couple confirmations).
MARAL is built as a multi-layer execution framework (~8 layers):
1. Signal Layer (Buy/Sell triggers)
2. Higher-Timeframe Bias Layer (directional alignment)
3. Structure Layer (bull/bear structure context)
4. Momentum Layer (RSI + Ultra-Filtered RSI confirmation)
5. Volatility Layer (ATR% tradability)
6. Trend-Strength Layer (ADX environment)
7. Scoring & Probability Layer (Long/Short score + trend vs reversal pressure)
8. Execution Layer (post-entry board: hold/protect/partial exit/exit)
This is why MARAL behaves like an execution intelligence system, not just an arrow tool.
________________________________________
Panel 1 — Ultra-Filtered Master Engine (The Brain)
The Ultra-Filtered Master Engine powers MARAL’s signals + context + scoring.
It continuously evaluates:
• Multi-timeframe bias agreement
• Structure confirmation
• Momentum quality (noise-filtered)
• Volatility & trend strength (tradability)
• Score & probability readability (trend vs reversal pressure)
Result: signals + context, not blind arrows.
________________________________________
Panel 2 — Entry Checklist (Pre-Entry Permission — No Signal Blocking)
Instead of hiding signals, MARAL shows a permission checklist that evaluates context and displays:
ENTRY / WAIT / SKIP
✅ Signals remain visible
✅ Reduces impulsive trades
✅ Trader stays in control
________________________________________
Panel 3 — Execution Board (Post-Entry Decision Support — Premium Edge)
A live execution board guides management decisions:
• Trade Status
• Market Phase (trend/range awareness)
• TP Probability
• Obstacle Ahead (nearby friction/risk)
• Exit Pressure
• Structure State
• Momentum Health
• Score Trend
• Risk State (includes Overextended)
• Trade Age
• Action: Hold / Protect / Partial Exit / Exit / Wait
________________________________________
Where MARAL Works (Clear & Honest)
MARAL is designed for liquid, directional instruments:
✅ Crypto: BTC/ETH + major liquid pairs
✅ Forex: major pairs
✅ Gold: XAUUSD
✅ Indices: major global indices
________________________________________
Important Note for Options Traders — Please Read Before Buying
MARAL is NOT recommended for options premium trading (especially short-dated/OTM), because option pricing is strongly affected by IV, Theta decay, Gamma, spreads, and expiry behavior.
Even if the underlying chart direction is correct, options can lose due to IV crush / time decay. Options require an options-specific model.
If your main trading is options buying/selling, please do not purchase.
________________________________________
MARAL in One Screenshot: How the System Thinks (XAUUSD Example).. Live chart examples and screenshots i will share TradingView posts for the below below example.
MARAL is not a “BUY/SELL arrow” indicator.
It is an Execution Intelligence Engine that gives you:
1. Direction (Bias)
2. Permission (Score + Filters)
3. Execution Guidance (Hold / Exit / Wait)
This is exactly why MARAL is premium: it tells you when to trade and when NOT to trade.
________________________________________
1) Direction Engine: Multi-Timeframe Bias (Trade ONLY with the flow)
In your screenshot, the info panel clearly shows:
• Last Signal: LONG
• Direction: Bullish
• H1 Bias: Bullish
• H4 Bias: Bullish
• Daily Bias: Bullish
• Structure: Bull Struct
✅ Meaning: MARAL is not randomly buying. It first confirms the market is aligned across timeframes, then it allows only LONG execution logic.
This alone filters out a huge number of low-quality trades.
________________________________________
2) Strength & Volatility Filter: “Is the move healthy or dangerous?”
From the same panel:
✅ Meaning: MARAL is measuring whether the move has real trend strength, not just “green candles”.
________________________________________
3) Score Engine: MARAL enters only when confirmations stack
This is the core premium layer:
✅ Meaning:
• MARAL gives a high-quality Long rating
• And it explicitly blocks shorts (“No-Trade”) even if a candle looks tempting.
So buyers understand: MARAL doesn’t overtrade. It filters.
________________________________________
4) Execution Board: The “Professional Dashboard” (why this is premium)
Your left panel says:
• TRADE STATUS: ✅ VALID
• MARKET PHASE: CONTINUATION
• TP PROBABILITY: HIGH
• OBSTACLE AHEAD: NO
• EXIT PRESSURE: LOW
• STRUCTURE: Bull Struct
• MOMENTUM HEALTH: STRONG
• RISK STATE: NORMAL
• ACTION: HOLD
✅ Meaning (simple for buyers):
MARAL is telling you:
“This is a continuation long. Probability is high. Risk is normal. Don’t panic. Hold the position.”
This is what most indicators never do. They give a signal and disappear.
MARAL stays with the trade and guides execution.
________________________________________
5) Signals on the chart: Why multiple BUY labels appear
You can see multiple BUY labels during the uptrend.
That is not “spam signals”. It’s continuation entries:
• After trend confirmation,
• MARAL allows re-entries/pyramiding opportunities only when the filters stay valid.
So the buyer sees:
✅ one system catching an entire move, not just one random entry.
________________________________________
6) The “WAIT” feature (this is a super-premium selling point)
On the right panel (Entry Checklist) you have:
• SETUP: WAIT
• ENTRY PERMISSION: WAIT
✅ Meaning:
Even in a bullish market, MARAL will say WAIT when conditions are not perfect (chop / uncertainty / missing confirmation).
This is the premium story:
“MARAL is not just signals. It tells you when NOT to trade.”
That prevents:
• revenge trades
• overtrading
• entries in messy candles after a spike
Pricing & Early Access (First 100 Users Only)
Special early access pricing applies only for the first 100 users.
After 100 users, pricing will increase.
Early Access Pricing (First 100 Users):
• Monthly: $99
• Quarterly: $249
• Annual: $899
Lifetime Plan (Limited):
• $7500 USD — only 3 seats total (once sold out, lifetime will be closed permanently)
________________________________________
How to Buy
✅ Purchase, Access & Support
📌 Payment & Access
MARAL is an invite-only premium indicator. Access is granted via direct approval.
MARAL is a premium Trading View indicator with manual access control.
To purchase MARAL, please email us first with your Trading View username.
Payment instructions will be shared by email based on your country.
📧 Email: ksharish0468@gmail.com
Access Delivery
Invite-only TradingView access will be granted within 12–24 hours after verification.
A full user manual will be provided along with activation . One Trading View username per purchase.
Support
For technical doubts/support: ksharish0468@gmail.com
Response time: within maximum 12 hours.
Updates
MARAL will be updated with new features over time.
You will receive email notifications if when updates are released.
________________________________________
Terms & Conditions
By purchasing, accessing, or using MARAL, you agree:
1) Nature of Product / No Financial Advice
• MARAL is a decision-support indicator for discretionary traders.
• It is not financial advice, not a recommendation, and not a guarantee of results.
2) No Guarantees / User Responsibility
• Trading involves risk and may result in losses.
• You are solely responsible for entries, exits, position sizing, and risk management.
• Examples shown in screenshots are illustrative and not a promise of performance.
3) License & Access
• Access is licensed to one TradingView account (single user).
• The license is non-transferable unless explicitly approved in writing.
• Access is provided via TradingView invite-only / protected script mechanism.
4) Strict Anti-Piracy / Prohibited Use
You may NOT:
• share access, resell access, or provide it to anyone else
• copy, replicate, reverse engineer, decompile, or attempt to recreate the indicator logic
• publish “clone” indicators derived from MARAL’s workflow
• distribute screenshots/videos intended to reveal proprietary logic or reproduce the system
• use group-sharing, “signal forwarding,” or shared accounts
Violation may result in:
✅ immediate access termination without refund
✅ permanent ban from future access
5) Service Availability / Platform Dependency
• Functionality depends on TradingView uptime, data feeds, Pine limitations, and symbol differences.
• Temporary issues can occur due to platform updates or broker feed variance.
6) Updates / Changes
• Features may be improved, refined, added, or adjusted over time.
• Visual layout may change while preserving core framework.
7) Refund Policy (Digital Access Standard)
• Because this is a digital product with immediate access, refunds are generally not available after access is granted.
• Refund requests due to trading losses, profitability, or user execution choices are not eligible.
• Exceptional cases (duplicate payment / access failure) must be reported within 48 hours for review.
8) Limitation of Liability
• The creator is not liable for trading losses, missed entries, data feed discrepancies, platform downtime, or indirect damages.
• Use is at your own risk.
________________________________________
Disclaimer
MARAL does not guarantee profits. Trade responsibly.
________________________________________

BOS Indicator (Anchored, TP1-TP3, MTF>=4, Multi-Entry)BOS Indicator (Anchored, TP1–TP3, MTF≥4, Multi-Entry)
This indicator is designed to identify high-probability Break of Structure (BOS) trade setups using a combination of market structure, EMA bias, and multi-timeframe direction confirmation. It is intended for discretionary traders who want clear structure-based entries with predefined risk and profit targets.
🔹 Core Logic
Uses a long-term EMA to define bullish or bearish market bias
Tracks market structure using swing pivots to identify valid BOS events
A trade is only signaled after:
Price is on the correct side of the EMA
A valid pullback has formed
Structure is broken in the direction of the trend
Optional multi-timeframe confirmation ensures alignment across higher timeframes before signaling a trade
🔹 Trade Visualization
When a valid BOS setup occurs, the indicator automatically draws:
Entry level
Stop loss zone
Profit target zone
Three Take Profit levels (TP1, TP2, TP3)
Risk and reward boxes anchored to the signal candle
🔹 Take Profit & Trade Management (Important)
This script is designed to be used with partial profit-taking:
TP1
Take 50% of the position off
Locks in early profits and reduces risk
TP2
Take 25% more off the position
At this point, it is recommended to move the stop loss slightly into profit (or near TP1) to protect the trade and eliminate downside risk
TP3
Let the remaining 25% run toward the final target
This allows traders to benefit from extended moves while already being protected
This approach balances risk control, consistency, and the ability to capture larger trend moves.
🔹 Additional Features
Supports multi-entry trends after exits
Works across all markets and timeframes
Visual MTF direction panel for quick confirmation
Designed to avoid false signals caused by minor consolidations
⚠️ Disclaimer
This indicator is a decision-support tool only and does not guarantee profits. Always use proper risk management and confirm signals with your own analysis.

"VWAP Multi-Timeframe Pro - 6 VWAPs + Session Analysis"═════════════════════════════════════════════════════════════════════════════
VWAP MULTI-TIMEFRAME PRO - COMPLETE TUTORIAL
By Alphaomega18 (OA18)
═══════════════════════════════════════════════════════════════════════════════
📌 DESCRIPTION
VWAP Multi-Timeframe Pro is a professional trading tool that simultaneously
displays 6 different VWAPs with customizable sessions and dynamic standard
deviation bands. Ideal for day trading, swing trading, and institutional
order flow analysis.
═══════════════════════════════════════════════════════════════════════════════
🎯 KEY FEATURES
✅ 3 CUSTOMIZABLE SESSION VWAPS
• Asia Session: Configurable hours (default 0h-8h Paris time)
• London Session: Configurable hours (default 8h-16h Paris time)
• NY Session: Configurable hours (default 15h30-22h Paris time)
• Each session automatically stops at end time
• Customizable colors and thickness for each session
✅ 3 STANDARD TIMEFRAME VWAPS
• Daily VWAP (resets at midnight)
• Weekly VWAP (resets on Monday)
• Monthly VWAP (resets on 1st of month)
✅ ADVANCED STANDARD DEVIATION BANDS
• 3 levels of standard deviation (1σ, 2σ, 3σ)
• Timeframe selection for bands (Asia/London/NY/Daily/Weekly/Monthly)
• Colored zones for quick extreme identification
• Perfect for mean reversion trading
✅ DYNAMIC LABELS
• Real-time value display
• Labels visible only during active sessions
• Adjustable size (tiny/small/normal/large)
• Automatic positioning
✅ ALERT SYSTEM
• Price / Daily VWAP crossover
• Price reaching ±3σ bands
• Real-time notifications
═══════════════════════════════════════════════════════════════════════════════
📖 INSTALLATION GUIDE
STEP 1: Add the indicator
1. Open TradingView
2. Click on "Indicators" at the top of the chart
3. Search for "VWAP Multi-Timeframe Pro" or "Alphaomega18"
4. Click to add the indicator to your chart
STEP 2: Basic configuration
1. Click on the ⚙️ (settings) icon of the indicator
2. You will see 8 parameter groups
3. Start by enabling/disabling the VWAPs you want
═══════════════════════════════════════════════════════════════════════════════
⚙️ DETAILED CONFIGURATION
┌─────────────────────────────────────────────────────────────────────────────┐
│ GROUP 1: VWAP ASIA SESSION │
├─────────────────────────────────────────────────────────────────────────────┤
│ • Show VWAP Asia: YES/NO │
│ • Start Hour: 0 (24h format, 0-23) │
│ • Start Minute: 0 (minutes, 0-59) │
│ • End Hour: 8 │
│ • End Minute: 0 │
│ • Color: Yellow (customizable) │
│ • Line Width: 2 (1-5) │
│ │
│ 💡 EXAMPLE: For Tokyo 1h-9h Paris → Start: 1h00, End: 9h00 │
└─────────────────────────────────────────────────────────────────────────────┘
┌─────────────────────────────────────────────────────────────────────────────┐
│ GROUP 2: VWAP LONDON SESSION │
├─────────────────────────────────────────────────────────────────────────────┤
│ • Show VWAP London: YES/NO │
│ • Start Hour: 8 │
│ • Start Minute: 0 │
│ • End Hour: 16 │
│ • End Minute: 0 │
│ • Color: Aqua (customizable) │
│ • Line Width: 2 (1-5) │
│ │
│ 💡 EXAMPLE: For LSE 9h-17h30 Paris → Start: 9h00, End: 17h30 │
└─────────────────────────────────────────────────────────────────────────────┘
┌─────────────────────────────────────────────────────────────────────────────┐
│ GROUP 3: VWAP NY SESSION │
├─────────────────────────────────────────────────────────────────────────────┤
│ • Show VWAP NY: YES/NO │
│ • Start Hour: 15 │
│ • Start Minute: 30 │
│ • End Hour: 22 │
│ • End Minute: 0 │
│ • Color: Orange (customizable) │
│ • Line Width: 2 (1-5) │
│ │
│ 💡 NOTE: US RTH = 9h30-16h00 ET = 15h30-22h00 Paris time │
└─────────────────────────────────────────────────────────────────────────────┘
┌─────────────────────────────────────────────────────────────────────────────┐
│ GROUPS 4-6: VWAP DAILY, WEEKLY, MONTHLY │
├─────────────────────────────────────────────────────────────────────────────┤
│ Each group has the same options: │
│ • Show VWAP: YES/NO │
│ • Color: Customizable │
│ • Line Width: 1-5 │
└─────────────────────────────────────────────────────────────────────────────┘
┌─────────────────────────────────────────────────────────────────────────────┐
│ GROUP 7: STANDARD DEVIATION BANDS │
├─────────────────────────────────────────────────────────────────────────────┤
│ • Show Bands: YES/NO │
│ • Bands Timeframe: Asia/London/NY/Daily/Weekly/Monthly │
│ • Standard Deviation 1: 1.0 (recommended) │
│ • Standard Deviation 2: 2.0 (recommended) │
│ • Standard Deviation 3: 3.0 (recommended) │
│ • Upper Band Color: Green (customizable) │
│ • Lower Band Color: Red (customizable) │
│ │
│ 💡 Bands are calculated on the selected VWAP │
└─────────────────────────────────────────────────────────────────────────────┘
┌─────────────────────────────────────────────────────────────────────────────┐
│ GROUP 8: DISPLAY │
├─────────────────────────────────────────────────────────────────────────────┤
│ • Show Labels: YES/NO │
│ • Label Size: tiny/small/normal/large │
└─────────────────────────────────────────────────────────────────────────────┘
═══════════════════════════════════════════════════════════════════════════════
🎨 PRESET CONFIGURATIONS
┏━━━━━━━━━━━━━━━━━━━━━━━━━━━━━━━━━━━━━━━━━━━━━━━━━━━━━━━━━━━━━━━━━━━━━━━━━┓
┃ CONFIGURATION 1: SCALPING / INTRADAY DAY TRADING ┃
┣━━━━━━━━━━━━━━━━━━━━━━━━━━━━━━━━━━━━━━━━━━━━━━━━━━━━━━━━━━━━━━━━━━━━━━━━━┫
┃ Chart timeframe: 1min - 5min ┃
┃ ┃
┃ Active VWAPs: ┃
┃ ☑ VWAP Asia : YES (to see overnight range) ┃
┃ ☑ VWAP London : YES (if trading EU session) ┃
┃ ☑ VWAP NY : YES (main US session) ┃
┃ ☑ VWAP Daily : YES (daily reference) ┃
┃ ☐ VWAP Weekly : NO ┃
┃ ☐ VWAP Monthly : NO ┃
┃ ┃
┃ Bands: ┃
┃ Timeframe: NY (if trading US session) ┃
┃ Levels: 1σ, 2σ, 3σ ┃
┃ ┃
┃ Labels: YES, size SMALL ┃
┗━━━━━━━━━━━━━━━━━━━━━━━━━━━━━━━━━━━━━━━━━━━━━━━━━━━━━━━━━━━━━━━━━━━━━━━━━┛
┏━━━━━━━━━━━━━━━━━━━━━━━━━━━━━━━━━━━━━━━━━━━━━━━━━━━━━━━━━━━━━━━━━━━━━━━━━┓
┃ CONFIGURATION 2: STANDARD DAY TRADING ┃
┣━━━━━━━━━━━━━━━━━━━━━━━━━━━━━━━━━━━━━━━━━━━━━━━━━━━━━━━━━━━━━━━━━━━━━━━━━┫
┃ Chart timeframe: 5min - 15min ┃
┃ ┃
┃ Active VWAPs: ┃
┃ ☐ VWAP Asia : NO ┃
┃ ☐ VWAP London : NO ┃
┃ ☑ VWAP NY : YES ┃
┃ ☑ VWAP Daily : YES ┃
┃ ☐ VWAP Weekly : NO ┃
┃ ☐ VWAP Monthly : NO ┃
┃ ┃
┃ Bands: ┃
┃ Timeframe: Daily ┃
┃ Levels: 1σ, 2σ, 3σ ┃
┃ ┃
┃ Labels: YES, size SMALL ┃
┗━━━━━━━━━━━━━━━━━━━━━━━━━━━━━━━━━━━━━━━━━━━━━━━━━━━━━━━━━━━━━━━━━━━━━━━━━┛
┏━━━━━━━━━━━━━━━━━━━━━━━━━━━━━━━━━━━━━━━━━━━━━━━━━━━━━━━━━━━━━━━━━━━━━━━━━┓
┃ CONFIGURATION 3: SWING TRADING ┃
┣━━━━━━━━━━━━━━━━━━━━━━━━━━━━━━━━━━━━━━━━━━━━━━━━━━━━━━━━━━━━━━━━━━━━━━━━━┫
┃ Chart timeframe: 1H - 4H ┃
┃ ┃
┃ Active VWAPs: ┃
┃ ☐ VWAP Asia : NO ┃
┃ ☐ VWAP London : NO ┃
┃ ☐ VWAP NY : NO ┃
┃ ☑ VWAP Daily : YES ┃
┃ ☑ VWAP Weekly : YES ┃
┃ ☐ VWAP Monthly : NO ┃
┃ ┃
┃ Bands: ┃
┃ Timeframe: Weekly ┃
┃ Levels: 1σ, 2σ, 3σ ┃
┃ ┃
┃ Labels: YES, size NORMAL ┃
┗━━━━━━━━━━━━━━━━━━━━━━━━━━━━━━━━━━━━━━━━━━━━━━━━━━━━━━━━━━━━━━━━━━━━━━━━━┛
┏━━━━━━━━━━━━━━━━━━━━━━━━━━━━━━━━━━━━━━━━━━━━━━━━━━━━━━━━━━━━━━━━━━━━━━━━━┓
┃ CONFIGURATION 4: MULTI-SESSION TRADING (FOREX, 24H FUTURES) ┃
┣━━━━━━━━━━━━━━━━━━━━━━━━━━━━━━━━━━━━━━━━━━━━━━━━━━━━━━━━━━━━━━━━━━━━━━━━━┫
┃ Chart timeframe: 15min - 1H ┃
┃ ┃
┃ Active VWAPs: ┃
┃ ☑ VWAP Asia : YES ┃
┃ ☑ VWAP London : YES ┃
┃ ☑ VWAP NY : YES ┃
┃ ☑ VWAP Daily : YES ┃
┃ ☐ VWAP Weekly : NO ┃
┃ ☐ VWAP Monthly : NO ┃
┃ ┃
┃ Bands: ┃
┃ Timeframe: Daily ┃
┃ Levels: 1σ, 2σ, 3σ ┃
┃ ┃
┃ Labels: YES, size SMALL ┃
┗━━━━━━━━━━━━━━━━━━━━━━━━━━━━━━━━━━━━━━━━━━━━━━━━━━━━━━━━━━━━━━━━━━━━━━━━━┛
═══════════════════════════════════════════════════════════════════════════════
📊 SIGNAL INTERPRETATION
┌─────────────────────────────────────────────────────────────────────────────┐
│ PRICE POSITION RELATIVE TO VWAP │
├─────────────────────────────────────────────────────────────────────────────┤
│ Price > VWAP → BULLISH TREND (bulls in control) │
│ Price < VWAP → BEARISH TREND (bears in control) │
│ Price = VWAP → EQUILIBRIUM ZONE (indecision) │
│ Price oscillates → RANGE / CONSOLIDATION │
└─────────────────────────────────────────────────────────────────────────────┘
┌─────────────────────────────────────────────────────────────────────────────┐
│ STANDARD DEVIATION BANDS SIGNALS │
├─────────────────────────────────────────────────────────────────────────────┤
│ Price at +1σ → Normal bullish extension │
│ Price at +2σ → OVERBOUGHT - possible reversal │
│ Price at +3σ → EXTREME OVERBOUGHT - high probability return to VWAP │
│ │
│ Price at -1σ → Normal bearish extension │
│ Price at -2σ → OVERSOLD - possible reversal │
│ Price at -3σ → EXTREME OVERSOLD - high probability return to VWAP │
└─────────────────────────────────────────────────────────────────────────────┘
┌─────────────────────────────────────────────────────────────────────────────┐
│ VWAP CONFLUENCE (POWERFUL SIGNALS) │
├─────────────────────────────────────────────────────────────────────────────┤
│ 3+ VWAPs aligned → VERY STRONG TREND │
│ VWAPs converging → MAJOR SUPPORT/RESISTANCE ZONE │
│ VWAPs diverging → CONSOLIDATION ZONE │
│ Price between 2 → CRITICAL DECISION ZONE │
└─────────────────────────────────────────────────────────────────────────────┘
═══════════════════════════════════════════════════════════════════════════════
💡 TRADING STRATEGIES
╔═════════════════════════════════════════════════════════════════════════════╗
║ STRATEGY 1: MEAN REVERSION ║
╠═════════════════════════════════════════════════════════════════════════════╣
║ TIMEFRAME: 5min - 15min ║
║ VWAP USED: Daily or NY Session ║
║ ║
║ LONG ENTRY RULES: ║
║ 1. Price touches -2σ or -3σ band ║
║ 2. Wait for rejection candle (hammer, pin bar) ║
║ 3. Volume above average ║
║ 4. Enter LONG above rejection candle high ║
║ ║
║ SHORT ENTRY RULES: ║
║ 1. Price touches +2σ or +3σ band ║
║ 2. Wait for rejection candle (shooting star, pin bar) ║
║ 3. Volume above average ║
║ 4. Enter SHORT below rejection candle low ║
║ ║
║ MANAGEMENT: ║
║ • Stop Loss: Beyond ±3σ band ║
║ • Take Profit: Return to VWAP (TP1), opposite VWAP (TP2) ║
║ • Risk/Reward: Minimum 1:2 ║
╚═════════════════════════════════════════════════════════════════════════════╝
╔═════════════════════════════════════════════════════════════════════════════╗
║ STRATEGY 2: TREND FOLLOWING ║
╠═════════════════════════════════════════════════════════════════════════════╣
║ TIMEFRAME: 15min - 1H ║
║ VWAP USED: Daily + Weekly ║
║ ║
║ LONG ENTRY RULES: ║
║ 1. Price > Daily VWAP AND > Weekly VWAP (confirmed trend) ║
║ 2. Wait for pullback to Daily VWAP ║
║ 3. Price rejects VWAP upward (doesn't break) ║
║ 4. Enter LONG on rejection ║
║ ║
║ SHORT ENTRY RULES: ║
║ 1. Price < Daily VWAP AND < Weekly VWAP (confirmed trend) ║
║ 2. Wait for pullback to Daily VWAP ║
║ 3. Price rejects VWAP downward (doesn't break) ║
║ 4. Enter SHORT on rejection ║
║ ║
║ MANAGEMENT: ║
║ • Stop Loss: Below/above Daily VWAP ║
║ • Take Profit: +1σ/+2σ bands or key support/resistance ║
║ • Trailing Stop: Use VWAP as dynamic trailing ║
╚═════════════════════════════════════════════════════════════════════════════╝
╔═════════════════════════════════════════════════════════════════════════════╗
║ STRATEGY 3: BREAKOUT CONFIRMATION ║
╠═════════════════════════════════════════════════════════════════════════════╣
║ TIMEFRAME: 5min - 30min ║
║ VWAP USED: NY Session + Daily ║
║ ║
║ LONG ENTRY RULES: ║
║ 1. Price consolidates around VWAP (range) ║
║ 2. Breakout above VWAP with HIGH VOLUME ║
║ 3. Simultaneous break of NY VWAP AND Daily VWAP ║
║ 4. Pullback test of VWAP (now support) ║
║ 5. Enter LONG on pullback rejection ║
║ ║
║ SHORT ENTRY RULES: ║
║ 1. Price consolidates around VWAP (range) ║
║ 2. Breakout below VWAP with HIGH VOLUME ║
║ 3. Simultaneous break of NY VWAP AND Daily VWAP ║
║ 4. Pullback test of VWAP (now resistance) ║
║ 5. Enter SHORT on pullback rejection ║
║ ║
║ MANAGEMENT: ║
║ • Stop Loss: Return to other side of VWAP ║
║ • Take Profit: ±2σ bands or measured move from range ║
║ • Failed breakout: Exit immediately if back in range ║
╚═════════════════════════════════════════════════════════════════════════════╝
╔═════════════════════════════════════════════════════════════════════════════╗
║ STRATEGY 4: SESSION HANDOFF ║
╠═════════════════════════════════════════════════════════════════════════════╣
║ TIMEFRAME: 5min - 15min ║
║ VWAP USED: Asia + London + NY ║
║ ║
║ CONCEPT: ║
║ Observe how each session respects or breaks the previous session's VWAP. ║
║ A break indicates sentiment change. ║
║ ║
║ LONG EXAMPLE: ║
║ 1. Asia Session: Price ranges around Asia VWAP ║
║ 2. London Open (8h): Price breaks Asia VWAP upward ║
║ 3. London VWAP forms above Asia VWAP ║
║ 4. NY Open (15h30): Price respects London VWAP (doesn't break) ║
║ 5. BULLISH SIGNAL: All 3 sessions aligned bullish ║
║ 6. Enter LONG on pullback to NY VWAP ║
║ ║
║ MANAGEMENT: ║
║ • Stop: Below current session VWAP ║
║ • Target: +2σ band or previous session high ║
║ • Invalid if: Price breaks below all session VWAPs ║
╚═════════════════════════════════════════════════════════════════════════════╝
═══════════════════════════════════════════════════════════════════════════════
🔔 ALERT CONFIGURATION
STEP 1: Create an alert
1. Click on "Alerts" button (alarm icon) top right
2. Click "Create alert"
3. In "Condition", select "VWAP Multi-Timeframe Pro"
STEP 2: Choose alert type
• Price > Daily VWAP: Alert when price crosses Daily VWAP upward
• Price < Daily VWAP: Alert when price crosses Daily VWAP downward
• Price at +3σ: Alert when price reaches extreme upper band
• Price at -3σ: Alert when price reaches extreme lower band
STEP 3: Configure alert
• Frequency: "Once per bar close" (recommended)
• Expiration: Set according to your needs
• Actions: Popup + Email + Mobile notification
RECOMMENDED ALERTS FOR DAY TRADING:
✓ Price crosses Daily VWAP (up and down)
✓ Price at ±3σ on NY Session VWAP
✓ Combine with other indicators for confirmation
═══════════════════════════════════════════════════════════════════════════════
💼 SPECIFIC USE CASES
┏━━━━━━━━━━━━━━━━━━━━━━━━━━━━━━━━━━━━━━━━━━━━━━━━━━━━━━━━━━━━━━━━━━━━━━━━━┓
┃ TRADING MNQ (E-MINI NASDAQ 100) ┃
┣━━━━━━━━━━━━━━━━━━━━━━━━━━━━━━━━━━━━━━━━━━━━━━━━━━━━━━━━━━━━━━━━━━━━━━━━━┫
┃ Optimal configuration: ┃
┃ • Timeframe: 5min ┃
┃ • VWAP Asia: 0h-8h (see overnight range) ┃
┃ • VWAP NY: 15h30-22h (RTH session) ┃
┃ • VWAP Daily: Active ┃
┃ • Bands: NY Session, 1σ/2σ/3σ ┃
┃ ┃
┃ Strategy: ┃
┃ 1. At 15h30: Observe if price respects or breaks Asia VWAP ┃
┃ 2. Enter in NY VWAP direction if confluence with Daily ┃
┃ 3. Use ±2σ bands for targets ┃
┃ 4. Stop below/above NY VWAP ┃
┗━━━━━━━━━━━━━━━━━━━━━━━━━━━━━━━━━━━━━━━━━━━━━━━━━━━━━━━━━━━━━━━━━━━━━━━━━┛
┏━━━━━━━━━━━━━━━━━━━━━━━━━━━━━━━━━━━━━━━━━━━━━━━━━━━━━━━━━━━━━━━━━━━━━━━━━┓
┃ TRADING FOREX EUR/USD ┃
┣━━━━━━━━━━━━━━━━━━━━━━━━━━━━━━━━━━━━━━━━━━━━━━━━━━━━━━━━━━━━━━━━━━━━━━━━━┫
┃ Optimal configuration: ┃
┃ • Timeframe: 15min ┃
┃ • VWAP Asia: 0h-8h ┃
┃ • VWAP London: 8h-16h (most liquid EUR/USD session) ┃
┃ • VWAP NY: 14h-22h (US overlap) ┃
┃ • Bands: London Session ┃
┃ ┃
┃ Strategy: ┃
┃ 1. London Session (8h): Trade in Asia breakout direction ┃
┃ 2. NY Session (14h): Observe London/NY VWAP confluence ┃
┃ 3. Exit before 22h (end of liquidity) ┃
┗━━━━━━━━━━━━━━━━━━━━━━━━━━━━━━━━━━━━━━━━━━━━━━━━━━━━━━━━━━━━━━━━━━━━━━━━━┛
┏━━━━━━━━━━━━━━━━━━━━━━━━━━━━━━━━━━━━━━━━━━━━━━━━━━━━━━━━━━━━━━━━━━━━━━━━━┓
┃ TRADING US STOCKS (AAPL, TSLA, etc.) ┃
┣━━━━━━━━━━━━━━━━━━━━━━━━━━━━━━━━━━━━━━━━━━━━━━━━━━━━━━━━━━━━━━━━━━━━━━━━━┫
┃ Optimal configuration: ┃
┃ • Timeframe: 5min or 15min ┃
┃ • VWAP NY: 15h30-22h (RTH only) ┃
┃ • VWAP Daily: Active ┃
┃ • VWAP Weekly: Active (for swing) ┃
┃ • Bands: Daily ┃
┃ ┃
┃ Strategy: ┃
┃ 1. Pre-market: Analyze sentiment vs Daily VWAP ┃
┃ 2. Open (15h30): Confirm direction with NY VWAP ┃
┃ 3. Institutional orders visible at Daily/Weekly VWAP confluence ┃
┗━━━━━━━━━━━━━━━━━━━━━━━━━━━━━━━━━━━━━━━━━━━━━━━━━━━━━━━━━━━━━━━━━━━━━━━━━┛
═══════════════════════════════════════════════════════════════════════════════
⚠️ COMMON MISTAKES TO AVOID
❌ MISTAKE 1: Trading against all VWAPs
→ If price < Daily, Weekly, Monthly VWAP → DON'T buy
→ Wait for confluence or trend change
❌ MISTAKE 2: Ignoring sessions
→ NY VWAP at 8am has NO validity
→ Respect session start/end times
❌ MISTAKE 3: Over-trading VWAP touches
→ Every VWAP touch is NOT a signal
→ Wait for confluence + volume + pattern
❌ MISTAKE 4: Wrong time configuration
→ Check your timezone
→ Adjust hours according to your location
❌ MISTAKE 5: Neglecting volume
→ VWAP crossover without volume is WEAK
→ Volume > average = more reliable signal
❌ MISTAKE 6: Forgetting HTF context
→ Always check higher timeframe
→ Daily chart for intraday, Weekly for swing
❌ MISTAKE 7: Too tight stop loss
→ Place stop BEYOND ±3σ band
→ Give position room to breathe
❌ MISTAKE 8: Using only VWAP
→ COMBINE with: RSI, Volume Profile, Support/Resistance
→ VWAP is a tool, not a complete strategy
═══════════════════════════════════════════════════════════════════════════════
📈 OPTIMIZATION & BACKTESTING
TIPS TO IMPROVE YOUR RESULTS:
1. JOURNAL YOUR TRADES
• Note which VWAP configuration worked
• Which session gives best results
• Which band level (1σ/2σ/3σ) is optimal
2. TEST DIFFERENT PERIODS
• Modify session hours according to your asset
• Crypto: Different 24h sessions
• EU Stocks: Adapt to XETRA/CAC hours
3. ADAPT BANDS
• Volatile assets: Use 1.5σ, 2.5σ, 3.5σ
• Calm assets: Keep standard 1σ, 2σ, 3σ
4. COMBINE WITH OTHER TOOLS
• Volume Profile (POC, VAH, VAL)
• Market Delta / Order Flow
• Horizontal Support/Resistance
• Fibonacci retracements
═══════════════════════════════════════════════════════════════════════════════
🆘 SUPPORT & FAQ
Q: Are times in local time or UTC?
A: Times are in your TradingView chart's timezone.
For Paris, use French local time.
Q: Can I use more than 3 sessions?
A: This version offers 3 customizable sessions. For more, duplicate
the indicator with different configurations.
Q: Does VWAP reset automatically?
A: Yes! Each VWAP resets automatically:
• Sessions: At defined start time
• Daily: At midnight
• Weekly: On Monday
• Monthly: On 1st of month
Q: Why isn't my session VWAP displaying?
A: Check:
1. Session is enabled in settings
2. You are WITHIN session time
3. Hours are correctly configured
Q: Can I export my configurations?
A: Yes, TradingView allows saving indicator templates.
Q: Compatible with free TradingView?
A: Yes, indicator works on all TradingView plans.
═══════════════════════════════════════════════════════════════════════════════
Version 1.0 | © 2025 Alphaomega18
Indicator developed for professional and passionate traders
═══════════════════════════════════════════════════════════════════════════════

Session Trader - Optimal Hours📊 Overview
Never miss the best trading hours again! This indicator provides a comprehensive, real-time session tracker that shows you EXACTLY when to trade crypto and when to stay out of the market. Automatically converts all times to your local timezone, highlights the current active session, and shows what's coming next.
Perfect for crypto traders who want to maximize profits by trading during high-liquidity, high-volume sessions while avoiding choppy, low-liquidity periods that lead to losses.
✨ Key Features
🎯 Real-Time Session Tracking
LIVE indicator shows which session is currently active with bright highlighting
NEXT UP feature highlights the upcoming session when between trading periods
Smart header displays current status at a glance
Real-time countdown timers for every session (opens/closes)
📍 6 Critical Trading Sessions Covered
✅ BEST TRADING SESSIONS (Green):
London Open (07:00-09:00 UTC) - High volatility kickoff, institutional orders
London-NY Overlap (13:30-15:30 UTC) - THE BEST period! Maximum liquidity & volume
NY Momentum (15:30-18:00 UTC) - Strong trending moves, continuation plays
❌ AVOID TRADING SESSIONS (Red):
4. Pre-Asia Quiet (21:00-00:00 UTC) - Low liquidity, erratic moves, wide spreads
5. Asia Lunch (03:30-05:00 UTC) - Choppy markets, whipsaws, unreliable patterns
6. Post-US Drift (20:00-21:00 UTC) - Market slows, unpredictable behavior
🌍 Automatic Timezone Conversion
Times display in YOUR chart timezone - no manual conversion needed!
Works in Berlin, New York, Tokyo, Sydney, or anywhere in the world
Switch between 12-hour and 24-hour formats
🎨 Visual Clarity
Active TRADE sessions = Bright green background, impossible to miss
Active AVOID sessions = Bright red background, clear warning
NEXT UP session = Orange highlight when between sessions
Inactive sessions = Faded gray, stays out of your way
Color-coded status column with clear ✓ TRADE or ✗ AVOID indicators
⚙️ Fully Customizable
9 table positions (top-left, top-right, bottom-center, etc.)
6 text sizes (tiny to huge) for any screen size
Toggle individual sessions on/off
Show/hide descriptions for cleaner view
Custom colors for each session type
Countdown timer toggle
🔔 Built-In Alerts
Automatic alerts when TRADE sessions start
Alerts when AVOID sessions begin (so you don't enter bad conditions)
Customizable per session
📖 How To Use
Basic Setup:
Add indicator to any crypto chart (BTC, ETH, etc.)
Times automatically convert to your chart's timezone
Watch the header - shows current session or next upcoming
Look for bright colors:
🟢 Bright green = TRADE NOW
🔴 Bright red = AVOID NOW
🟠 Orange = NEXT UP (coming soon)
Trading Strategy:
Focus on GREEN sessions (London Open, London-NY Overlap, NY Momentum)
Avoid RED sessions (Pre-Asia Quiet, Asia Lunch, Post-US Drift)
Prepare for ORANGE sessions (next up - get ready!)
Use countdown timers to plan entries/exits perfectly
Pro Tips:
London-NY Overlap is the BEST - highest volume, tightest spreads, cleanest trends
First 30 minutes of London can have quick reversals - use caution
NY Momentum is perfect for riding trends with trailing stops
NEVER trade during Asia Lunch - choppy, unpredictable, costs you money
Post-US Drift looks tempting but often leads to whipsaws
🔧 Indicator Settings
Display Options:
Table Position: Choose from 9 positions on your chart
Text Size: Auto, Tiny, Small, Normal, Large, Huge
Time Format: 12-hour (AM/PM) or 24-hour format
Show Countdown: Toggle real-time countdown timers
Show Description: Toggle detailed session descriptions
Highlight Next Session: Orange highlight for upcoming session
Session Toggles:
Enable/disable any of the 6 sessions individually:
London Open
London-NY Overlap
NY Momentum
Pre-Asia Quiet
Asia Lunch
Post-US Drift
Color Customization:
Active TRADE session color (default: bright green)
Active AVOID session color (default: bright red)
NEXT UP session color (default: orange)
Inactive session color (default: faded gray)
Alerts:
Individual alert toggles for each session
Alerts fire when sessions start (not every bar)
Includes context in alert message
📊 Session Details
🟢 London Open (07:00-09:00 UTC)
Status: TRADE ✓
Characteristics:
London opens with high volatility as European traders enter
Major institutional orders create significant price movements
Perfect for breakout and trend-following strategies
Watch for quick reversals in first 30 minutes
Good liquidity and volume
🟢 London-NY Overlap (13:30-15:30 UTC)
Status: TRADE ✓
THE BEST TRADING PERIOD!
Maximum liquidity as London & NY markets overlap
Institutional volume peaks, creating clean trends
Reliable technical setups, tightest spreads
Best execution quality
Focus on momentum and breakout trades
🟢 NY Momentum (15:30-18:00 UTC)
Status: TRADE ✓
Characteristics:
Strong directional moves as US market dominates
Trending behavior ideal for position trades
Continuation patterns highly reliable
Major news impact is highest during this period
Use trailing stops to ride trends effectively
🔴 Pre-Asia Quiet (21:00-00:00 UTC)
Status: AVOID ✗
WARNING:
Pre-Asian session with minimal liquidity
Thin order books cause erratic price action
Fake breakouts and stop-hunting common
Wide spreads increase trading costs
High risk, low reward - wait for better conditions
🔴 Asia Lunch (03:30-05:00 UTC)
Status: AVOID ✗
WARNING:
Asian lunch break creates choppy, directionless markets
Low volume leads to whipsaws and false signals
Market makers widen spreads significantly
Technical patterns unreliable
Not worth the risk - take a break!
🔴 Post-US Drift (20:00-21:00 UTC)
Status: AVOID ✗
WARNING:
Post-US session as major markets close
Liquidity dries up, causing unpredictable moves
High slippage risk
Market enters consolidation before Asian open
Better to wait for next quality session
🎯 Who Is This For?
Perfect for:
✅ Crypto day traders who want to maximize profits by timing the markets
✅ Scalpers who need high liquidity and tight spreads
✅ Swing traders who want to enter during optimal conditions
✅ Beginners who need clear guidance on when to trade
✅ Anyone tired of choppy sessions that eat away profits
Ideal Markets:
Bitcoin (BTC/USD, BTC/USDT)
Ethereum (ETH/USD, ETH/USDT)
Major altcoins (SOL, XRP, ADA, etc.)
Any 24/7 crypto market
💡 Why Session Timing Matters
Trading crypto during low-liquidity sessions is one of the biggest mistakes traders make:
❌ Trading during bad sessions causes:
Wider spreads (higher costs per trade)
Choppy, unpredictable price action
Fake breakouts and stop-hunting
Poor trade execution and slippage
Emotional frustration and overtrading
✅ Trading during optimal sessions gives you:
Tight spreads (lower costs)
Clean, trending price action
Reliable technical patterns
Better execution quality
Higher win rates and confidence
The difference between a profitable trader and a losing trader is often WHEN they trade, not HOW they trade.
🚀 Technical Details
Version: Pine Script v6
Type: Overlay indicator (table display)
Repainting: Non-repainting (all times are fixed to session schedules)
Updates: Real-time on every bar
Performance: Lightweight, no lag
Compatibility: Works on any timeframe (1m to 1D+)
📈 Best Practices
Plan your trading schedule around GREEN sessions
Set alerts for session starts so you never miss opportunities
Use the countdown to prepare entries/exits in advance
Combine with your strategy - this indicator tells you WHEN, your strategy tells you WHAT
Respect the RED sessions - discipline is profit
Keep descriptions ON when learning, turn OFF for cleaner charts later
🔄 Updates & Support
This indicator is actively maintained. Future updates may include:
Session volume statistics
Historical session performance tracking
Additional regional sessions
More customization options

Volume Analysis🙏🏻 (signed) Volume Analysis is 2 of 2 structural layer / ordeflow analysis scripts, while the first one is Liquidity Analysis. Both are independent so can’t be released together as a single script, but should be used together.
The same math used in this script can be applied to other types of aggressive volume data: non-aggregated flow of market orders, volume traded of put vs call options.
There’s no universal agreement about terminology, but this script works with volumes signed by the aggressor who initiated a transaction. Then these volumes get aggregated by time and a cumulative sum is calculated. Mostly this is widely known as Cumulative Volume Delta.
However this script works with 'inferred' volumes vs the provided ones. It’s the better choice for equities, bonds; neutral choice for currencies; and suboptimal choice for natural and artificial commodities.
Contents:
Output description;
How to analyze & use the outputs;
How to use it together with Liquidity Analysis script;
How did I use both scripts to finish The Leap profitably and skipped many losses.
1. Output description
Color of the CVD line reflects (signed) volume imbalance state: red is negative, purple is neutral, blue is positive.
3 purple lines are lower deviation (lower band), basis (middle band), upper deviation (upper band): used to generate signals by a ruleset that would be explained in a minute
Gray number in the script’s status line is the advised input you may put into Inferred volume multiplier in script’s setting, I will explain it
Vertical dash line marks the moving window end, this way you can be certain over what exact data you see the profile was built.
2. How to analyze & use the outputs
Setup up the script:
Moving window length: set it to ~ ¼ of your data analysis window. E.g if you see on your charts and use ~ 256 bars, set the length to 64.
Inferred volume multiplier: you can easily leave it 256, this is not a critical factor for the math, it’s mostly there if you want to ~ equate inferred volumes with real ones in scale. For this, use the gray number in the script status line, it’s calculated as ratio of long term real volumes weighted avg to long term inferred volumes weighted avg.
Again, changing the inferred volume multiplier won’t affect the math.
Use 2 timeframes: main one and a far lower one 3 steps down, just like on the screenshot.
Find out current volume imbalance state:
As mentioned before, based on CVD line color, it can be negative, neutral or positive. This is the state variable that changes slowly and denies/confirms the signals generated by crossovers of CVD line and 3 purple thresholds.
For this I use my own very fast and lightweight metric that is totally statistically grounded, utilizes temporal information, and calculates volume imbalance without using heavy math like regressions as it’s usually done. It also provides a natural neutral zone, when volume imbalance is not strong enough to be confirmed.
...
CVD-based signals:
First you need to understand what precisely a touch of a threshold is:
Touch: an event when either of these 2 happens:
One CVD datapoint is above the threshold, and the next CVD datapoint is below the threshold
One CVD datapoint is below the threshold, and the next CVD datapoint is above the threshold
These are usually called crossovers/crossunders.
Now with the 3 purple thresholds we follow this logic:
Monitor the last touched threshold;
Once another threshold is touched, here we may generate a signal but only once !, after the first generated signal at that threshold we can’t generate more signals on this threshold, we need to wait when CVD comes to another threshold.
If CVD touches one threshold, and then goes down and touches another threshold downwards, we wait when CVD makes a datapoint above this threshold. When it happens, we register a long signal
If CVD touches one threshold, and then goes up and touches another threshold upwards, we wait when CVD makes a datapoint below this threshold. When it happens, we register a short signal
However, don’t open new trades against the current volume imbalance state. So don’t open shorts when the CDV line is blue, and don’t open longs when CVD line is red.
Btw, this technique I call it “reclaim” of a level/threshold. It can be applied to horizontal levels, and it’s very powerful especially when you fade levels on very volatility assets like BTC. This technique allows you to Not fade a level straight away, but wait when price goes past the level a bit, and then comes back and reclaims it, only there you enter, and moreover you now have a very well defined risk point.
The last part is multi-timeframe logic. Prefer to act when a lower timeframe is Not against the main timeframe. That’s all, no multiple higher timeframes are needed.
3. How to use it together with Liquidity Analysis script.
That script also has a mean to generate its own signals, and another state variable called Liquidity Imbalance.
So now you’re not only looking at volume imbalance but also at liquidity imbalance that would deny/confirm the CVD based signal. You need at least one of these two to favor your long or short.
This is the same logic widely used in HFT, where MM bots cancel/shift/resize orders when book is too onesided And ordeflow is one sided as well.
4. How did I use both scripts to finish The Leap profitably and skipped many losses.
Even tho you can use structural information as your main strategic layer, as many so-called orderflow traders do, I traded in objective style: my fade signals were volatility based in essence, and I used ordeflow for better entries and stops, but most importantly to skip losses.
When ‘both‘ liquidity imbalance and volume imbalance (in their main timeframes) were against my trades, I skipped them all, saving many ~$500 stop losses (that was my basis risk unit for the Leap). Unless I had a very strong objective signal, i.e. confluence of several signals, or just one higher timeframe signal, I did all these skips.
I traded ~ intraweek timeframe, so I was analyzing either the last 230 30min bars or 1380 5min bars. Both Liquidity Analysis and (signed) Volume Analysis scripts were set to moving window length 46 or 276 for either granularity.
I finished the leap with 9% profit and max DD ~ 5%, a bit short of my goal of 12.5%. If not these 2 scripts I would’ve finished a bit above breakeven I think.
,,,
Another thing, I made these 2 scripts invite-only because they are made particularly for trading, particularly for certain types of market data. These are tools adapted for particular use case, not like my other posts with general math entities like Kernel Density Estimation or Kalman filter, that you can take and apply properly on any data you need yourself.
However these are made from general math entities like everything else. ‘All’ the components are available in my other scripts, ideas, and other sources related to me. If you want to reverse-engineer these, you can find all the components you need in my already posted open source work.
∞

Liquidity Analysis🙏🏻 Liquidity Analysis is 1 of 2 structural layer / orderflow layer analysis scripts. Both are independent so can’t be released together as a single script, but should be used together. The second one which is called (Signed) Volume Analysis is incoming.
The same math used in this script can be applied on other types of profile-like data: orderbooks, trading volumes of all options for each strike.
Important: market or volume profile, just as orderbooks and options traded volume by strikes, are all liquidity ‘estimates’, showing where liquidity is more likely or less likely to be. These estimates however, especially combined with other info, are really useful and reliable.
This script works with inferred volumes vs the provided one. It's the better choice for equities, bonds; neutral choice for currencies; and suboptimal choice for natural & artificial commodities.
Contents:
Output description;
How to analyze & use the outputs;
How to use it together with upcoming (Signed) Volume Analysis script;
How did I use both scripts to finish The Leap profitably and skipped many losses.
1. Output description
Color of the profile reflects the liquidity imbalance state: red is negative, purple is neutral, blue is positive.
Bar coloring represents history values of liquidity imbalance for backtesting purposes. It can be turned on/off in the script's Style settings.
Two purple vertical lines represent calculated borders of excessive liquidity (HVN), scarce liquidity (LVN), and sufficient liquidity (NVN) zones.
Vertical dash line marks the moving window end, this way you can be certain over what exact data you see the profile was built.
2. How to analyze & use the outputs
Setup up the script:
Moving window length: set it to ~ ¼ of your data analysis window. E.g if you see on your charts and use ~ 256 bars, set the length to 64.
Native tick size multiplier: leave it at 0 to calculate optimal number of rows automatically, or set it manually to match native tick size multiples you desire.
Use 2 timeframes: main one and a far lower one 3 steps down, just like on the screenshot.
Native lot size multiplier allows to round profile rows themselves to nearest multiples of native lot size. I added this just in case any1 needs it.
Find out current liquidity imbalance state:
As mentioned before, based on profile color, it can be negative, neutral or positive. This is the state variable that changes slowly and denies/confirms the signals that would be explained in the minute.
I use my own statistically grounded imbalance metric (no hardcoded/learned thresholds), that unlike mainstream imbalance metrics (e.g orderbook imbalance as sum of bids vs sum of asks) provides a natural neutral zone, when liquidity imbalance is ofc there but not strong enough to be considered.
…
Profile-based signals: look at profile shape vs 2 vertical purple lines.
where profile rows exceed the left purple line, these prices are considered HVN. Too much potential liquidity is there.
where profile rows don’t exceed the right purple line, these prices are considered LVN. Potential thin/lack of liquidity is expected there.
where profile rows are in between these 2 purple lines, these are NVN, or neutral liquidity zones.
Trading ruleset itself is based on couple of simple rules:
Only! Use limit orders hence provide liquidity in LVNs and Only! use stop-market orders hence consume liquidity in HVNs;
These orders should be put in advance ‘only’. This is how you discover the direction or orders: you can only put sell limit orders above you and buy limit orders below you, and you can only put buy stop orders above you, and sell stop orders below you.
This is really it. It may look weird, but once you just try to follow these 2 rules letter by letter for 1 hour, you’ll see how liquidity trading works.
Now once you know that, just don’t open new trades against the liquidity imbalance state. So don’t open shorts when the profile is blue, and don’t open longs when it’s red.
The last part is multi-timeframe logic. Prefer to act when a lower timeframe is Not against the main timeframe. That’s all, no multiple higher timeframes are needed.
3. How to use it together with upcoming (Signed) Volume Analysis script.
That upcoming script would also have a mean to generate its own signals, and another state variable called volume imbalance.
So now you’re not only looking at liquidity imbalance but also at volume imbalance that would deny/confirm a profile based signal. You need at least one of these to favor your long or short.
This is the same logic widely used in HFT, where MM bots cancel/shift/resize orders when book is too onesided And ordeflow is one sided as well.
4. How did I use both scripts to finish The Leap profitably and skipped many losses.
Even tho you can use structural information as your main strategic layer, as many so-called orderflow traders do, I traded in objective style: my fade signals were volatility based in essence, and I used ordeflow for better entries and stops, but most importantly to skip losses.
When ‘both‘ liquidity imbalance and volume imbalance (in their main timeframes) were against my trades, I skipped them all, saving many ~$500 stop losses (that was my basis risk unit for the Leap). Unless I had a very strong objective signal, i.e confluence of several signals, or just one higher timeframe signal, I did all these skips.
I traded ~ intraweek timeframe, so I was analyzing either the last 230 30min bars or 1380 5min bars. Both Liquidity Analysis and (signed) Volume Analysis scripts were set to moving window length 46 or 276 for either granulary.
I finished the leap with 9% profit and max DD ~ 5%, a bit short of my goal of 12.5%. If not these 2 scripts I would’ve finished a bit above breakeven I think.
∞

Gyspy Bot Trade Engine - V1.2B - Alerts - 12-7-25 - SignalLynxGypsy Bot Trade Engine (MK6 V1.2B) - Alerts & Visualization
Brought to you by Signal Lynx | Automation for the Night-Shift Nation 🌙
1. Executive Summary & Architecture
Gypsy Bot (MK6 V1.2B) is not merely a strategy; it is a massive, modular Trade Engine built specifically for the TradingView Pine Script V6 environment. While most tools rely on a single dominant indicator to generate signals, Gypsy Bot functions as a sophisticated Consensus Algorithm.
Note: This is the Indicator / Alerts version of the engine. It is designed for visual analysis and generating live alert signals for automation. If you wish to see Backtest data (Equity Curves, Drawdown, Profit Factors), please use the Strategy version of this script.
The engine calculates data from up to 12 distinct Technical Analysis Modules simultaneously on every bar closing. It aggregates these signals into a "Vote Count" and only fires a signal plot when a user-defined threshold of concurring signals is met. This "Voting System" acts as a noise filter, requiring multiple independent mathematical models—ranging from volume flow and momentum to cyclical harmonics and trend strength—to agree on market direction.
Beyond entries, Gypsy Bot features a proprietary Risk Management suite called the Dump Protection Team (DPT). This logic layer operates independently of the entry modules, specifically scanning for "Moon" (Parabolic) or "Nuke" (Crash) volatility events to signal forced exits, preserving capital during Black Swan events.
2. ⚠️ The Philosophy of "Curve Fitting" (Must Read)
One must be careful when applying Gypsy Bot to new pairs or charts.
To be fully transparent: Gypsy Bot is, by definition, a very advanced curve-fitting engine. Because it grants the user granular control over 12 modules, dozens of thresholds, and specific voting requirements, it is extremely easy to "over-fit" the data. You can easily toggle switches until the charts look perfect in hindsight, only to have the signals fail in live markets because they were tuned to historical noise rather than market structure.
To use this engine successfully:
Visual Verification: Do not just look for "green arrows." Look for signals that occur at logical market structure points.
Stability: Ensure signals are not flickering. This script uses closed-candle logic for key decisions to ensure that once a signal plots, it remains painted.
Regular Maintenance is Mandatory: Markets shift regimes (e.g., from Bull Trend to Crab Range). Gypsy Bot settings should be reviewed and adjusted at regular intervals to ensure the voting logic remains aligned with current market volatility.
Timeframe Recommendations:
Gypsy Bot is optimized for High Time Frame (HTF) trend following. It generally produces the most reliable results on charts ranging from 1-Hour to 12-Hours, with the 4-Hour timeframe historically serving as the "sweet spot" for most major cryptocurrency assets.
3. The Voting Mechanism: How Entries Are Generated
The heart of the Gypsy Bot engine is the ActivateOrders input (found in the "Order Signal Modifier" settings).
The engine constantly monitors the output of all enabled Modules.
Long Votes: GoLongCount
Short Votes: GoShortCount
If you have 10 Modules enabled, and you set ActivateOrders to 7:
The engine will ONLY plot a Buy Signal if 7 or more modules return a valid "Buy" signal on the same closed candle.
If only 6 modules agree, the signal is rejected.
4. Technical Deep Dive: The 12 Modules
Gypsy Bot allows you to toggle the following modules On/Off individually to suit the asset you are trading.
Module 1: Modified Slope Angle (MSA)
Logic: Calculates the geometric angle of a moving average relative to the timeline.
Function: Filters out "lazy" trends. A trend is only considered valid if the slope exceeds a specific steepness threshold.
Module 2: Correlation Trend Indicator (CTI)
Logic: Measures how closely the current price action correlates to a straight line (a perfect trend).
Function: Ensures that we are moving up with high statistical correlation, reducing fake-outs.
Module 3: Ehlers Roofing Filter
Logic: A spectral filter combining High-Pass (trend removal) and Super Smoother (noise removal).
Function: Isolates the "Roof" of price action to catch cyclical turning points before standard moving averages.
Module 4: Forecast Oscillator
Logic: Uses Linear Regression forecasting to predict where price "should" be relative to where it is.
Function: Signals when the regression trend flips. Offers "Aggressive" and "Conservative" calculation modes.
Module 5: Chandelier ATR Stop
Logic: A volatility-based trend follower that hangs a "leash" (ATR multiple) from extremes.
Function: Used as an entry filter. If price is above the Chandelier line, the trend is Bullish.
Module 6: Crypto Market Breadth (CMB)
Logic: Pulls data from multiple major tickers (BTC, ETH, and Perpetual Contracts).
Function: Calculates "Market Health." If Bitcoin is rising but the rest of the market is dumping, this module can veto a trade.
Module 7: Directional Index Convergence (DIC)
Logic: Analyzes the convergence/divergence between Fast and Slow Directional Movement indices.
Function: Identifies when trend strength is expanding.
Module 8: Market Thrust Indicator (MTI)
Logic: A volume-weighted breadth indicator using Advance/Decline and Volume data.
Function: One of the most powerful modules. Confirms that price movement is supported by actual volume flow. Recommended setting: "SSMA" (Super Smoother).
Module 9: Simple Ichimoku Cloud
Logic: Traditional Japanese trend analysis.
Function: Checks for a "Kumo Breakout." Price must be fully above/below the Cloud to confirm entry.
Module 10: Simple Harmonic Oscillator
Logic: Analyzes harmonic wave properties to detect cyclical tops and bottoms.
Function: Serves as a counter-trend or early-reversal detector.
Module 11: HSRS Compression / Super AO
Logic: Detects volatility compression (HSRS) or Momentum/Trend confluence (Super AO).
Function: Great for catching explosive moves resulting from consolidation.
Module 12: Fisher Transform (MTF)
Logic: Converts price data into a Gaussian normal distribution.
Function: Identifies extreme price deviations. Uses Multi-Timeframe (MTF) logic to ensure you aren't trading against the major trend.
5. Global Inhibitors (The Veto Power)
Even if 12 out of 12 modules vote "Buy," Gypsy Bot performs a final safety check using Global Inhibitors.
Bitcoin Halving Logic: Prevents trading during chaotic weeks surrounding Halving events (dates projected through 2040).
Miner Capitulation: Uses Hash Rate Ribbons to identify bearish regimes when miners are shutting down.
ADX Filter: Prevents trading in "Flat/Choppy" markets (Low ADX).
CryptoCap Trend: Checks the total Crypto Market Cap chart for broad market alignment.
6. Risk Management & The Dump Protection Team (DPT)
Even in this Indicator version, the RM logic runs to generate Exit Signals.
Dump Protection Team (DPT): Detects "Nuke" (Crash) or "Moon" (Pump) volatility signatures. If triggered, it plots an immediate Exit Signal (Yellow Plot).
Advanced Adaptive Trailing Stop (AATS): Dynamically tightens stops in low volatility ("Dungeon") and loosens them in high volatility ("Penthouse").
Staged Take Profits: Plots TP1, TP2, and TP3 events on the chart for visual confirmation or partial exit alerts.
7. Recommended Setup Guide
When applying Gypsy Bot to a new chart, follow this sequence:
Set Timeframe: 4 Hours (4H).
Tune DPT: Adjust "Dump/Moon Protection" inputs first. These filter out bad signals during high volatility.
Tune Module 8 (MTI): Experiment with the MA Type (SSMA is recommended).
Select Modules: Enable/Disable modules based on the asset's personality (Trending vs. Ranging).
Voting Threshold: Adjust ActivateOrders to filter out noise.
Alert Setup: Once visually satisfied, use the "Any Alert Function Call" option when creating an alert in TradingView to capture all Buy/Sell/Close events generated by the engine.
8. Technical Specs
Engine Version: Pine Script V6
Repainting: This indicator uses Closed Candle data for all Risk Management and Entry decisions. This ensures that signals do not vanish after the candle closes.
Visuals:
Blue Plot: Buy/Sell Signal.
Yellow Plot: Risk Management (RM) / DPT Close Signal.
Green/Lime/Olive Plots: Take Profit hits.
Disclaimer:
This script is a complex algorithmic tool for market analysis. Past performance is not indicative of future results. Cryptocurrency trading involves substantial risk of loss. Use this tool to assist your own decision-making, not to replace it.
9. About Signal Lynx
Automation for the Night-Shift Nation 🌙
Signal Lynx focuses on helping traders and developers bridge the gap between indicator logic and real-world automation. The same RM engine you see here powers multiple internal systems and templates, including other public scripts like the Super-AO Strategy with Advanced Risk Management.
We provide this code open source under the Mozilla Public License 2.0 (MPL-2.0) to:
Demonstrate how Adaptive Logic and structured Risk Management can outperform static, one-layer indicators
Give Pine Script users a battle-tested RM backbone they can reuse, remix, and extend
If you are looking to automate your TradingView strategies, route signals to exchanges, or simply want safer, smarter strategy structures, please keep Signal Lynx in your search.
License: Mozilla Public License 2.0 (Open Source).
If you make beneficial modifications, please consider releasing them back to the community so everyone can benefit.
