Scripting Tutorial B - TManyMA - Commission/FeesThis script is for a triple moving average strategy where the user can select from different types of moving averages, price sources, lookback periods and resolutions.
Features:
- 3 Moving Averages with variable MA types, periods, price sources, resolutions and the ability to disable each individually.
- Crossovers are plotted on the chart with detailed information regarding the crossover (Ex: 50 SMA crossed over 200 SMA )
- Forecasting available for all three MAs. MA values are forecasted 5 values out and plotted as if a continuation to the MA.
- Forecast bias also applies to all forecasting. Bias means we can forecast based on an anticipated bullish , bearish or neutral direction in the market.
- To understand bias, please read the source code, or if you can't read the code just send me a message on here or Twitter . Twitter should be linked to my profile.
- Ribbons added and on by default. Optional setting to disable the ribbons. 5 ribbons between MA1 and MA2 and another 5 between MA2 and MA3.
- Ribbons are alpha-color coded based on their relation to their default MAs.
- Ribbons are only visible between MAs if the MAs being compared share the same Type, Resolution, and Source because there is no way to consolidate those three in a simple manner.
- Ribbon values are calculated based on calculated MA Periods between the MAs.
- Converted the existing study into a strategy.
- Strategy only enters long positions with a market order when MA crossovers occur.
- Strategy exits positions when crossunders occur.
- Trades 100% of the equity with one order/position by default.
- Ability to disable trading certain crosses with input checks.
- Ability to exit trades with a take profit or stop loss.
- User input to allow quick changes to the take profit or stop loss percentages.
- Strategy now calculates on every tick
- Strategy also includes fixed commission values based on Coinbase standard order fees
This script is meant as an educational script with well-formatted styling, and references for specific functions.
*** PLEASE NOTE - THIS STRATEGY IS MEANT FOR LEARNING PURPOSES. DEPENDING ON IT'S CONFIGURATION IT MAY OR MAY NOT BE USEFUL FOR ACTUAL TRADING. THE STRATEGY IS NOT FINANCIAL ADVICE ***
在腳本中搜尋"profit"

Scripting Tutorial A - TManyMA - StopsThis script is for a triple moving average strategy where the user can select from different types of moving averages, price sources, lookback periods and resolutions.
Features:
- 3 Moving Averages with variable MA types, periods, price sources, resolutions and the ability to disable each individually.
- Crossovers are plotted on the chart with detailed information regarding the crossover (Ex: 50 SMA crossed over 200 SMA )
- Forecasting available for all three MAs. MA values are forecasted 5 values out and plotted as if a continuation to the MA.
- Forecast bias also applies to all forecasting. Bias means we can forecast based on an anticipated bullish, bearish or neutral direction in the market.
- To understand bias, please read the source code, or if you can't read the code just send me a message on here or Twitter. Twitter should be linked to my profile.
- Ribbons added and on by default. Optional setting to disable the ribbons. 5 ribbons between MA1 and MA2 and another 5 between MA2 and MA3.
- Ribbons are alpha-color coded based on their relation to their default MAs.
- Ribbons are only visible between MAs if the MAs being compared share the same Type, Resolution, and Source because there is no way to consolidate those three in a simple manner.
- Ribbon values are calculated based on calculated MA Periods between the MAs.
- Converted the existing study into a strategy.
- Strategy only enters long positions with a market order when MA crossovers occur.
- Strategy exits positions when crossunders occur.
- Trades 100% of the equity with one order/position by default.
- Ability to disable trading certain crosses with input checks.
- Ability to exit trades with a take profit or stop loss.
- User input to allow quick changes to the take profit or stop loss percentages.
This script is meant as an educational script with well-formatted styling, and references for specific functions.
*** PLEASE NOTE - THIS STRATEGY IS MEANT FOR LEARNING PURPOSES. DEPENDING ON IT'S CONFIGURATION IT MAY OR MAY NOT BE USEFUL FOR ACTUAL TRADING. THE STRATEGY IS NOT FINANCIAL ADVICE ***

[VIP] Long/Short Strategy 79-80 Profit Percentage or even moreThis is using Toolkit buy and sell:
You have 7 days trial, so you should make sure that you make a profit instead of loss
We have 4 strategies named 01, 02, 03, 04 and will be added more soon
Disclaimer
Tested from 3 minutes to 1 Day time frame
Possible repainting because I use security function
I use Pinescript v4
barmerge.gaps is disabled
barmerge.lookahead is enabled
Configuration
Intense Level: default is 6, to provide signal frequency to the chart, the lower number will return more signal, the image is 3, means more attentions or actions*] Possible repainting because I use security function
Custom Timeframe: default is using chart time frame, to calculate signal based on different timeframes without change the chart time frame.
Strategy: Other approaches long or short algorithm

omid Strategy (Get over 1000% profit on Swing Trading)Make the highest possible profit in the market without any pressure, you will not need any other trading tool with this strategy, all the market noise has been eliminated.
*This strategy is tailored to the btcusd market and the default settings are proportional to the daily timeframe.
** You can change the settings to get the best results in other markets or timeframe.
***Get in position and relax for months.

Extreme ScalpingThis is a test of an easy scalping method: buy if actual close is below forecast close and sell if actual close is above forecast close. Take profit and stop loss shall be very small (few pips) as in most of scalping strategies.
No filter is used for only long or only short positions, but you can select buy only or sell only based on other indicators or whatever you feel is the direction of trading.
NOTE: you can add this strategy to your chart but you should modify the backtest day otherwise you will get an error due to calculation limits of pine script. For example, on one minute chart, you should set the backtest day from today only. For past days, set both start day and and day.
I have also a study with alarms.
Please use comment section for any feedback.

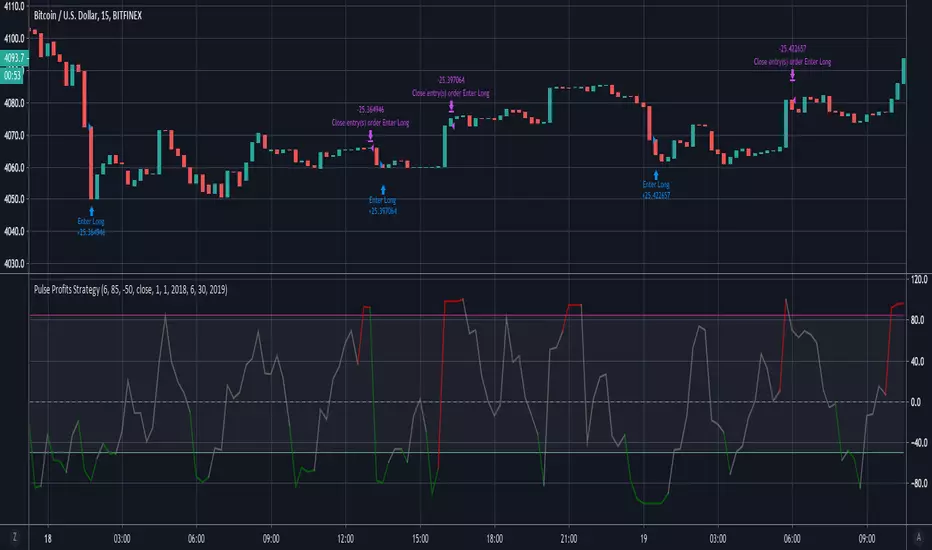
Pulse Profits Strategy v2.0This is the strategy version that is included with the Pulse Profits+ study. This strategy is based on the Chande Momentum Oscillator and Elder's Force Index(EFI).
The strategy includes options to add a stop loss and adjust all input options based on specific usage.

Pulse Profits+ StrategyStrategy Version of the Pulse Profits+ Indicator based on Elder's Force Index and Chande Momentum Oscillator.
The Rocket : Profit Factor [Bradford_Fournier]The Rocket
I hope this helps you as much as it has me.
Suggestions:
Use with tech stocks with reasonably high volatility
Time-frames are flexible but a 1-3month window is best.
REQUEST: If you find this useful, please let me know. I'd like to improve this script further. Any suggestions or encouragement are greatly appreciated
The rocket is based on my Trend Shift Indicator. Please take a look if you haven't yet.

Simple Stock StrategyThis is a simple and easy to use strategy for low-volatility stocks. It prints a BUY or SELL signal to alert you that certain conditions have been met. I use it as a time saver to help identify which charts I need to look at. You can adjust the inputs and properties to suit your needs. I would suggest allowing two or three orders.
BUY Signals
MACD Above 0
SMA Cross
Big Green Candles
SELL Signals
Profit Target %
Stop Loss %

13utc EUR/USD TariHi guys,
this new strategy is on 1hr chart eur/usd.
It's very easy to follow, becuase you will get 1 signal at 13Utc (1pm utc)
You have only to set Stop Loss @50 and Take Profit@60 (pips not ticks!), but to avoid mistakes green or red lines will appear on the chart to have a better view of Sl and TP.
So, what more? Nothing! Subscribe!
Enjoy your Wallet!
Tari.

Volatile Stocks - Simple Strategy w/Profit and StopThis strategy is based off of a script I wrote for another highly volatile asset, cryptocurrencies. It prints BUY and SELL signals based off of inputs that you can specify. I used this script as a time saver. If there is no signal on the chart, I'm less interested in analyzing it.
BUY SIGNALS
Bullish EMA Cross
Positive MACD Cross
Single-candle gains
SELL SIGNALS
Profit %
Stop Loss %
Naturally, I don't trade based off of the BUY and SELL signals alone, but it does help me identify the most important charts to look at.

Simple Alt Coin Strategy - EMA and MACD w/Profit and StopThis script prints BUY and SELL signals based on settings you input. I use it to save time while scrolling through charts deciding what alts I want to look at.
BUY SIGNALS
Positive EMA Crossover
Positive MACD Crossover
Single Candle Gains
SELL SIGNALS
Profit Capture
Stop Loss
I don't trade based just on the BUY or SELL from this strategy, but I have found that these indicators do very well well looking at the large cap alt coins. It backtests well.
Default Settings EMA 5/12/50, MACD 9/12/26, Single Candle Gain 10%, Stop 10%, Profit Capture 45%

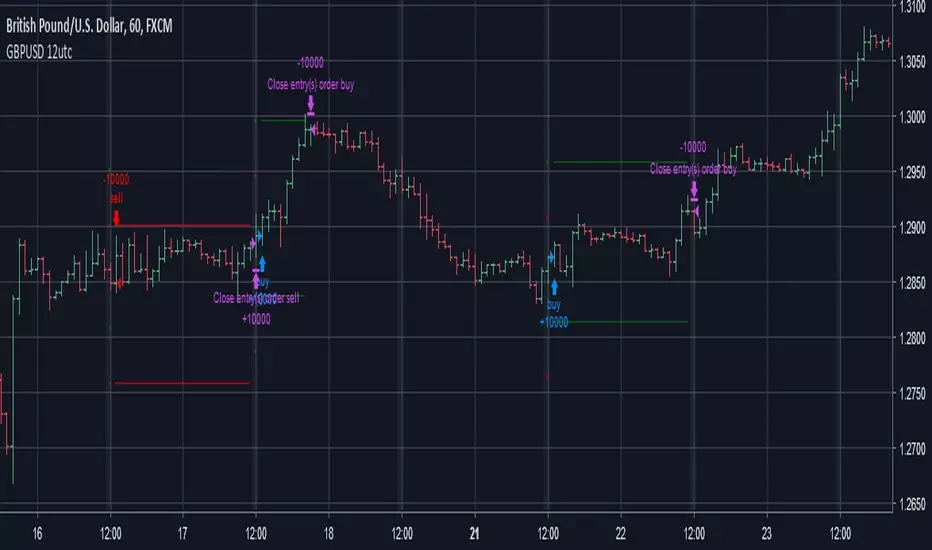
GbpUsd 12utc limitHi guys,
this strategy is a development of 12utc. I used some more filters to have less false entries. So of course getting less signals the net profit is going to be smaller, but the profit factor increased.
Everyday at 12 utc check the chart for a signal. If it appears you can set the Stop Loss 30 pips and Take Profit 120 pips from the open of the candle, and let it run! Green and red lines will be generated to see these limits.
In this strategy, running on 1hour chart gbpusd, I set 4 pips of spread. The equity line comes with a stop loss of 34 pips and a take profit of 116 pips, and this is you see 4 pips of gap between the limit lines and the closin price.
Subscribe to use it!
Enjoy your wallet!
Tari.
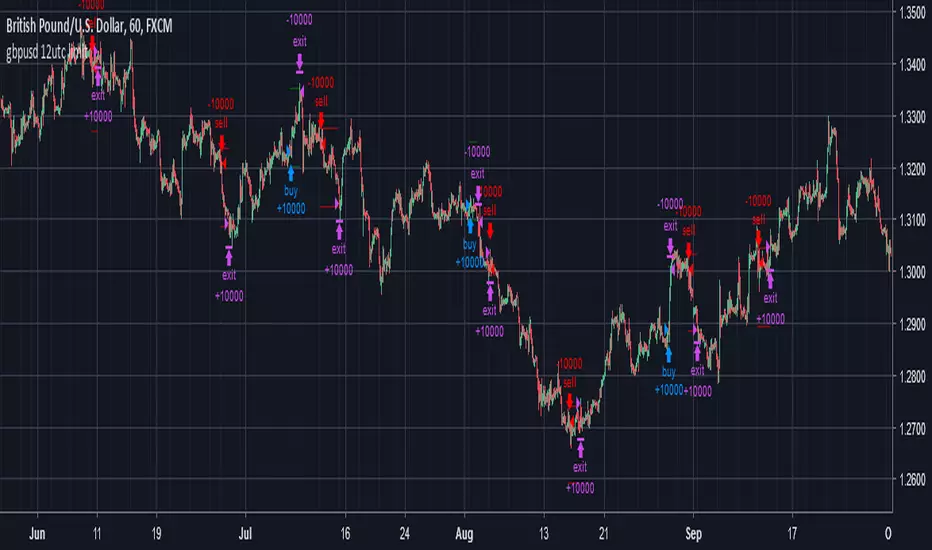
GBPUSD 12utcHi guys,
this is 1hour chart gbpusd strategy.
You will get a signal (long or short) at 12utc, and some corsses will appear to sel Stop Loss and Take Profit (green for the long positions and red for the short ones). After one hour the crosses will become lines, and if none of them will be hit, you will have to close manually from 11 to 12 utc of the day after.
This strategy closes the position at 11utc, but feel free to close it even a few seconds before 12utc, so you will watch this chart only once per day.
To get this strategy subscribe!
Enjoy your wallet!
Tari.
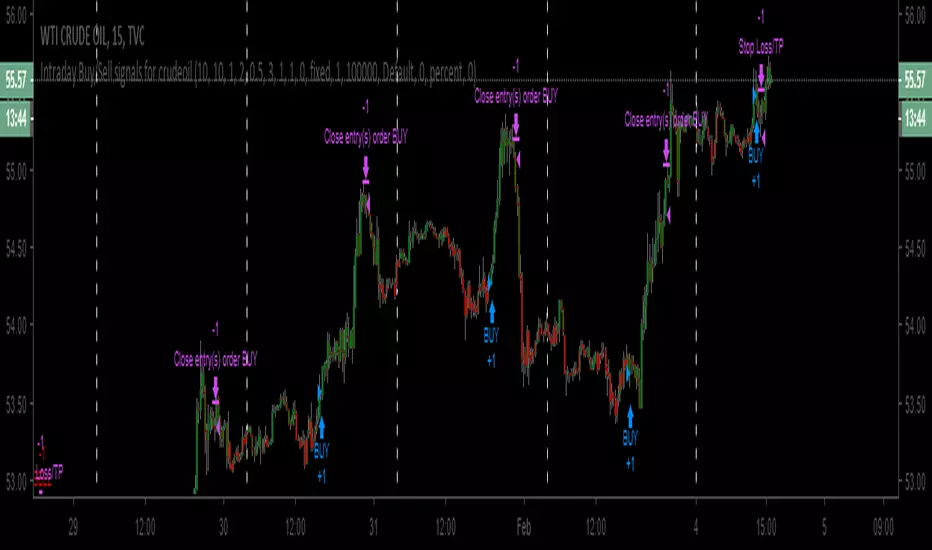
Intraday Buy/Sell signals for CrudeoilHi Everyone,
This is higly tuned intraday Buy/Signal generator for Crudeoil. It works on any time frames below 30 mins. But, the best setting is 15 mins.
How to use:
1. Just, apply this strategy to your crudeoil WTI instrument
2. Set your time frame to 15 mins
3. Buy the instrument whenever buy signal generates / Sell the intrument whenever buy singal generates
4. Strategy itself has 0.5% stop loss generating signals. But, create stop loss of 0.5% after buying/selling the instrument
5. Finally, whenever close signals triggers, just close the trade.
Note: Please try with only one lot at the beginning. If everything goes well after testing, mulitple lot can be used.
Disclaimer:
This strategy is for testing purpose only. Any profit/loss to the user's capitla is subject to market risk. And, the creator of this script is no where responsible.
RSI Trade Emulting for ProfitYou can get your profit with easy RSI indicator and can also add stop loss rate.

Doji strategyThis is a simple strategy based on Doji star candlestick.
It places two orders: buy stop at doji star high or previous candle high and sell stop at doji star low or previous candle low.
Exit rules are with take profit and fixed stop loss or take profit and stop loss at doji min or max.
This strategy works very well with high time frames like Daily and Weekly because those are without noise in doji formation.
Each currency pair has its own optimal setting for TP and SL: it's up to user find the best ones.
I could implement SL based on ATR, maybe in next revision.
Please use comment section for any feedback.
Next improvement (only to whom is interested to this script and follows me): study with alerts on multiple tickers all at one. Leave a comment if you want to have access to study.

Autoview/Profit Trailer Scalping StrategyScalping and Dollar Cost Averaging strategy specifically intended for use with Autoview + Profit Trailer.

The Falcon v2 Long only strategy Using Stop loss and take profitHello,
Here is a backtest result from the beginning of the year on BTC. The white line is the Buy & Hold return.
Comission is set to 0.05% and there is no repainting : the price variable I'm using is heikenashi(tickerid).
The indicator is built upon RSI, EMAs and some other personnal tricks so predict trends.
I coded a stop loss and take profit system : the script will simply buy and sell upon conditions.
As usual I am selling access to the script, If some are interested I will publish an alert setup version. I am also open to development or reverse engineering commissions.


TigerBot Pivot Profit Taker Skeleton (Faster Backtesting)Visit our website or direct message us to learn how you can get started with TigerBot automation today!
This strategy is a custom solution that we have provided. At this time, it is a private, invite only script.
Note: This is a TigerBot Strategy, which means that it includes our full set of automation and risk management features such as:
Thorough event triggers for automated order execution
Profit/Loss Zones
Profit/Loss Indicators
Take Profit
Normal Stop Loss
Trailing Stop Loss
Advanced Trailing Stop
Profit Locker Stop Loss
Advanced Pyramiding Support
Leverage Support
Much more
Each TigerBot Strategy includes a set of 3 scripts that belong together:
STRATEGY - used for full-featured customization with all our visuals
STUDY - with alert triggers for automation
SKELETON - for faster backtesting without the visuals enabled
This is the SKELETON version of this script. Please also see the other 2 related scripts.

TigerBot Pivot Profit Taker Strategy (Backtesting)Visit our website or direct message us to learn how you can get started with TigerBot automation today!
This strategy is a custom solution that we have provided for one of our clients. At this time, it is a private, invite only script.
Note: This is a TigerBot Strategy, which means that it includes our full set of automation and risk management features such as:
Thorough event triggers for automated order execution
Profit/Loss Zones
Profit/Loss Indicators
Take Profit
Normal Stop Loss
Trailing Stop Loss
Advanced Trailing Stop
Profit Locker Stop Loss
Advanced Pyramiding Support
Leverage Support
Much more
Each TigerBot Strategy includes a set of 3 scripts that belong together:
STRATEGY - used for full-featured customization with all our visuals
STUDY - with alert triggers for automation
SKELETON - for faster backtesting without the visuals enabled
This is the STRATEGY version of this script. Please also see the other 2 related scripts.

HMA_PPT StrategyHMA_X & Pivot Profit Taker combo
LOL!
change the settings to suit your favorite pair/TF before cry yourself to sleep.
doesnt repaint? ----> YOU TELL ME :-D
