Linear Regression Relative Strength[image/x/iZvwDWEY/
Relative Strength indicator comparing the current symbol to SPY (or any other benchmark). It may help to pick the right assets to complement the portfolio build around core ETFs such as SPY.
The general idea is to show if the current symbol outperforms or underperforms the benchmark (SPY by default) when bought some certain time ago. Relative performance is displayed as percent and is calculated for three different time ranges - short (1 mo by default), mid (1 quarter), and long (half a year). To smooth the volatility, the script uses linear regression to estimate the trend and takes the start and the end points of the linear regression line to compute the relative strength.
It is important to remember that the script shows the gain relative to SPY (or other selected benchmark), not the asset's gain. Therefore, it may indicate that the asset is profitable, but it still may lose value if SPY is in downtrend.
Therefore, it is crucial to check other indicators before making a decision. In the example above, standard linear regression for one quarter is used to indicate the direction of the trend.
在腳本中搜尋"profitable"

Banker Chips Turnover & Divergence Index(MYTRIC)█ OVERVIEW
Development of this toolkit is to understanding information provided by the market in depth before trading.
The main reason for losing money or not being profitable is that you do not understand the information given by the market.
If you master the information given by the market, the number of losses will be greatly reduce.
We composed a lot of algorithms module and innovative indicators,
to provide endless possibilities and meet all trading styles.
Our toolkit works in global trading market and any indices, through algorithms we extract 9️⃣ major information in the market.
Which 9️⃣ major market information are include :
• Overall Trend
• Trend Phase
• Demand & Supply
• Price Risk
• Game Theory
• Banker Chips
• Chart Pattern Meaning
• Business Model (Stocks)
• Companies Financial Health (Stocks)
This indicator provides 1️⃣ market information among the 9️⃣ major information.
The 1 market information as below :
✅ - Banker Chips (banker collect / banker disposed)
【Banker Chips Turnover & Market Divergence Index(MYTRIC)】
❌ - Game Theory
【Bull Bear Momentum Indicator】
❌ - Demand & Supply
【Dt Smart Trend (MYTRIC)】 & 【Bull Bear Momentum Indicator】
❌ - Price Risk
【Dt Smart Trend (MYTRIC)】 & 【Bull Bear Momentum Indicator】
❌ - Overall Trend
【Dt Smart Trend (MYTRIC)】
❌ - Trend Phase
【Dt Smart Trend (MYTRIC)】
❌ - Chart Pattern Meaning
【coming soon】
❌ - Business Model
【we didn't provide】
❌ - Companies Financial Health
【Financial Intelligent Evaluation】
██████████████████████████████████████████████████████████████████████████████████████████████████████████████████████
——————————————————————————————————————————————————————————————————————————————————————————————————————————————————
█ What market information does this indicator tell you ?
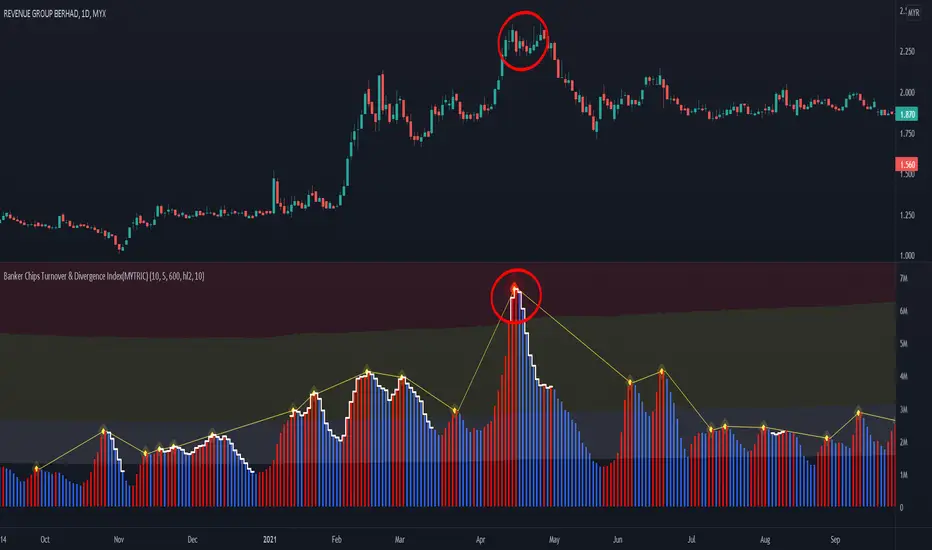
The Banker Chips Turnover & Divergence Index(MYTRIC) indicator is telling you 'Banker chips' or 'Market maker' activities.
• Track abnormal trade in the market.
The Banker Chips Turnover & Divergence Index(MYTRIC) indicator used to measure the divergence index of current trend and prices, a way to measure the potential accumulation or distribution of chips by banker or main force.
This indicator are calculation according to the relationship between volume and price, this is one of the methods to quantify "volume & price analysis". Volume & price analysis can provide insight the behavior of banker.
When the index appears at the high of the price, it mean banker may be distributing/disposing, the price is very soon to retracement(if retailer have a big support) or downtrend.
When the index appears at the low of the price, it mean banker may be accumulating/acquiring, if it break-out, the upward trend will be considerable.
The Banker Chips Turnover & Divergence Index(MYTRIC) indicator is used to track 'Banker' collecting & distribution activity.
Let you know the 'Banker' intention in advance to prevent 'Rug-pull or stock scammer' 'Chinese call '割韭菜 or 杀猪盘''.
We also can use this indicator to spot is the current market is a scam or Chinese call '杀猪盘', to avoid losing your huge capital in a moment.
• Usually the histogram bar excessive to 'Extremely High Turnover Area', we will judge it as a scam and '杀猪盘'
██████████████████████████████████████████████████████████████████████████████████████████████████████████████████████
——————————————————————————————————————————————————————————————————————————————————————————————————————————————————
█ CASE STUDY
before case study must know the every color intention.
• Histogram Bar = Market divergence index or Banker Chips Turnover Index
• White Step Line Above Bar = High probability of Banker Chips activity
• Red line is only mark up the peak of index above high turnover
• Must be attention when the higher histogram bar in higher level price, the price may fall or plunge after breaking support.
• Must be attention when the higher histogram bar in lower level price, the price may rise or skyrocket after breaking resistant.
Color Description :
Case Study 01 :
Scam Stock 1 HKEX:1343
——————————————————————————————————————————————————————————————————————————————————————————————————————————————————
Scam Stock 2 HKEX:3893
——————————————————————————————————————————————————————————————————————————————————————————————————————————————————
Scam Stock 3 MYX:VINVEST
Vinvest 1 , before pump activity
Vinvest 2 , after dump activity
——————————————————————————————————————————————————————————————————————————————————————————————————————————————————
Case Study 4 BINANCE:BTCUSDT
English News.
www.bloomberg.com
Chinese News.
www.chinapress.com.my
——————————————————————————————————————————————————————————————————————————————————————————————————————————————————
Case Study 5 MYX:SCIB
RGB Color FiddlerKEEP YOUR COINS FOLKS! I DON'T NEED THEM, DON'T WANT THEM. Many other talented authors on TV deserve them.
INTRODUCTION:
This is my "RGB Color Fiddler", intended as a toy to play with. This colorcator is rated 'E' for every TV member. With this you can quickly generate about 1.67 million potential colors from color.rgb(). While I have a few preferred colors that are ideal for use, this allows you to finely tune colors to anything that pleases your eye on your canvas.
TIPS:
The overlay chart can be peppered with colors of all varieties, so it's necessary to have properly distinguished coloring and contrast separation. If you employ light charts, you can tweak colors to just the right shade you desire on your display. Not all LCDs are created equal, even when color calibrated. With specific discovered colors tailored to your liking, you may uniquely color code ALL of your indicators.
UTILITY:
The input()s in Settings allow up to 4 different colors to tinker with and compare. After selecting focus of an input, you can easily use the up/down keyboard keys to make swift adjustments numerically or with options. The color combos you are creating will be displayed in color hex or a RGB representation within the labels.
Also of great benefit, is the ability to cycle through the currently available plot() styles. Some styles will require you to zoom in closeup to observe their behaviors. There is a few other ways to finagle plot() parameters to also achieve other acrobatic effects that are not demonstrated here. Closer study of plot() parameters in the reference can reveal those. Anyhow, I won't bother you with more elaborate technical jargon, now is the time to fiddle with this toy to your benefit!
CODE REUSE:
Any member has the freedom to use any of the code in this script any way they see fit. It's specifically intended for all. There is absolutely no need for accreditation for any of this code reuse ever, in the present case. Don't worry about, I'm certainly not.
When available time provides itself, I will consider your inquiries, thoughts, and concepts presented below in the comments section, should you have any questions or comments regarding this indicator. When my indicators achieve more prevalent use by TV members , I may implement more ideas when they present themselves as worthy additions. Have a profitable future everyone!

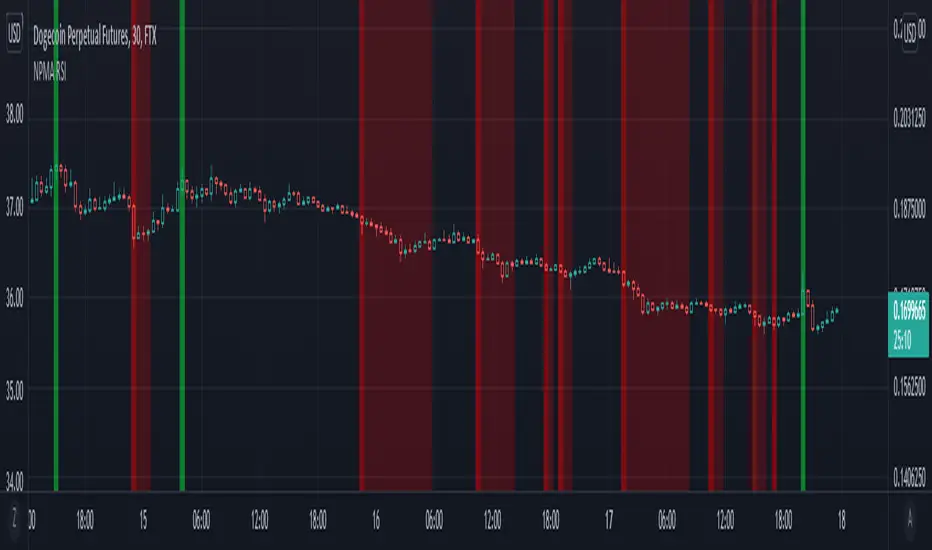
NPMA Relative Strength IndexRecently been amased by the potential of percentile nearest rank. You can apply this to almost any indicator to find extremes, this script might the simplest form of using it while being very powerful. The background will color green when the rsi is in the top percentage ranges of last X amount of bars. I'm currently searching optimal settings to apply this to a simple 3commas bot. Feel free to comment good settings and help the community out making profitable bots.
PSv5 Color Magic and Chart Theme SimulatorKEEP YOUR COINS FOLKS! I DON'T NEED THEM, DON'T WANT THEM. Many other talented authors on TV deserve them.
INTRODUCTION:
This is my "PSv5 Color Magic and Chart Theme Simulator" displayed using Pine Script version 5.0. The purpose of this PSv5 colorcator is to show vivid colors that are most suitable in my opinion for modifying or developing Pine scripts. Whether you are new to Pine or an experienced Pine poet, this should aid you in developing indicators with stunning color from the provided color list that is easily copied and pasted into any novel script you should possess. Whichever colors you choose, and how, is up to your imagination's capacity.
COMMENTARY:
I have a thesis. Pine essentially is a gigantor calculator with a lot of programmable bells and whistles to perform intense analytics. Zillions of numbers per day are blended up into another cornucopia of numbers to analyze. The thing is, ALL of those numbers are moot unless we can informatively portray them in various colorized forms with unique methods to point out significant numeric events. By graphically displaying them with specific modes of operation, only then do these numbers truly make any sense to us and become quantitatively beneficial.
I have to admit... I hate numbers. I never really liked them, even before I knew what an ema() was. Some days I almost can't stand them, and on occasion I feel they deserve to be flushed down the toilet at times. However, I'm a stickler for a proper gauge of measurements. Numbers are a mental burden, but they do have "purpose and meaning". That's where COLOR comes in! By applying color in specific ways in varying dynamic forms, we can generate smarter visual aids from these numerics. Numbers can be "transformed" into something colorful it wasn't before, into a tool, like a hammer. But we don't need a hammer, we need an impressive jack hammer for BIG problem solving that we could never achieve in the not to distant past.
As time goes on, we analytically measure more, and more, and more each year. It's necessary to our continual evolution. That's one significant difference between us and cave men, and the pertinent reason why we are quickly evolving as a species, while animals haven't. Humankind is gifted to enumerate very well AND blessed to see in color. We use it for innumerable things in the technological present for purpose and pleasure. Day in and day out, we take color for granted, because it's every where we can look. The fact is, color is the most important apparatus in humankind's existence EVER. We wouldn't have survived this far without it.
By utilizing color to it's grand potential, greater advancements can be attained while simultaneously being enjoyed visually. Once color is transformed from it's numeric origins into applicable tools, we can enjoy the style, elegance, and QUALITATIVE nature of the indication that can be forged. Quantities can't reveal all. Color on the other hand has a handy "quality" factor to it, often revealing things we can't ordinarily recognize. When high quality tools provide us with obtained goals, that's when we will realize how magical color truly is, always has been, and shall always be.
The future emerging economies and future financial vessels of people around the globe are going to be dependent on the secured construction of intelligent applications with a rock solid color foundation, not just math alone. I have no doubt about that. I can envision that with my eyes closed. To make an informed choice, it should be charted or graphed somehow prior to a final executive decision to trade. Going back to abysmal black and white with double decimal points placed next to cartoons within extinction doomed newspapers is not a viable option any more.
OBSERVATIONS AND UTILITY:
One thing you will notice is the code is very dense. Looks almost hideous right? Well, the variable naming is lengthy, but it's purpose is to be self explanatory, even for those who don't know how to program, YET. I'm simply not a notation enthusiast. My main intention was to provide clearly identifiable variables from their origin of assignment to their intended destination of use, clearly visible for anyone visiting. The empowerment of well versed words that are easier to understand, is a close rival to the prominent influence color has.
Secondly, I'm displaying hline() and label.new() as prime candidates to exemplify by demonstration how the "Power of Color" can be embraced with the "Power of Pine". Color in Pine has been extensively upgraded to serve novel purposes to accomplish next generation indicators that do and WILL come to exist. New functions included with PSv5 are color.rgb(), color.from_gradient(), color.r(), color.g(), color.b(), and color.t() to accompany color.new() in our mutual TV adventures. Keep in mind, the extreme agility of color also extends to line.new(), the "entirely new" linefill.new(), table.new(), bgcolor() and every other function that may utilize color.
There's a wide range of adjustability in Settings to make selections to see how they perform on different backgrounds, with their size and form. As you curiously toy with those, you're going to notice how some jump out like laser beams while others don't. Things that aren't visually appealing, still have very viable purposes, even if they don't stand out in the crowd. Often, that's preferable. The important thing is that when pertinent information relative to indication is crucial, you can program it with distinction from an assortment of a potential 1.67 million colors that can be created in Pine. "These" are my chosen favorite few, and I hope you adopt them.
PURPOSES:
For those of you who are new to Pine Script, this also may help you understand color hex/rgb and how it is utilized in Pine in a most effective manner. The most skilled of programmers can garner perks as well. There is countless examples of code diversity present here that are applicable in other scripts with adequate mutation. Any member has the freedom use any of this code in this script any way they see fit. It's specifically intended for all. There is absolutely no need for accreditation for any of this code reuse ever, in the present case. Don't worry about, I'm not.
The color_tostring() will be most valuable in troubleshooting color when using color.rgb() and becoming adept with it. I'm not going to be able to use color.rgb() without it. Chameleon indicators of the polychromatic variety are most likely going to be fine tuned with color_tostring() divulging it's results to label.new() or even table.new() maybe. One the best virtues of this script in chart, is when you hover over the generated labels, there's a hidden gift for those who truly wish to learn the intricate mechanics of diverse color in Pine. Settings has informative tooltips too.
AFTERTHOUGHTS:
Colors are most vibrant on the "Black Chart" which is the default, but it doesn't currently exist as a chart theme. With the extreme luminous intensity of LCDs in millicandela( mcd ), you may notice "Light" charts may saturate the colors making charts challenging to analyze. Because of this, I personally use "Dark Charts" and design my indicators specifically for these. I hope this provides inspiration for the future developers who are contemplating the creation of next generation indicators and how color may enhance their usefulness.
When available time provides itself, I will consider your inquiries, thoughts, and concepts presented below in the comments section, should you have any questions or comments regarding this indicator. When my indicators achieve more prevalent use by TV members , I may implement more ideas when they present themselves as worthy additions. Have a profitable future everyone!

Scalping 1minMost trustworthy indicator for 1 minutes trader! This indicator is the same as the Bollinger band but much more reliable with extremely on-point signals! a lower line means buy, upper lines mean sell, the middle line is an extremely powerline so trade on the middle line will be mostly profitable!
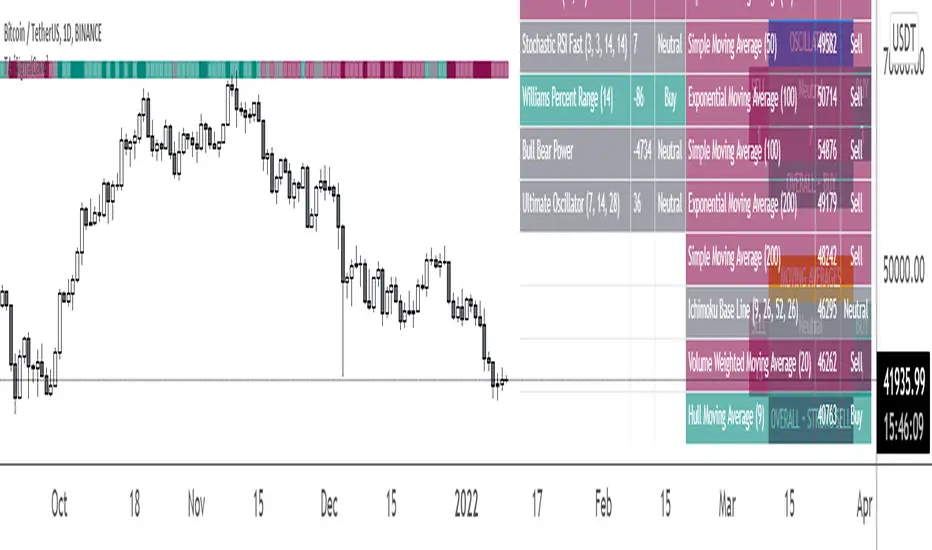
Technical Analysis & Ratings [SignalCave]Technical Analysis, Technical Ratings
Technical analysis display real-time ratings. It based on the most popular technical indicators such as RSI, Stochastic, CCI, ADX, AO, Momentum, MACD, Stochastic RSI, Williams %, Ichimoku Cloud, SMA, EMA, VWMA and HMA.
Technical analysis is a built-in function on TradingView. You can access any asset’s technical analysis page and see it’s performance in real time.
"Technical Analysis & Ratings Indicator" brings this function into your TradingView charting screen. Indicator allows you to see the same output without visiting any external web page in TradingView. Indicator also works on every timeframe and asset class.
Technical Ratings is a technical analysis tool that combines the ratings of several technical indicators to make it easier for traders and investors to find profitable trades.
Technical Ratings can be a valuable technical analysis tool for many analysts or traders. Many traders use a selection of complementary indicators to make better decisions. Technical Ratings simplifies this task by combining the most popular indicators and their signals.
Alerts are available for "Strong Buy, Buy, Natural, Sell and Strong Sell" conditions.
Type asset name on symbol search area.
Adjust your timeframe that you wish to track.
Click "Create Alert"
Select one of the condition that you wish to get inform from create alert panel.
Select "Once Per Bar Close" option.
Click "Create" .
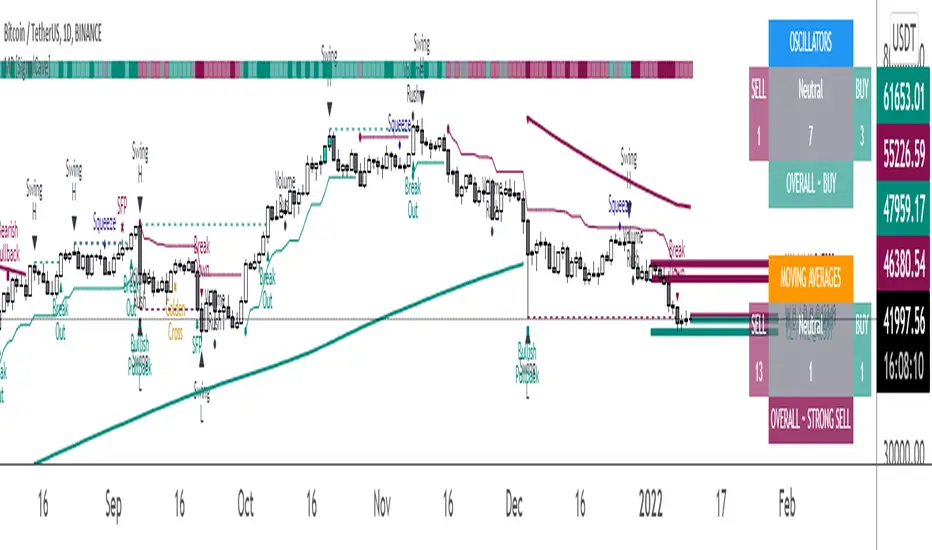
Multi-Purpose All in One [SignalCave]Multi-Purpose All in One Indicator Functions
1) Technical Analysis, Technical Ratings
2) Pivots, Primary & Secondary Trends
3) Swings, Engulfs, Golden & Death Crosses, Price Squeezes, Pullbacks, Breakout & Breakdowns, Volume Rushes
4) Momentum Strength
1) Technical Analysis, Technical Ratings
Technical analysis display real-time ratings. It based on the most popular technical indicators such as RSI, Stochastic, CCI, ADX, AO, Momentum, MACD, Stochastic RSI, Williams %, Ichimoku Cloud, SMA, EMA, VWMA and HMA.
Technical analysis is a built-in function on TradingView. You can access any asset’s technical analysis page and see it’s performance in real time.
"Multi-Purpose All in One" indicator brings this function into your TradingView charting screen. Indicator allows you to see the same output without visiting any external web page in TradingView. Indicator also works on every timeframe and asset class.
Technical Ratings is a technical analysis tool that combines the ratings of several technical indicators to make it easier for traders and investors to find profitable trades.
Technical Ratings can be a valuable technical analysis tool for many analysts or traders. Many traders use a selection of complementary indicators to make better decisions. Technical Ratings simplifies this task by combining the most popular indicators and their signals.
2) Pivots, Primary & Secondary Trends
Helps you to identify primary and secondary trends and potential support/resistance zones.
Trend detection have three modes which are “Aggressive, Moderate and Conservative” . You can customize the mode on settings screen.
3) Swings, Engulfs, Golden & Death Crosses, Price Squeezes, Pullbacks, Breakout & Breakdowns, Volume Rushes
A swing low is when price makes a low and is immediately followed by consecutive higher lows. Likewise, a swing high is when price makes a high and is followed by consecutive lower highs.
Swing Failure Pattern (SFP) is a type of reversal pattern that can be used as buy or sell signals.
Engulfing candles tend to signal a reversal of the current trend in the market. This specific pattern involves two candles with the latter candle 'engulfing' the entire body of the candle before it.
On this indicator, bullish engulfs visible only on downtrend and oversold conditions. Bearish engulfs visible only on uptrend and overbought conditions.
The death cross and golden cross are technical analysis terms for when a moving average (MA) intersects with another from either above or below.
The cross, depending on which it is, can signal the start of a new trend or the end of one.
Squeeze signs signifies low volatility, market preparing itself for an explosive move up or down direction.
Bullish Pullbacks are widely seen as buying opportunities after an asset has experienced a large upward price movement. Most pullbacks involve an asset's price moving to an area of technical support , such as a moving average, before resuming their uptrend.
Bearish Pullbacks are widely seen as selling opportunities after an asset has experienced a large downward price movement. Most pullbacks involve an asset's price moving to an area of technical resistance , such as a moving average, before resuming their downtrend.
A breakout refers to when the price of an asset moves above a resistance area, breakdown refers to when the price of an asset moves below a support area.
Breakouts/breakdowns indicate the potential for the price to start trending in the breakout direction.
For example, a breakout to the upside from a chart pattern could indicate the price will start trending higher.
Volume rush signs appears when the trading volume increases more then a usual period. It can be useful with combining breakout signals as a confirmation.
4) Momentum Strength
Momentum Indicator helps you to identify potential reversal areas .
Calculation done with using Relative Strength Index (RSI), Money Flow Index (MFI) and Average Directional Movement Index (ADX) indicators.
On full strength bearish movement bars paints as light red , full strength bullish movement bars paints as light green color.
They indicates that trend can be change to opposite direction in a short period of time.
Momentum Strength have three modes which are "Aggressive, Moderate and Conservative" . You can customize the mode on settings screen.
Synthetic Price Action GeneratorNOTICE:
First thing you need to know, it "DOES NOT" reflect the price of the ticker you will load it on. THIS IS NOT AN INDICATOR FOR TRADING! It's a developer tool solely generating random values that look exactly like the fractals we observe every single day. This script's generated candles are as fake as the never ending garbage news cycles we are often force fed and expected to believe by using carefully scripted narratives peddled as hypnotic truth to psychologically and emotionally influence you to the point of control by coercion and subjugation. I wanted to make the script's synthetic nature very clear using that analogy, it's dynamically artificial. Do not accidentally become disillusioned by this scripts values, make trading decisions from it, and lastly don't become victim to predatory media magic ministry parrots with pretty, handsome smiles, compelling you to board their ferris wheel of fear. Now, on to the good stuff...
BACKSTORY:
Occasionally I find myself in situations where I have to build analyzers in Pine to actually build novel quantitative analytic indicators and tools worthy of future use. These analyzers certainly don't exist on this platform, but usually are required to engineer and tweak algorithms of the highest quality with the finest computational caliber. I have numerous other synthesizers to publish besides this one.
For many reasons, I needed a synthetic environment to utilize the analyzers I built in Pine, to even pursue building some exotic indicators and algorithms. Pine doesn't allow sourcing of tuples. Not to mention, I required numerous Pine advancements to make long held dreams into tangible realities. Many Pine upgrades have arrived and MANY, MANY more are in need of implementation for all. Now that I have this, intending to use it in the future often when in need, you can now use it too. I do anticipate some skilled Pine poets will employ this intended handy utility to design and/or improved indicators for trading.
ORIGIN:
This was inspired by the brilliance from the world renowned ALGOmist John F. Ehlers, but it's taken on a completely alien form from its original DNA. Browsing on the internet for something else, I came across an article with a small code snippet, and I remembered an old wish of mine. I have long known that by flipping back and forth on specific tickers and timeframes in my Watchlist is not the most efficient way to evaluate indicators in multiple theatres of price action. I realized, I always wanted to possess and use this sort of tool, so... I put it into Pine form, but now have decided to inject it with Pine Script steroids. The outcome is highly mutable candle formations in a reusable mutagenic package, observable above and masquerading as genuine looking price candles.
OVERVIEW:
I guess you could call it a price action synthesizer, but I entitled it "Synthetic Price Action Generator" for those who may be searching for such a thing. You may find this more useful on the All or 5Y charts initially to witness indication from beginning (barstate.isfirst === barindex==0) to end (last_bar_index), but you may also use keyboard shortcuts + + to view the earliest plottable bars on any timeframe. I often use that keyboard shortcut to qualify an indicator through the entirety of it's runtime.
A lot can go wrong unexpectedly with indicator initialization, and you will never know it if you don't inspect it. Many recursively endowed Infinite Impulse Response (IIR) Filters can initialize with unintended results that minutely ring in slightly erroneous fashion for the entire runtime, beginning to end, causing deviations from "what should of been..." values with false signals. Looking closely at spg(), you will recognize that 3 EMAs are employed to manage and maintain randomness of CLOSE, HIGH, and LOW. In fact, any indicator's barindex==0 initialization can be inspected with the keyboard shortcuts above. If you see anything obviously strange in an authors indicator, please contact the developer if possible and respectfully notify them.
PURPOSE:
The primary intended application of this script, is to offer developers from advanced to even novice skill levels assistance with building next generation indicators. Mostly, it's purpose is for testing and troubleshooting indicators AND evaluating how they perform in a "manageable" randomized environment. Some times indicators flake out on rare but problematic price fluctuations, and this may help you with finding your issues/errata sooner than later. While the candles upon initial loading look pristine, by tweaking it to the minval/maxval parameters limits OR beyond with a few code modifications, you can generate unusual volatility, for instance... huge wicks. Limits of minval= and maxval= of are by default set to a comfort zone of operation. Massive wicks or candle bodies will undoubtedly affect your indication and often render them useless on tickers that exhibit that behavior, like WGMCF intraday currently.
Copy/paste boundaries are provided for relevant insertion into another script. Paste placement should happen at the very top of a script. Note that by overwriting the close, open, high, etc... values, your compiler will give you generous warnings of "variable shadowing" in abundance, but this is an expected part of applying it to your novel script, no worries. plotcandle() can be copied over too and enabled/disabled in Settings->Style. Always remember to fully remove this scripts' code and those assignments properly before actual trading use of your script occurs, AND specifically when publishing. The entirety of this provided code should never, never exist in a published indicator.
OTHER INTENTIONS:
Even though these are 100% synthetic generated price points, you will notice ALL of the fractal pseudo-patterns that commonly exist in the markets, are naturally occurring with this generator too. You can also swiftly immerse yourself in pattern recognition exercises with increased efficiency in real time by clicking any SPAG Setting in focus and then using the up/down arrow keys. I hope I explained potential uses adequately...
On a personal note, the existence of fractal symmetry often makes me wonder, do we truly live in a totality chaotic universe or is it ordered mathematically for some outcomes to a certain extent. I think both. My observations, it's a pre-deterministic reality completely influenced by infinitesimal amounts of sentient free will with unimaginable existing and emerging quantities. Some how an unknown mysterious mechanism governing the totality of universal physics and mathematics counts this 100.0% flawlessly and perpetually. Anyways, you can't change the past that long existed before your birth or even yesterday, but you can choose to dream, create, and forge the future into your desires and hopes. As always, shite always happens when your not looking for it. What you choose to do after stepping in it unintentionally... is totally up to you. :) Maybe this tool and tips provided will aid you in not stepping in an algo cachucha up to your ankles somehow.
SCRIPTING LESSONS PORTRAYED IN THIS SCRIPT:
Pine etiquette and code cleanliness
Overwrite capabilities of built-in Pine variables for testing indicators
Various techniques to organize Settings panel while providing ease of adjustment utility
Use of tooltip= to provide users adequate valuable information. Most people want to trade with indicators, not blindly make adjustments to them without any knowledge of their intended operation/effects
When available time provides itself, I will consider your inquiries, thoughts, and concepts presented below in the comments section, should you have any questions or comments regarding this indicator. When my indicators achieve more prevalent use by TV members , I may implement more ideas when they present themselves as worthy additions. Have a profitable future everyone!

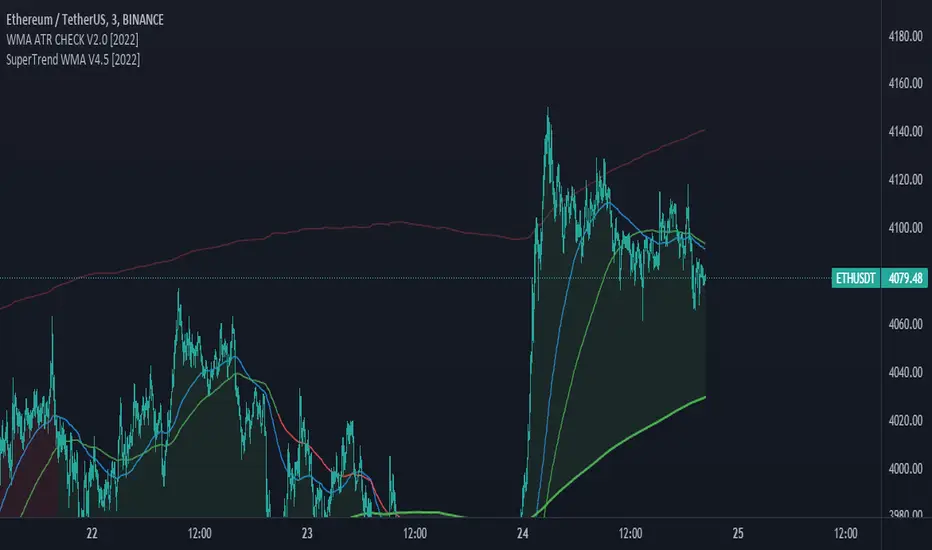
SuperTrend WMA V4.5 [2022]STRATEGY version of SuperTrend WMA V4.5 Indicator:
We added and fixed the PERIOD section, adjust the interval to only work for M3 M30 H4.
M3 used for daily processing
M30 used for weekly processing
H4 used for monthly processing
Each time period can tell a trend and a market journey.
The most important thing is to stay on top of the average probability. We are trying to create a model of mean that differs in the form of two time periods merged into one period.
SuperTrend WMA is the most important indicator for Market Trend analysis.
This is the version you can trade for the following. Trend by M15 is the most profitable trend on Trend following
SuperTrend V1.5 (2021) The settings cannot be modified because we believe that the numbers we set for the market will be exact and accurate. with trading experience and proper use
You can use the 1 minute ( M1 ) interval to check the market gap in the 1 day boundary.
You can use the 15 minute ( M15 ) interval to check the market gap in the 1 week boundary.
You can use the 4 hour ( H4 ) interval to check the market gap in the 1 Month boundary.
All three of these periods can be used together because they are the corresponding periods with the market averages.
We use averages to read market probabilities. It consists of complex time gaps built up to 3 different average levels.
The line WMA Green indicates an uptrend where we believe not to sell during that period. It will put you at risk of losing.
The line WMA Red indicates a possible downtrend. We intend not to make a purchase during that time as it may damage you.
Buy or sell signals are on the words. BUY OR SELL, The use of signals must be based on the trend.
For example, an uptrend would like to buy only, not sell because it is against the average.
We believe that anything can fool us, but the average cannot tell us this is why we intend for everyone to use the indicator SuperTrend WMA V4.5
And we sincerely hope that it'll be useful to everyone. And our team will continue to develop to make the use better.
Trailing Stop AlertsThis script is designed as an ATR-based trailing stop tool to assist in managing open positions.
Once you're involved in a profitable trade, if you add this script to your chart you'll be prompted to select a bar to begin trailing from.
You can then adjust the candle lookback distance for swing high/lows (7 by default), the ATR multiplier (1.0 by default), and the direction to trail (Long/Short).
You can also adjust the ATR period in the settings menu if you want to (14 period by default).
Once the script is added to your chart, it will begin drawing your trailing stop and you can then set up alerts.
Alert Options:
Any alert() function call : Will trigger an alert for both conditions (trailing stop updated, trailing stop hit)
Alert Conditions : Trailing Stop Update will trigger whenever the stop is updated, Trailing Stop Hit will trigger whenever the stop is hit.
Note: the alerts will only fire once per bar close and the trailing stop will not update on realtime bars.

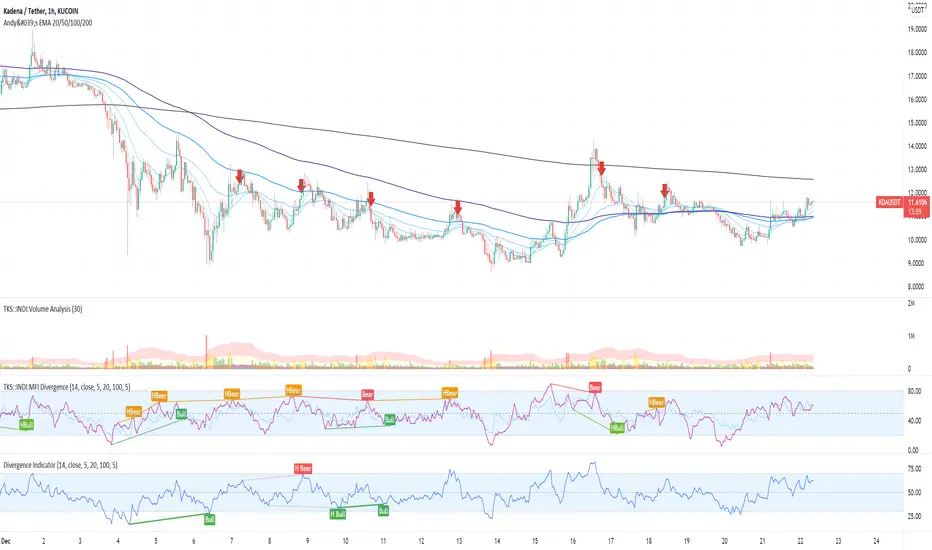
MFI Divergence Indicator Our Developer Malin converted the built-in RSI divergence indicator to MFI (Money Flow Index).
How to apply?
Notice 1: MFI, unlike the RSI, incorporates volume. It thus is an indicator of a higher precision when it comes to finding the the moment to sell - or - the moment to enter.
Notice 2: In Ranging Markets MFI (and RSI) is a solid momentum indicator to buy or sell. The asset displayed shows a slight markdown. Thus, we are looking primarily for short positions. Once can tell by us omitting the first 2 hidden bearish divergence signals and then entering the market.
Notice 3: Divergences depend on pivot points. The drawback with pivot points is that it is a lagging indication of a potential reversal. The more time (bars) one takes to confirm a reversal the less profitable is the trade - but less risky. In the charts one can tell that we enter the market 5 bars later. Usually that is not the tip of the reversal.
Notice 4: One must adapt the left and right periods of the indicator to risk/reward ratio, length of swing / frequency modulation and volatility of the price action.
Credits: Credits go to the Tradingview Team for delivering the original code. And Malin for the conversion. Please keep the copy right as a courtesy.
Deviation MasterDeviation Master, Revision 1, 18Dec2021
1. Deviation Master, an indicator for Trend Analysis.
2. Deviation Master presents itself in the form of solid candles without upper and lower tails.
3. Deviation Master can be used to detect potential Top Deviation and Bottom Deviation, besides being able to show the up or down trend.
4. Top Deviation : while price is moving up, Deviation Master is moving down, as shown in the attached chart.
5. Bottom Deviation : while price is moving down or moving side way, Deviation Master is moving up, as shown in the attached chart.
6. During an up trend, Deviation Master typically will be above 0 and follows the trend, vice versa.
7. When Deviation Master is moving up from below 0 , towards 0, and crossover 0, it can be a potential bottom catch.
When Deviation crossover 0, typically, price candle may crossovers EMA21 or stands above EMA21.
Default band is 0, user can turn on two additional levels per user input value if there is a need.
User can turn on Deviation Master's EMA of 5,13,21,34 or user-input respectively. Shown on chart is EMA21 for reference.
8. User can turn on the Rainbows to see the changes of Deviation Master.
During an uptrend, green colour rainbows may spread out upwards. During a downtrend, red colour rainbows may spread out downwards.
9. User can turn on to show table to candle status and value.
10. User can turn on the alerts to show Green turns Red or Red turns Green alerts. Do note that only past 50 bars' alerts will be shown.
11. With the publish of Deviation Master, the author has laid the basic sets of Banker/Smart Money related indicators, namely
Chips Master, BBD Master, MCDX Plus, Trend Master, Ladder Master, Deviation Master
Chips Master for studying chips accumulating by banker/smart money
BBD Master for studying the big buy deviation by banker/smart money
MCDX Plus for studying the profitable and locked chips
Trend Master for studying the Trends
Ladder Master for studying the Trends reversal (mid term) and short term entry/exit
Deviation Master for studying the Top and Bottom Deviation.
Disclaimer :
1. Attached chart is for the purpose of illustrating the indicator, no recommendation of buy/sell.
2. Based on feedback received wrt previously published indicators by the author, namely:
open source code : Chips Master, BBD Master, MCDX Plus, and Trend Master
there may be unethical individual with no respects of author's effort and intellectual property, either
a. claiming the published indicators as theirs, for their own business purpose, or
b. claiming paying the author to develop the scripts, for their own business purpose, or
c. modify the scripts for their own business purpose
In view of this, the scripts will be locked for the time being to prevent those unethical malpractice.
Public users can still use the indicator for their technical analysis. Hope this help.

RSI Bands [APIDEVs]RSI BANDS:
It is an exclusive product of ApiDevs , this indicator selectively integrates a series of highly advanced algorithms that aim to provide the trader with an effective and profitable trading system, based on a series of conditions that project the price direction with a reasonable probability.
This indicator bears the name of “RSI Bands” , this is because we have based this trading system on the “Relative Strength Index (RSI)” , the strength of this indicator is centennial and we at APIDEVs have decided to focus our efforts on the development of powerful tools based on the favorite indicators of the afternoon.
WHAT IT HAS INCORPORATED:
1. Exponential Moving Average (EMAs): The RSI Bands has, by default, a band composed of two moving averages of 10 and 55 exponential periods, which can be modified in the indicator menu.
• Possibility of changing the value of the EMAs.
• Function was enabled to change the color and transparency of the bands.
• Visual alerts SHORT (L) and LONG (L) were added when there is the crossing of the EMAS.
• Hull Moving Average (HMA) of 100 periods was also incorporated, also modifiable for those who wish to strengthen their visual analysis. (Disabled by default)
• We also add an Exponential Moving Average (EMA) of 200 periods to mark the trend. (Disabled by default).
2. A TR (Average True Range): This indicator has two main functions in the RSI Bands, the first is to mark the trend of the asset and the second is to establish a margin of safety in price volatility, that is, a maximum estimate of the setbacks without this representing a change in the direction of the price.
3. RSI (Relative Strength Index): It was visually incorporated into the RSI Bands, the graph is obtained on the right side and its purpose is to visually indicate where the price is with respect to the RSI PRO+ indicator, offering the following improvements :
• ALERT SYSTEM: THE RSI PRO+ has the ADX incorporated into its algorithm, which allows establishing a filter that will provide reliable inputs, represented by the LONG (L) and SHORT (S) signals.
• FILTER AGAINST TREND: The signals described above will be activated according to the crossing of the RSI above the 50 point, provided that the ADX agrees with the market direction.
• Possibility of deactivating this graphical representation.
4. ADX (Average Directional Index): The ADX in this indicator is intended to estimate the strength of the movement, it is present in each part of the code, either to indicate the strength of the market or to serve as a filter against trend. In the same way, we apply certain exclusive improvements for this indicator:
• It was established as default values of the ADX that the Level Range was 10 and the Level Trend 25. This significantly changes the behavior of this indicator, almost completely eliminating the zone of disinterest that was usually considered.
• A function was activated to paint the sails the color of the ADX.
5. ADX Ocillator: Yes, we developed a Wave oscillator type ADX and incorporated it into this strategy. From this indicator, which we recommend using in conjunction with the RSI Bands, we extracted the LONG (L) and SHORT (S) signals. The ADX Oscillator is the improved version of the traditional ADX as it offers the following improvements:
• Its interpretation is much simpler.
• Allows you to set entry and exit signals during the trend change and during the price path.
• It has an integrated alert system.
STRATEGY PANEL:
This panel is an exclusive creation of APIDEVs , and its purpose is to parameterize five conditionals based on the indicators that make up our RSI strategy, giving the trader an immediate vision of the status of the asset analyzed considering this strategy. That is, we decided to transfer our experience of using this indicator on a panel that will project the price trajectory visually. It has the following characteristics:
• It can be placed anywhere on the screen through the main menu of the indicator, it can even be deactivated.
• It can be resized, we designed this to adapt to all types of screens, including those of mobile phones.
• It has an upper panel called "Project" which will calculate the percentage probability that the price has to take a direction based on all the indicators incorporated into the strategy. Their values range from (+ 100%) to (-100%).
STRATEGY PANEL PARAMETERS:
1. EMAs : This panel has 2 variables:
• LONG : If the fast EMA is above the slow EMA.
• SHORT : If the fast EMA is below the slow EMA.
2. RSI : This panel has 3 variables:
• LONG : The RSI should be bullish (green) and above the 50 point.
• SHORT : The RSI should be bearish (red) and be below the 50 point.
• RANK: (Range)this condition is activated when there is no concordance with the RSI condition and its crossing.
3. ATR : This panel has 2 variables:
• LONG : When the price is above the ATR.
• SHORT : When the price is below the ATR.
4. ADX: This panel has 3 variables:
• LONG : The ADX is green. That is, the DI + is above the DI-.
• SHORT : The ADX is red. That is, the DI- is above the DI +.
• RANK : ADX is below point 10.
It also has a numerical value that indicates the value of the ADX and two texts indicating the strength of the trend:
• Trend (bullish or bearish).
• Strong trend (bullish or bearish).
5. OSC : This panel has 3 variables:
• LONG : The oscillator slopes upward and the built-in ADX is green.
• SHORT : The oscillator slopes downward and the built-in ADX is red.
• RANK : The oscillator slopes downward and the built-in ADX is green and the opposite. In short, there is no coherence in the movement of the oscillator and the projection of the ADX.

Supertrend NinjaSupertrend Ninja
The Basics
The Supertrend Ninja is a trend-following indicator. The indicator is optimised for daily, 2 days and 3 days candlesticks and can be used on varying trending markets.
Supertrend Ninja using 2 days candlesticks only gave 7 bullish signals in 2020 and 2 in 2021 for Bitcoin/USDT (based on Binance charts). Greatly reducing false signals. It can be used on lower time frames as well, although you will encounter more noise.
This indicator could be used as a compass for DCA or TV bots as well.
What To Look For
When the background of the candlestick closes green with an upwards pointing pink arrow. It indicates a possible bullish (up)trend. To enter a trade its best to place an order a few ticks above the candle high. This way we only enter a position, when there is trend continuation.
When the background of the candlestick closes red with a downwards pointing black arrow. It indicates a possible bearish (down)trend. To enter a trade its best to place an order a few ticks below the candle low.
Exits can be determined by Fibonacci extensions, orderblocks or other resistances to name a few. Or exit the trade when the opposite background color appears.
Final words
Disclaimer: Please use it with care and at own risk. The owner of this indicator is not liable for any financial losses.
Past performance is no guarantee of future returns.

Elevated Leverage index System - ELiSELEVATED LEVERAGE index SYSTEM (ELiS) tries to solve the problem of adjusting meaningful leverage in futures and margin trading.
The biggest problem for traders is adjusting the leverage level manually.
Concerning about the volatilities it's very hard to set a meaningful leverage level.
ELiS includes 4 different volatility component which are:
1- nATR: Normalized Average True Range which is actually ATR/price to stabilize ATR's value differences when price changes are high on long term periods.
2- Standard Deviation
3- Kairi based nATR
4- Bollinger %B
which are scaled from 0 to 100 and takes different averages with different combinations & ratios and combines them as an index.
This index calculates an average volatility to set the true leverage level when trading futures especially in Crypto and FX markets.
There are 5 risk levels of "GEARS" like on automobiles to set the max leverage for risk management.
Gear 1 - CONSERVATIVE: max leverage level can be 20 for swing traders and beginners
Gear 2 - STANDARD: max leverage level can be 25 (default) for day traders
Gear 3 - AVERAGE: max leverage level can be 33 for day traders
Gear 4 - RISKY: max leverage level can be 50 for scalpers
Gear 5 - AGRESSIVE: max leverage level can be 100 for advanced scalpers
default length for ATR, Standard Deviation and %B are all 50
Simply:
When markets aren't volatile: ELiS indicateshigher leverage values to maximize profits.
When markets are volatile enough: ELiS indicates lower values to reduce risk level.
hope you all enjoy ELiS on profitable trades.

Swing Dream - PAINT BARS | MA | EMA | DMA | VWAP | TABLE | ADR %- Swing Dream -
Script created for breakout-swing traders, in the style of QullaMaggie * , Dan Zanger, Oliver Kell, and Stockbee.
The following indicators are used by most successful breakout-swing traders such as mentioned above.
(As published) it contains:
Painted Bars, also known as inside/outside candles. Used for candle analysis and to determine breakout pivots & levels. For instance; use it in different timeframes and seek formations (ex, 3-1-2). For further inspiration, study Rob Smith's The Strat .
MA, Simple Moving Averages (Basic levels = 10,20,50,200). Use this indicator to define resistance/support areas as well as the overall long/swing-term trend. In breakout strategies such as EP, Flags, etc this can be used for trailing stops; an example, post-breakout, let the price ride the 20ma before exiting your position.
EMA, Exponential Moving Averages with periods inspired by Qullamaggie (10,20,65). Use this on shorter timeframes (ex, 1h) and for the same principles as MAs.
VWAP, Volume-Weighted Average Price. As for the previous, utilize this as a level indicator to find areas of resistance/support. Good for swing-trading as it implies whenever holders are profitable or not.
DMA, Displaced Moving Average (Horizontal). Personally, I use this a lot. Works very well for trailing stops (post breakout) and "bounce" areas. Choose your own offset and period.
ADR%, Average Daily Range Percentage. Displayed in the table and used to define a symbol's volatility. A very good tool for Qullamaggie-style trading. Personally, I try to find setups with over 6% ADR. Basic definition; low ADR% = Increased chance of a symbol to move slower and in smaller ranges. A higher value equals the opposite.
Table. A table with basic symbol-related information. Could save you plenty of time whenever you scan or search for new swing setups. Looking to add more features here.
Why should you use this script? Well, instead of having tens of different indicators, use this script and combine everything together with EP, Flag, or breakout principles. Suited for every plan, and more efficient in my opinion.
View settings to turn on/off different indicators.
* If you're looking for an introduction and further explanation of how Qullamaggie uses mentioned indicators, I could recommend checking out his website, stream, or participation in "Chat With Traders".
At last, I want to credit: @jkcqld @neolao @TheScrutiniser
This Script will get updated and improved.
// TechFille006

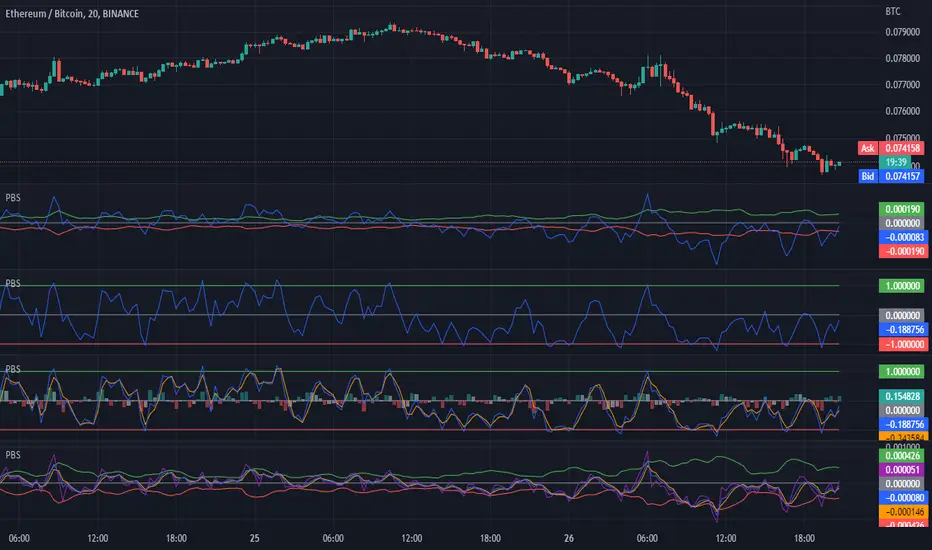
H/L Price Band with Signal Line (PBS)This indicator centers a moving average around the hl2 of the price. This is calculated as the difference of two moving averages. The upper band is a 9 period exponential moving average, the lower band is a 7 period moving average and the center line is the average between the two. The "Fast Line" is our signal line in this oscillator. When the price is hovering around the center of the band this indicates that a trend is pausing or reversing. When the fast line exits the band this could be a buy or sell signal. It could also indicate a very strong trend in that direction. To get the optimal entry and exit you might want to wait for the price to return to the center line. In addition to the basic functionality of this indicator I have added some bonus features. You can enable the "Slow Line" or the "Long Line" to enhance your signals. When the fast line is above the slow/long line you are in an up trend and inversely when the fast line is below the slow/long line you are in a down trend. The crossing of these lines can indicate a reversal. I have also included a "J" style amplification line. This works by enhancing the difference between the Fast and Slow/Long line to make it more visually apparent. You can also configure the "J" line to be calculated between either the slow or long line. Finally I have added the feature to amplify the band width by the standard deviation. This is set to 1 by default but you can also get a more responsive signal by setting this to 0.
This indicator works in most markets. There is a tool tip for every aspect of this indicator explaining how everything works. I hope you are very profitable with this one!
If you find this indicator is useful to you, Star it, Follow, Donate, Like and Share.
Your support is a highly motivation for me.
Volume Based Ichimoku CloudIntroduction
This release focuses primarily on a volume-based Donchian. For some time I was looking for a volume-based Donchian, not finding anything that satisfied me I tried to apply one, and then I applied it to Ichimoku.
I found advantages especially in the lateralization phase, where the integration with the volume filters some false signals.
I have added some features:
- Check the conditions of buy/sell of classic Ichimoku
- Verified reverse buy/sell condition
- Alerts
- Entrance package
- possibility to choose the type of Donchian to use (classic, volume-based)
Settings
There are the classic parameters of Ichimoku, for scalping, I use setting like(6-17-34-17 or 5-14-28-14), the new parameters are:
Donchian Type : Classic / Volume Based
Show Condition : it shows green/red square on the bottom when all the conditions of Ichimoku are satisfied, without the checkmark the inputs or the alarms will not work for this type of signal
Show Reversal : it shows yellow/purple triangle on the bottom when all during short/long state condition of Ichimoku Tenkan cross the Kijun, without the checkmark the inputs or the alarms will not work for this type of signal
Trades Framework
Show Trade Lines : show the lines for Entry Point, TP1, TP2, SL
Per n Bars : For how many bars the sending lines will be drawn
Enter Gap : It's the gap, in percentage, from the last candle low/high. For example, the entry point will be set 0.1% higher than the last high of the candle, in a long situation, or 0.1% lower than the last low of the candle in a short situation.
Take Profit 1 : It's the gap, in percentage, from the entry point. For example, the first take profit will be set 0.5% higher/lower than the entry point.
Take Profit 2 : It's the gap, in percentage, from the entry point. For example, the second take profit will be set 0.5% higher/lower than the entry point.
Stop Loss : It's the gap, in percentage, from the entry point. For example, the stop loss will be set 0.5% higher/lower than the entry point.
How to use
The use will be like that for the classic Ichimoku, the combination with a volatility indicator or the volume analysis will certainly help to reduce false signals and therefore to select only the most profitable signals.
Remember that every statistical indicator is just a tool, it needs to be understood to be used at its best, otherwise, it is just a colored line in a colored graph.

Financial Intelligent Eval [Fundamental] (MYTRIC)█ OVERVIEW
Financial Algorithm is a system to quickly understanding company fundamental, and judge the company type based on their financial condition.
All evaluation from the system is the result of combination with Balancing Calculation and Company Historical Financial Data(Financial Report) by using over than 30 financial ratios.
This indicator are classified into 5 level (Very Weak, Weak, Moderate, Good, Excellent)
Advantages of Financial Algorithm
• By combining and calculating company's latest 4 quarterly report, provide rating to help investor quickly know about company's fundamentals and financial performance.
• Able to identify company have what kind of strength, weakness, chance and threat. For instance, according to current economic situation, is it an advantages or a threat for a company, investor can identify it via Financial Algorithm.
• Able to identify which company have better business management by keep following the company rating, observe the improvement level of company's.
Application
*When notice there are not improvement on a company's fundamentals or financial performance which is profitable without further developing, it usually reveals the lack of management capability to generate more value, company unable to fully utilise its profit, reinvest and expanding its business to become more competitive. Sometimes this kind of company may be suspected accounting fraud.
█ BENEFITS
• Avoid investing in companies suspected of financial fraud.
• To quickly understanding company's fundamental and financial structure.
• Able to analyze whether the company build profit after it is used to optimize the company's internal
█ FEATURES
You can configure the following attributes of the display:
• Table position on your chart.
• The size and colour of text.
• Language between English and Chinese.
• Rating bar chart colour.
• On / Off Statement Review Helper Function
• On / Off 3 Years Evaluation Function
• On / Off Basic Information
• Full descriptions of each evaluation and content are included in the settings
█ LIMITATIONS
• When changing the indicator's inputs, allow around 20 seconds calculation for the change to be reflected in the display.
• This system only able to evaluate non-financial industry.
• This system is based on company's historical financial report data to generate the results and rating, it does not includes prediction from any external factor.
(External Factor: Business Model, Business Distribution & Geography, Corporate Structure, Competitor and Peer company's, Prospect, Costing Breakdown, Disaster and etc)
• Any results calculated by this system all is based on data provided by Tradingview, Data may have some tolerance, we recommend that users pay attention to the official quarterly/annual report.
█ FINANCIALS INTELLIGENT ALGORITHM FUNCTION
This lists all combination calculate financials.
01. Total Revenue
02. Earnings before interest and tax
03. Net Income
04. Property, Plant, and Equipment
05. Total Receivables
06. Cash and short-term Investments
07. Cash & Cash equivalents
08. Total Liability
09. Working Capital
10. Total Debt
11. Total Equity
12. Retained Earnings
13. Total Asset
14. Cash From Operating Activities
15. Income before extraordinary items
16. Total depreciation and amortization
17. Free Cash Flow
18. Altman Z-score
19. Cash to Debt Ratio
20. Current Ratio
21. Debt to Assets Ratio
22. Debt to Equity ratio
23. EBITDA Margin
24. Free Cash Flow Margin
25. Grahams Number
26. Net Margin
27. Price Book Ratio
28. Piotroski-F Score
29. Quick Ratio
30. Return on Assets
31. Return on Equity
32. Return on Invested Capital
33. Float Shares Outstanding
34. Total Common Shares Outstanding
35. Cash to Revenue
36. Cash to Market Capital
37. Cash to Debt
38. Receivable Turnover
39. Quality of Earning
40. Market Capital
8 financial evaluation :
3 years financial evaluation tracking :
Statement Review Helper :
█ HOW TO MAKE THE RIGHT INVESMENT OR TREND TRADING DECISION BASED ON OUR EVALUATION
Avoid mid/long term invest in companies with poor financial evaluation, only suite for trend trading. The below following assessments need to be focused.
• Comprehensive rating is poor or below.
• Quality of Earning is very poor or below.
• Receivability is very poor or below (Total Receivable is too high)
• Before : Poor Financial Strength with revenue growth
• After : The price dropped by about -80% within 2 months
███████████████████████████████████████████████████████████████████████████████████████████
• Before : Poor Financial Strength with revenue growth
• After : The price dropped by about -90% within 1 year
███████████████████████████████████████████████████████████████████████████████████████████
• Before : Excellent Financial Strength
• After : Steady growth
Steady growth
• Conclusion :
Do not judge it as a good company just because it has continuous income.
When we analyze the company's financial report, we should not only look at the company's revenue,
we should pay more attention to the company's finances and weaknesses.
Only companies with strong financial strength that can expand their business in a stable manner.
Disclaimer :
*The following conclusion are purely based on my personal opinions and views, it’s only for study and research, without any trading and investment advice.

Chop Shop Indicator for Options TradersAs always, this is not financial advice and use at your own risk. Trading is risky and can cost you significant sums of money if you are not careful. Make sure you always have a proper entry and exit plan that includes defining your risk before you enter a trade.
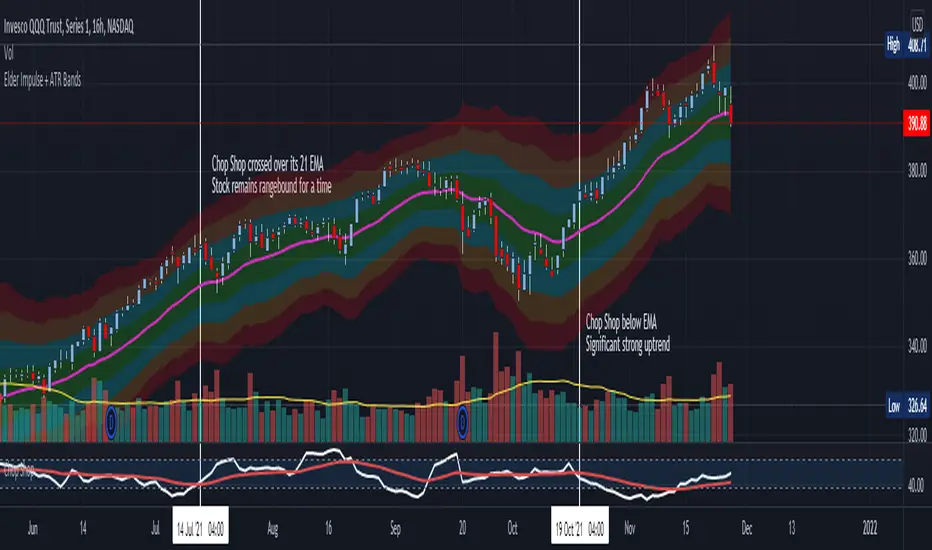
This is for all of you options traders out there who choose to write options and collect premium. Since we seem to be a neglected bunch when it comes to indicators, I figured I would write a script that helps identify when underlyings are in a range and a good time to sell some premium when we are waiting for the next directional setup. This is the choppiness index modified to include a 21-period exponential moving average as a trigger, which I am calling the Chop Shop. The choppiness index , at its most basic, takes a log-scaled version of the summed Average True Range (ATR --- a volatility measurement) and converts it into an oscillator. The higher the oscillator value, the higher level of "chop" the stock is experiencing. This is often referred to as the stock is trading in a range. Most traders are advised to stay out of range trading because it is difficult. However, for an options trader this is an opportune time to collect some premium using bracketed short strike trades such as strangles, straddles, iron condors, or iron butterflies that are profitable when the stock stays rangebound and realizes a drop in volatility .
The indicator is extremely basic. You should look to collect premium and write these types of bracketed trades when Chop Shop crosses over its 21-period EMA . You should look to avoid writing bracketed trades when the Chop Shop trades below its 21-period EMA as this is when a stock is seeing a strong directional movement and can be considered trending. These are usually times when you want to get out of the way of the runaway train and make sure you are on the correct side of the trade or you can quickly get smoked. Use a combination of other indicators to help assist you define the most likely continued direction of the trend and you can then write directional premium trades such as credit spreads, directional Iron Condors, and butterflies to capture this and avoid stepping in front of that moving train.
Open Range Breakout With Take Profit Zones
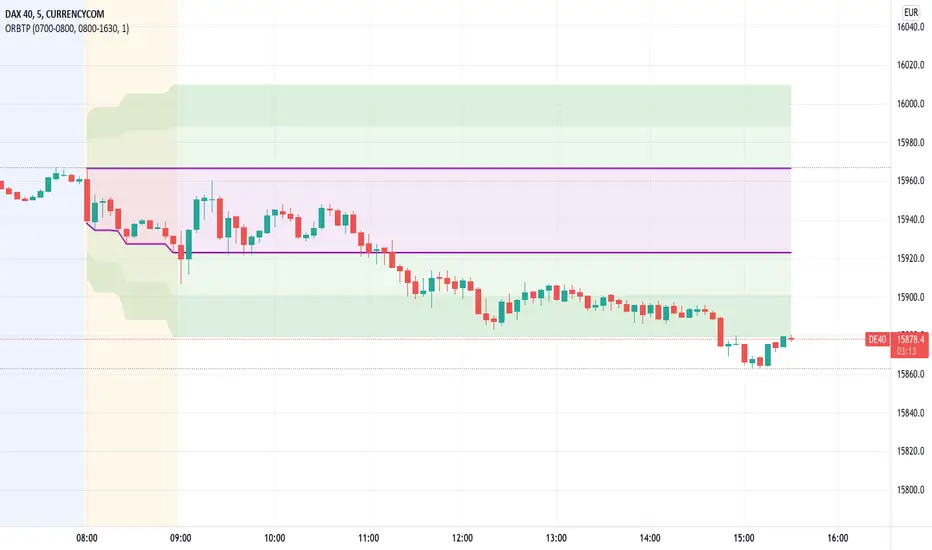
Open Range Breakout With Take Profit Zones prints the open range and profitable zones based on the high and low during the opening hours.
This indicator can be used to prepare breakout trades following the OPR strategy. The time window for the open range as well as for the market hours can be configured. Also custom alerting templates allow to create alerts when a breakout out of the opening range occurs or when 50% take profit level is reached.
The background of pre and post market hours is coloured according to the configured time windows.
This indicator was written to support scalping and day trading. It does not calculate or display results on hourly, daily or weekly charts.
The open range and trading hours must be adjusted to the market time zone of your instrument. Also please take care that these settings are saved on the layout and not per instrument. Eventually create multiple layouts for instruments with different market time zones.
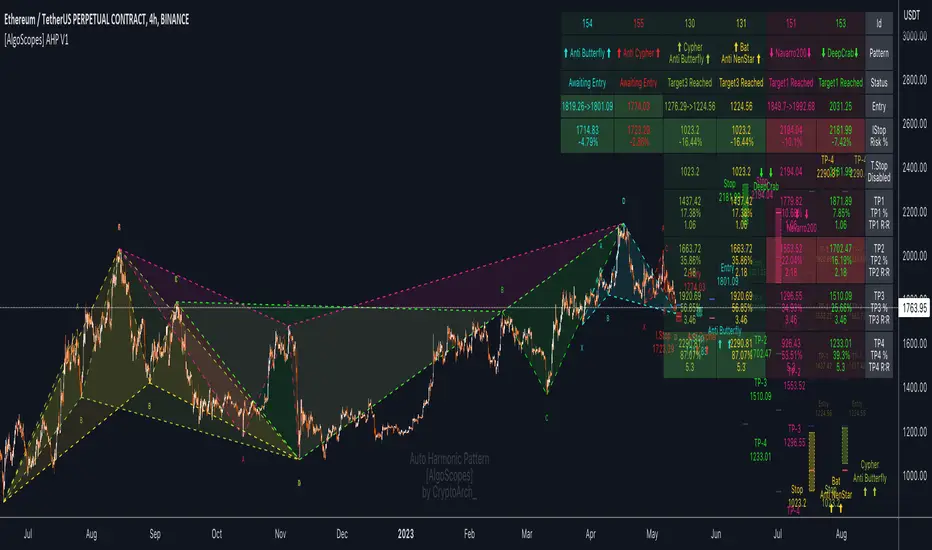
Auto Harmonic Pattern - PRO [AlgoScopes] V1Harmonic Patterns is a powerful tool for identifying potential reversal areas in the financial markets. Auto Harmonic Pattern Pro it is based on the work of Scott Carney, a renowned trader and author who developed the concept of harmonic patterns.
Scott Carney's extensive research and contributions have greatly enhanced our understanding of market patterns and their application in trading. Auto Harmonic Pattern Pro is adapted from Scott Carney's original work on harmonic patterns, as well as other sources that have contributed to the recognition and understanding of harmonic patterns beyond Carney's initial research.
Auto Harmonic Pattern Pro offers traders a valuable tool for identifying potential reversal zones in the markets. We would like to express our gratitude to Scott Carney for his pioneering work in developing harmonic patterns, as well as to the various contributors and sources that have expanded our knowledge and understanding of harmonic patterns beyond Carney's original research.
Remember to always practice proper risk management and combine the indicator's signals with other technical analysis tools for a comprehensive trading approach.
For more information about Scott Carney and his work on harmonic patterns, you can find additional resources on his official website.
💠 ABOUT THE SCRIPT
💎 DISPLAY
⚬ The following things are displayed by default on the chart
🔸 Live patterns in trade with XABCD labels. (filled major triangle)
🔸 Entry, Stop and Target levels on chart for all live patterns. Target level are dimmed along with reducing size when they become irrelevant
🔸 Open Trades Stat table - Show patterns ID, patterns name, status for patterns, size&age, Entry, I.Stop, T.Stop and Targets (TP1 - TP4).
⚬ Highlighted present stop (and/or trailing stop if is enabled) and next target
⚬ When there are multiple patterns on chart, Entry, Stop, and Target labels & lines & PRZ* boxes are created with specific distance from each other to provide clarity to the users
*(potential reversal zone)
⬜ SETTINGS
⚬ Let's talk about some of the settings. Almost all of these settings have already been optimized and tested over time, but for some tickers it might be better to do a new test.
💎 ZIGZAG
🔸 Length - Default is set to 8. User can change settings but it is a good idea to keep with fibonacci (5, 13, 21, 34, 55 etc)
🔸 Depth - This setting is for how many pivots indicator scan to find harmonic pattern. By default it is set as 200
🔸 Recursive Algorithm - Enabled will use recursive instead standard zigzag
💎 HARMONIC PATTERN SETTINGS
🔸 Trade Direction - Default is set to show all (bearish and bullish) harmonic patterns. Can be filtered to bullish or bearish direction.
🔸 Error Percent - Default is 8. That is error percent tolerance from perfect pattern ratio.
🔸 Maximum patterns - Maximum patterns allowed on chart at any time
⚬ When it reaches the maximum patterns and the indicator finds a new one, the old patterns will be removed
- (important for algo traders because alerts for those removed patterns will no longer be a trigger)
🔸 Pattern size
⚬ Without filter will show all patterns (regardless of size)
⚬ Show only patterns for user preference size (no more two patterns because is smaller of 280 bars)
🔸 External Filter - It can be used to filter harmonic patterns. You can build your own custom trend based scripts and use it with AHP to filter trades.
⚬ The structure of the external script must be
1 for Long/Bullish patterns
-1 for Short/Bearish patterns
2 for all (Long and Short patterns)
0 Trade is not allowed
🔸 Filter Pattern Starts
⚬ When Filter starts is enabled pattern will start for logical pivot (see example)
⚬ Disabled filter will show more patterns (still can be very profitable)
💎 STOP & ENTRY & TRAILING STOP
🔸 Trail Entry Price - If Entry is still not reached and the price is still in PRZ zone, at the new high/low will adjust Entry.
⚬ Open Stats table will show the first Entry (when patterns were found) as well as the last corrected Entry (when patterns reached Entry level).
⚬ Disable this option Entry will remain at the level when patterns are found.
🔸 Enable Targets (awaiting entry) - enabled will show potential Targets for "awaiting entry" patterns (not active patterns because they have not yet reached Entry).
⚬ The Open stats table will show all other information, risk %, R:R etc).
⚬ Risky trade but with very good R:R (not recommended for inexperienced traders, very high risk of trading hitting Stop before reaching a Target)
🔸 Stop Distance - By default is set to 5. That is percent from the last low/high when the pattern reaches Entry. Stop trail from price till pattern reached Entry level.
🔸 Entry Distance - By default is set to 16. Same for SL that is percent distance from live price. You can increase/decrease percent but remember you have to give space between live price and the entry.
⚬ If entry is close to price, trade will become active too quickly
⚬ Remember if you change Stop Distance as well as Entry Distance to check Risk : Reward (recommended R:R for the first target is about 1:1)
🔸 Trailing Type - Options for trailing type, Continuous, Stepped, Breakeven and Disabled.
⚬ Continuous - When the price reaches "Trailing Active" (initial level for activating the trailing stop), T.Stop will start from Entry or Initial Stop (based on "Trailing Starts") and follow the price by Distance or Percent (based on "Trailing by").
- example one (trailing starts from Initial Stop when TP1 reached by distance/price on picture 1 and by percent on picture 2)
- example two (trailing starts from Entry when TP1 reached by distance/price on picture 1 and by percent on picture 2)
⚬ Stepped - when price reaches Trailing Active (initial level for activating the trailing stop), T.Stop will move to the previous level
- (If "Trailing Active" is set to Target2, then T.Stop will move to Target1 when price reached TP2)
⚬ Breakeven - when price reaches Trailing Active (initial level for activating the trailing stop), T.Stop will move to Entry and stay there the entire time for that harmonic trade
- (till reached all targets or reached T.Stop)
🔸 Trailing Active - When will the Trailing Stop be activated ("Trailing Type" must be enabled)
🔸 Trailing by - Distance or Percent
⚬ Distance - T.Stop will follow live price by initial distance
⚬ Percent - T.Stop will follow live price by initial percent
🔸 Trailing Starts - Entry or Initial Stop
⚬ Entry - T.Stop will start trailing from Entry level
⚬ I.Stop - T.Stop will start trailing from initial Stop level
- (Check Continuous picture for information)
💎 TARGET
🔸 Base - The level from which the calculation for Targets is made.
🔸 Target 1/Target 4 dropdown - Targets are set by default and set in the dropdown most often used for those targets.
🔸 Target 1/Target 4 custom - If the desired ratio is not in the dropdown, then it is possible to manually enter the desired ratio.
⚬ (If you want to change some of the targets, maybe to confluence with support/resistance)
💎 PATTERNS
🔸 Harmonic Patterns Type
⚬ Enable/Disable harmonic patterns by Type of patterns (for Classic and Anti patterns)
⚬ By default all patterns are enabled (for standard patterns). Users can control and select/deselect all Classic, Anti or Non Standard patterns but also disable individual patterns.
⚬ For some patterns (like Shark and Navarro 200) we change PRZ or place in different Type groups. That is just cosmetic things.
🔸 Classic - This includes all and most popular Harmonic Patterns.
⚬ Gartley (Type I)
⚬ Bat (Type I)
⚬ Butterfly (Type II)
⚬ Crab (Type II)
⚬ Deep Crab (Type II)
⚬ Cypher (Type II)
⚬ Shark (Type III)
⚬ Nenstar (Type IV)
🔸 Anti Patterns
⚬ Anti Nenstar (Type I)
⚬ Anti Shark (Type II)
⚬ Anti Cypher (Type II)
⚬ Anti Crab (Type II)
⚬ Anti Butterfly (Type III)
⚬ Anti Bat (Type IV)
⚬ Anti Gartley (Type IV)
⚬ Navarro 200 (Type IV)
🔸 Non Standard -
⚬ White Swan
⚬ Black Swan
⚬ 3 Drive
⚬ Anti 3 Drive
⚬ Wolfe
⚬ Snorm
⚬ 121 Pattern
⚬ 5-0 Pattern
⚬ Sea Pony
⚬ Leonardo
💎 PATTERN DISPLAY OPTION
🔸 Pattern Lines Size - thickness for harmonic patterns
🔸 Pattern Lines Type - type for harmonic pattern lines (solid, dotted, dashed)
🔸 Fill XAB/BCD - major harmonic triangle
🔸 Fill ABC/XBD - minor harmonic triangle
🔸 Enable XABCD Label - labels for harmonic pattern
🔸 XABCD Label Size - size for harmonic xabcd labels
🔸 Enable Ratio Label & Line - lines and labels that connect harmonic patterns levels and that show the patterns ratio
🔸 Ratio Label Size - ratio labels size
⚬ Lines for pattern ratio are set by default dashed and can’t be changed.
💎 PRZ & ENTRY | STOP | TARGET SETTINGS
🔸 Entry & Stop & Target Labels - by default is set to small (opt small & normal)
🔸 Entry & Stop & Target Lines - by default is set to show lines & labels & price (opt lines & labels & price or lines & labels or disable all)
🔸 PRZ Box size - size in bars for PRZ box
⚬ Added option when it is not readable on chart pattern names or entry/stop/targets offset
⚬ Maximum (last pattern) can be drawn up to 500 bars in future or you will get error for script (use this option only when you need)
🔸 PRZ Box Type of Spacing - distance between PRZ boxes. "Auto" will make the maximum distance when there are more than 3 patterns on the chart for better visibility
- (the maximum can be projected up to 500 bars in the future)
🔸 PRZ Box Manual Spacing - manual distance between PRZ boxes if is “PRZ Box Type of Spacing” set to manual
💎 STATS AND DISPLAY
⚬ These settings can be used to manage display of open and close statistic tables
🔸 Open Trades - By default is enabled and set to the top right position.
🔸 Closed Trades - By default is disabled and set to bottom left position.
⚬ The size of the table can be changed (by default it is set to small)
🔸 Enable Tool Tip for Table - can be enabled/disabled. Shows important information for each section related to Open or Closed tables.
⚬ Recommended enabled until everything related to tables is understood, and later disabled (it starts to get annoying when you accidentally cross the tables with the mouse and tooltip box pop up)
💎 OPEN STATS
🔸 Percentage - show percentage for Targets and Stops
🔸 Risk/Reward - show patterns risk to reward for each Targets
🔸 Size/Age - show patterns size (from X to D in bars) and patterns age (distance in bars when patterns “In Trade”)
🔸 Live % & R:R - enabled will show live % and R:R if you take trade in that moment
💎 CLOSED STATS
🔸 Percentage - show stats by percent instead of numbers
🔸 Display Mode - Closed trade table have three display option, Compact, Detailed and Selective
⚬ Compact - show stats for Long/Bullish and Short/Bearish patterns
⚬ Selective - show stats just for active patterns
⚬ Detailed - show stats for each enabled patterns
- All stats is for “Backtest Bars” if enabled.
- I removed some things from the previous indicator (R:R as well as trailing R:R and win rate) because I think they are not relevant in Closed Table for trade or for statistics (Open Table have that)
💎 PATTERN | CHART COLOR THEME
⚬ By default it is set to Light color theme. Color theme will affect pattern lines, XABCD labels, ratio lines and label, entry/sl/targets labels and text in the open statistics table.
🔸 Dark Theme / Light Theme - Users can change any default individual color for dark or light theme (transparency too).
⚬ Light/Dark Theme suits dark or light chart background or user can change all color to preferred trade style.
⚬ Users have extra control to change all color to preferred trade style.
💎 ALERTS
⚬ Alerts - These settings help users to choose the type of alerts they want to receive.
🔸 New - New Harmonic Pattern is identified
🔸 Entry - Harmonic Pattern reached Entry level
🔸 Target 1/Target4 - Alert when patterns reached on of Target levels
🔸 Closure - Harmonic Pattern trade is closed. Reached all Targets or Stop or Trailing Stop (if is enabled)
🔸 Long & Short placeholders - Enabled will change for alerts Bullish/Bearish text for Long/Short text
⚬ example of custom alerts with some placeholders
💎 BACKTEST WINDOW
🔸 Backtest bars - Enabled will scan patterns for that bar range (default is set to 5000)
🔷 TOOL TIP
⚬ In setting you have help from tooltip to give you almost all this information for easy understanding. Hover mouse above tool tip and windows with info will appear.
⚬ On the chart, tool tip is added for each individual Harmonic pattern to show extra information (pattern ratio, type of harmonic and where often that pattern appears in Elliott wave fractal)
⚬ Tooltip for tables will also provide all the information related to Open and Closed tables. Disabled tooltip for tables will hide all information, but the tooltip for patterns will still remain.
🔴 Possible Errors
⚬ If a mistake is made in the settings and, for example, TP2 is set to 0.618 ratio and TP3 is changed to 0.5 ratio
- (the larger target is set to a smaller ratio than the smaller target), a red text will appear over most charts to indicate the error.
⚬ If Trailing Type is enabled and "Trailing Active" and "Trailing Starts" are set to the same level (Entry), a red text will appear on the charts to indicate an error
- (change "Trailing Active" to a higher level, TP1, or lower "Trailing Starts " to "I.Start")