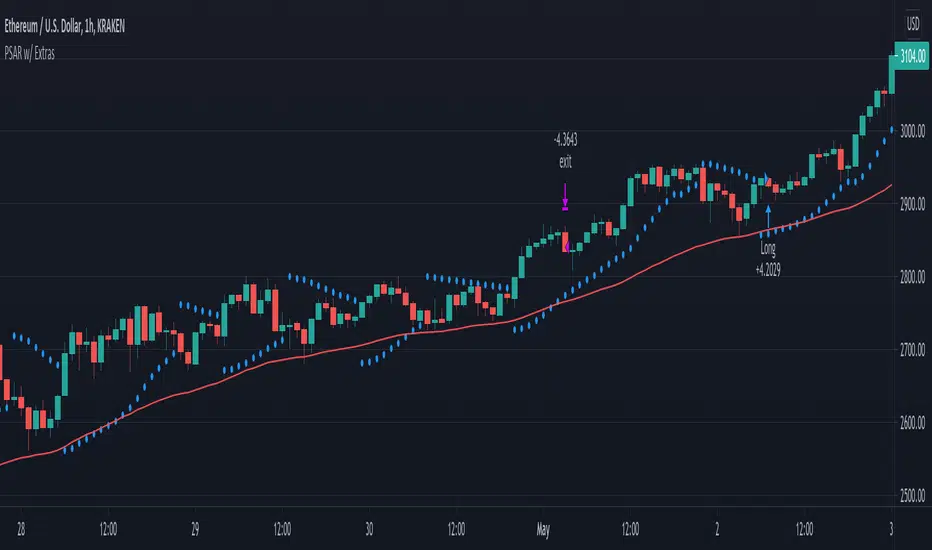
PSAR + EMA/TEMA/RSI/OBVThe Parabolic Stop-and-Reservse (PSAR) is a trend indicator, intended to capture reversal signals and show entry and exit points. The PSAR is bullish when the PSAR is below the candle body (usually indicated by a dot) and bearish when the PSAR is above the candle body. The PSAR generally only moves in the direction of the trend, making it useful for markets with an upward or downward trend, as well as swing markets. It is weaker when the market it sideways, as it can be prone to frequent flips (bull-to-bear or vice versa) in markets where a predominant trend is not present.
In order to combat the tendency for rapid swings in the PSAR, it is commonly paired with a second indicator. Often, this is a moving average (MA) to confirm the PSAR signal. Here is a common example:
PSAR + 2 EMAs: A trade would consider entering long when the PSAR is bullish and the fast EMA is above the short EMA.
PSAR + 3 EMAs: As above, but the trader could also add a very long EMA (200, for example) and use that as an additional filter.
In addition to using EMA, other MAs can be used and may be more appropriate to certain instruments and timeframes. Using TEMA, for example, may result in less lag but introduce more noise. Likewise, the Ehler's MAMA is an option.
Some traders use other indicators as PSAR confirmation signals, such as the relative strength index (RSI) on on-balance volume (OBV). The strategy is similar:
bullish PSAR + RSI oversold = consider long entry
bullish PSAR + OBV oscillator > 0 = consider long entry
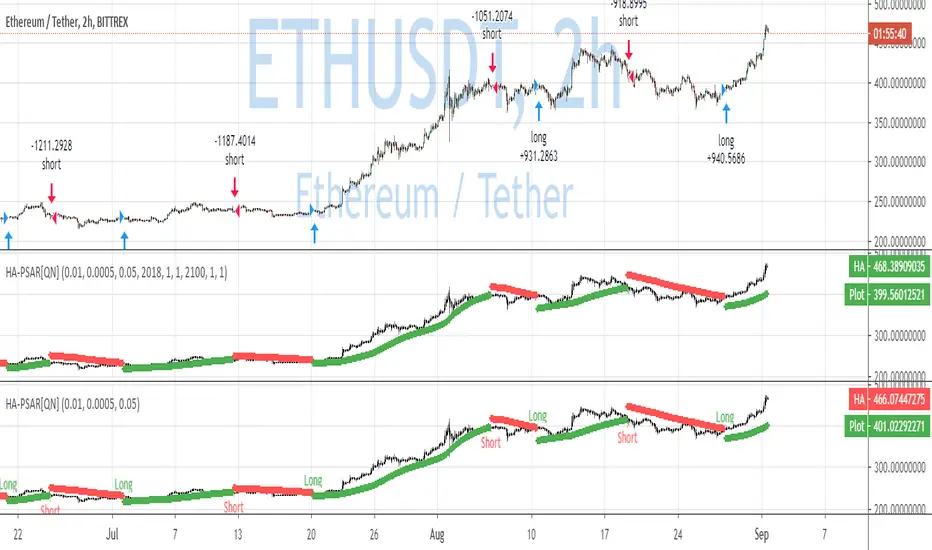
The strategy presented here is based on my PSAR + EMA + TEMA study. Any of the above strategies are supported by this script:
1. The PSAR is the primary signal.
2. Confirmation is provided by any of the following: EMA , TEMA , Ehler's MAMA , RSI , or OBV.
3. You may use a third EMA (set to 200 as the default) to filter entries -- if used, the strategy will only show signals if the price is above the third (additional) EMA .
For example, a normal long signal would be a bullish PSAR + fast EMA > slow EMA + price > ema 200.
In addition, you may use a SL, which is set to the PSAR dots shown. You may also limit the backtesting dates. (Please note in the chart above, I do not have a limit on the trading dates. I believe this exaggerates the success of the strategy, but the house rules demand I not limit the timeframe to show you a more accurate picture.)
在腳本中搜尋"psar"

PSAR with ATR Trailing Stop + SMA Filter📈 Strategy Overview: PSAR + 6×ATR Trailing Stop with SMA Filter
This strategy is built around the principle of “Cut the losers, let the winners run” — a disciplined, trend-following approach that combines the Parabolic SAR indicator with dynamic risk management and a Simple Moving Average (SMA) trend filter.
🔍 Strategy Logic
Trend Filter Trades are only taken in the direction of the prevailing trend, defined by a user-selected SMA (default: 100).
✅ Long trades only when price is above the SMA
✅ Short trades only when price is below the SMA
Entry Signal: A trade is triggered when the Parabolic SAR flips to the opposite side of the price bars, signaling a potential trend reversal.
Stop Loss: The stop loss is dynamically set at 6×ATR from the entry price. This adapts to market volatility and is recalculated every bar — effectively acting as a trailing stop.
Exit Logic: There is no fixed take profit. The trade remains open until the trailing stop is hit — allowing winners to run and losers to be cut quickly.
Risk Management: Each trade risks 0.5% of total equity, ensuring consistent position sizing and capital preservation.
📊 Visual Elements
PSAR dots mark trend direction changes
SMA line shows the broader trend filter
Trailing stop crosses (with 50% opacity) indicate the current stop level without cluttering the chart
⚙️ Customizable Inputs
PSAR parameters: Start, Increment, Maximum
ATR length and multiplier
SMA length
Risk percentage per trade
This strategy is ideal for traders who want to stay aligned with the trend, automate disciplined exits, and avoid emotional decision-making. Clean, simple, and powerful.
Wishing you calm and successful trades!

PSAR BBPT ZLSMA BTC 1minLong entry:
PSAR gives buy signal
BBPT prints green histogram
ZLSMA is below the price
ZLSMA has uptrend
SL is smaller than the max SL
Optional Sessions and EMA filters
Short entry
PSAR gives sell signal
BBPT prints red histogram
ZLSMA is above the price
ZLSMA has downtrend
SL is smaller than the max SL
Optional Sessions and EMA filters
SL:
Placed below ZLSMA + offset on long
Placed above ZLSMA + offset on short
TP1:
1x the SL by default
Takes no profit by default, 50% is also a good setting
TP2:
2x the SL by default
Take out all remaining position size.
If price reaches TP1, the SL is set to the entry price.

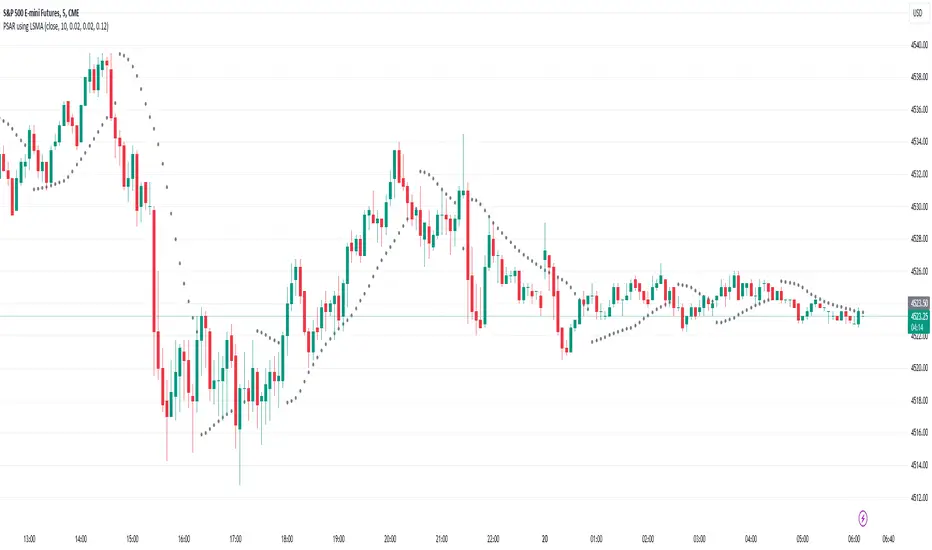
PSAR using Moving Linear Regression (LSMA)Works exactly as the standard PSAR with the only difference that a Moving Linear Regression Line (=Least Squares Moving Average, LSMA) is used as input.
So the PSAR flip is triggered not by price itself but by the LSMA line.
PSAR-Support ResistanceParabolic Support Resistance -PSAR SR is based on the Dynamic Reversal Points of Price. This indicator eliminates the false signals of regular Parabolic SAR (Stop and Reverse). The Price of previous SAR Reversal point is plotted as Support and Resistance. The idea is to trade only after the previous reversal point is crossed and a new candle formation above / below the support resistance lines.
Price moves sideways in between the S/R Lines mostly.
Buy and Sell Signals are based on normal P-SAR settings however this S/R must be considered. Please be aware that the indicator cannot be used as a stand alone. Please make required confirmations before going into action.
Disclaimer: Please use it at your own Risk.

Multi-Timeframe PSAR Indicator ver 1.0Enhance your trend analysis with the Multi-Timeframe Parabolic SAR (MTF PSAR) indicator! This powerful tool displays the Parabolic SAR (Stop and Reverse) from both the current chart's timeframe and a higher timeframe, all in one convenient view. Identify potential trend reversals and set dynamic trailing stops with greater confidence by understanding the broader market context.
Key Features:
Dual Timeframe Analysis: Simultaneously visualize the PSAR on your current chart and a user-defined higher timeframe (e.g., see the Daily PSAR while trading on the 1-hour chart). This helps you align your trades with the dominant trend.
Customizable PSAR Settings: Fine-tune the PSAR calculation with adjustable Start, Increment, and Maximum values. Optimize the indicator's sensitivity to match your trading style and the volatility of the asset.
Independent Timeframe Control: Choose to display either or both the current timeframe PSAR and the higher timeframe PSAR. Focus on the information most relevant to your analysis.
Clear Visual Representation: Distinct colors for the current and higher timeframe PSAR dots make it easy to differentiate between the two. Quickly identify potential entry and exit points.
Configurable Colors You can easily change colors of Current and HTF PSAR.
Standard PSAR Logic: Uses the classic Parabolic SAR algorithm, providing a reliable and widely-understood trend-following indicator.
lookahead=barmerge.lookahead_off used in the security function, there is no data leak or repainting.
Benefits:
Improved Trend Identification: Spot potential trend changes earlier by observing divergences between the current and higher timeframe PSAR.
Enhanced Risk Management: Use the PSAR as a dynamic trailing stop-loss to protect profits and limit potential losses.
Greater Trading Confidence: Make more informed decisions by considering the broader market trend.
Reduced Chart Clutter: Avoid the need to switch between multiple charts to analyze different timeframes.
Versatile Application: Suitable for various trading styles (swing trading, day trading, trend following) and markets (stocks, forex, crypto, etc.).
How to Use:
Add to Chart: Add the "Multi-Timeframe PSAR" indicator to your TradingView chart.
Configure Settings:
PSAR Settings: Adjust the Start, Increment, and Maximum values to control the PSAR's sensitivity.
Multi-Timeframe Settings: Select the desired "Higher Timeframe PSAR" resolution (e.g., "D" for Daily). Enable or disable the display of the current and/or higher timeframe PSAR using the checkboxes.
Interpret Signals:
Current Timeframe PSAR: Dots below the price suggest an uptrend; dots above the price suggest a downtrend.
Higher Timeframe PSAR: Provides context for the overall trend. Agreement between the current and higher timeframe PSAR strengthens the trend signal. Divergences may indicate potential reversals.
Trade Management:
Use PSAR dots as dynamic trailing stop.
Example Use Cases:
Confirming Trend Strength: A trader on a 1-hour chart sees the 1-hour PSAR flip bullish (dots below the price). They check the MTF PSAR and see that the Daily PSAR is also bullish, confirming the strength of the uptrend.
Identifying Potential Reversals: A trader sees the current timeframe PSAR flip bearish, but the higher timeframe PSAR remains bullish. This divergence could signal a potential pullback within a larger uptrend, or a warning of a more significant reversal.
Trailing Stops: A trader enters a long position and uses the current timeframe PSAR as a trailing stop, moving their stop-loss up as the PSAR dots rise.
Disclaimer: The Parabolic SAR is a lagging indicator and may produce false signals, especially in ranging markets. It is recommended to use this indicator in conjunction with other technical analysis tools and risk management strategies. Past performance is not indicative of future results.

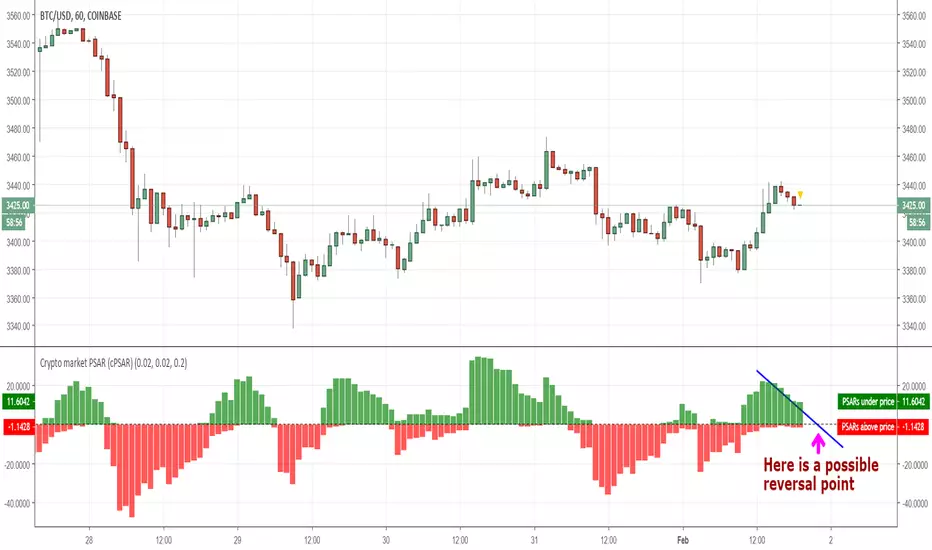
Crypto market PSAR (cPSAR)This indicator calculates the PSARs of the most liquid cryptocurrencies (as percent differences from the prices) and sums them together.
The PSARs under the closes, which act as support, are summed separately and shown in green. The PSARs over the closes (acting as resistance) are summed separately and shown in red.
The result is an indicator which can be interpreted somewhat like the RSI (but keep in mind that PSAR is a lagging indicator unlike the RSI which is a leading indicator). By interpreting this correctly you can - SOMETIMES - predict the short-term turns of the entire crypto market.
Many traders use the prices shown by PSAR (Parabolic Stop And Reverse) to set stop loss prices and/or to take profit and reverse their positions. This is why, on reversal of the PSARs (= when one of the red or green values becomes visibly larger than the other), a strong turning of the market can, sometimes, occur.
RSI Trend Detector PSAR BasedRSI Trend Detector is based on the Direction of PSAR. This indicator helps the easy detection of Trend Direction and Sideways Movement of Price. It was difficult to determine the RSI Trend Direction in a basic RSI indicator. one cannot decide the exact entry point where to enter.
RSI Trend Detector helps with the direction of trend using PSAR direction which is almost instant direction changing indicator with Zero Lag. The color of the RSI changes immediately based on PSAR direction. One can determine the trend whether its in UP / Down or Sideways.
One can easily detect Pullback and entry points using this indicator.
The basic working can be interpreted with a normal default RSI, The only additional feature is the direction of trend using a SAR signal.
Oversold Zone is below 30
Overbought Zone is above 70
how ever RSI above 50 is treated a UP trend and Below 50 as Down Trend.
when RSI is between 40 and 60 price must be considered as Sideways. One can easily interpret the TREND.
Yellow Line = RSI Moving Average
RED and Green Line= RSI
Grey Zone = Sideways
Horizontal line = RSI level 50
Settings can be changed as required.
RSI Line:
RSI Above 50 up trend and Entry when color is green
RSI Below 50 down trend and Entry when color is Red
RSI in Grey Zone is sideways, wait for a breakout
RSI above 50 and color is red then its a pullback in uptrend
RSI below 50 and color is green then its a pullback in downtrend
ALERTS:
Up signal and Down Signal are provided when ever RSI crosses RSIMA
Up Signal: RSI crosses RSI Moving Average upwards
Down Signal: RSI crosses RSI Moving Average Downwards
Hope the Tradingview community likes this.

Papercuts Dual PSAR v01Dual PSAR is a trend following script that uses auto-higher timeframe calculation of the current timeframe to create a dual Parabolic Stop And Release.
This is useful because it can determine periods of transition or indecision and can flag those periods with which way it is learning even though it is undecided, what i call "Wait Zones".
When both PSARS are not in alignment, it uses the lower timeframe one to determine which way the wait zone is learning.
You can see below in the chart shows some good trends and some wait zones.
A wait zone can have bullish indication, but then still have a bearish continuation.
A wait zone can have bullish indication, and then enter a bull trend.
Typically I won't make trades in wait zones, and I will exit trades when entering one.
Just wanted to try this out and see how it did. Figured I'd share.

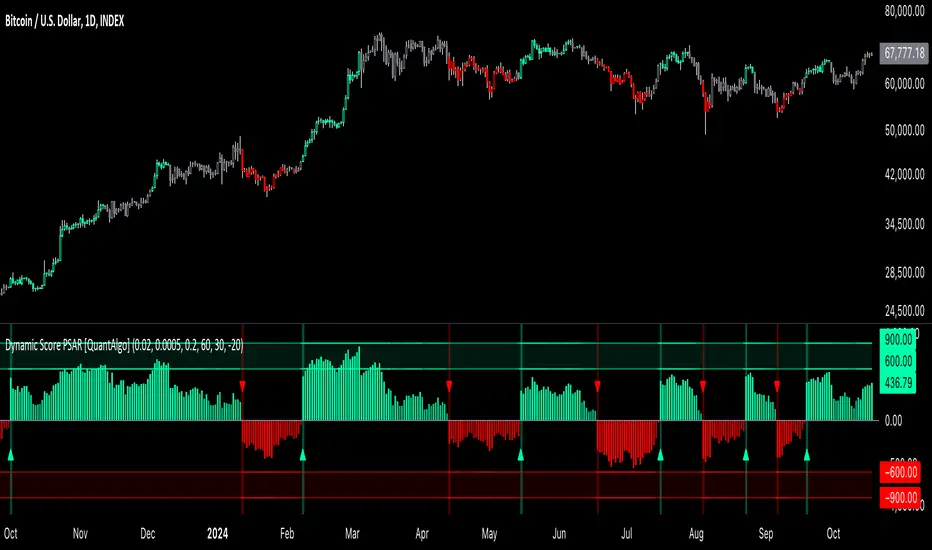
Dynamic Score PSAR [QuantAlgo]Dynamic Score PSAR 📈🧬
The Dynamic Score PSAR by QuantAlgo introduces an innovative approach to trend detection by utilizing a dynamic trend scoring technique in combination with the Parabolic SAR. This method goes beyond traditional trend-following indicators by evaluating market momentum through a scoring system that analyzes price behavior over a customizable window. By dynamically adjusting to evolving market conditions, this indicator provides clearer, more adaptive trend signals that help traders and investors anticipate market reversals and capitalize on momentum shifts with greater precision.
💫 Conceptual Foundation and Innovation
At the core of the Dynamic Score PSAR is the dynamic trend score system, which assesses price movements by comparing normalized PSAR values across a range of historical data points. This dynamic trend scoring technique offers a unique, probabilistic approach to trend analysis by evaluating how the current market compares to past price movements. Unlike traditional PSAR indicators that rely on static parameters, this scoring mechanism allows the indicator to adjust in real time to market fluctuations, offering traders and investors a more responsive and insightful view of trends. This innovation makes the Dynamic Score PSAR particularly effective in detecting shifts in momentum and potential reversals, even in volatile or complex market environments.
✨ Technical Composition and Calculation
The Dynamic Score PSAR is composed of several advanced components designed to provide a higher probability of detecting accurate trend shifts. The key innovation lies in the dynamic trend scoring technique, which iterates over historical PSAR values and evaluates price momentum through a dynamic scoring system. By comparing the current normalized PSAR value with previous data points over a user-defined window, the system generates a score that reflects the strength and direction of the trend. This allows for a more refined and responsive detection of trends compared to static, traditional indicators.
To enhance clarity, the PSAR values are normalized against an Exponential Moving Average (EMA), providing a standardized framework for comparison. This normalization ensures that the indicator adapts dynamically to market conditions, making it more effective in volatile markets. The smoothing process reduces noise, helping traders and investors focus on significant trend signals.
Additionally, users can adjust the length of the data window and the sensitivity thresholds for detecting uptrends and downtrends, providing flexibility for different trading and investing environments.
📈 Features and Practical Applications
Customizable Window Length: Adjust the window length to control the indicator’s sensitivity to recent price movements. This provides flexibility for short-term or long-term trend analysis.
Uptrend/Downtrend Thresholds: Set customizable thresholds for identifying uptrends and downtrends. These thresholds define when trend signals are triggered, offering adaptability to different market conditions.
Bar Coloring and Gradient Visualization: Visual cues, including color-coded bars and gradient fills, make it easier to interpret market trends and identify key moments for potential trend reversals.
Momentum Confirmation: The dynamic trend scoring system evaluates price action over time, providing a probabilistic measure of market momentum to confirm the strength and direction of a trend.
⚡️ How to Use
✅ Add the Indicator: Add the Dynamic Score PSAR to your favourites, then to your chart and adjust the PSAR settings, window length, and trend thresholds to match your preferences. Customize the sensitivity to price movements by tweaking the window length and thresholds for different market conditions.
👀 Monitor Trend Shifts: Watch for trend changes as the normalized PSAR values cross key thresholds, and use the dynamic score to confirm the strength and direction of trends. Bar coloring and background fills visually highlight key moments for trend shifts, making it easier to spot reversals.
🔔 Set Alerts: Configure alerts for significant trend crossovers and reversals, ensuring you can act on market movements promptly, even when you’re not actively monitoring the charts.
🌟 Summary and Usage Tips
The Dynamic Score PSAR by QuantAlgo is a powerful tool that combines traditional trend-following techniques with the flexibility of a dynamic trend scoring system. This innovative approach provides clearer, more adaptive trend signals, reducing the risk of false entries and exits while helping traders and investors capture significant market moves. The ability to adjust the indicator’s sensitivity and thresholds makes it versatile across different trading and investing environments, whether you’re focused on short-term pivots or long-term trend reversals. To maximize its effectiveness, fine-tune the sensitivity settings based on current market conditions and use the visual cues to confirm trend shifts.
CHOP Zone Entry Strategy + DMI/PSAR ExitThis is a Strategy with associated visual indicators and Long/Short and Reverse/Close Position Alerts for the Choppiness Index (CHOP) . It is used to determine if the market is choppy (trading sideways) or not choppy (trading within a trend in either direction). CHOP is not directional, so a DMI script was ported into this strategy to allow for trend confirmation and direction determination; it consists of an Average Directional Index (ADX) , Plus Directional Indicator (+DI) and Minus Directional Indicator (-DI) . In addition, a Parabolic SAR is also included to act as a trailing stop during any strong trends.
Development Notes
---------------------------
This indicator, and most of the descriptions below, were derived largely from the TradingView reference manual. Feedback and suggestions for improvement are more than welcome, as well are recommended Input settings and best practices for use.
www.tradingview.com
www.tradingview.com
www.tradingview.com
Recommend using the below DMI and PSAR indicators in conjunction with this script to fully visualize and understand how entry and exit conditions are chosen. Variable inputs should correlate between the scripts for uniformity and visual compatibility.
THANKS to LazyBear and his Momentum Squeeze script for helping me quickly develop a momentum state model for coloring the Chop line by trend.
Strategy Description
---------------------------
CHOP produces values that determine whether the market is choppy or trending . The closer the value is to 100 , the higher the choppiness levels , while the closer it is to 0 , the stronger the market is trending . Territories for both levels, and their associated upper and lower thresholds, are popularly defined using the Fibonacci Retracements, 61.8 and 38.2.
Basic Use
---------------------------
CHOP is often used to confirm the market condition to help you stay out of sideways markets and only enter when there is movement or imminent explosions. When readings are above the upper threshold, continued sideways movement may be expected, while readings below the lower threshold are typically indicative of a continuing trend. It is also used to anticipate upcoming trendiness changes, with the general belief that extended periods of consolidation (sideways movement) are followed by extended periods of strong, trending, directional movement, and vice versa.
One limitation in this index is that you must be cautious in deciding whether the range or trend will likely continue, or if it will reverse.
Confidence in price action and trend is higher when two or more indicators are in agreement -- while this strategy combines CHOP with both DMI and PSAR, we would still recommend pairing with other indicators to determine entry or exit trade opportunities.
Recommend also choosing 'Once Per Bar Close' when creating alerts.
Inputs
---------------------------
Strategy Direction - an option to only trade Short, Long, Both, or only in the direction of the Trend (Follow Trend is the Default).
Sensitivity - an incremental variable to test whether the past n candles are in the same trend state before triggering a delayed long or short alert (1 is the Default). Can help filter out noise and reduces active alerts.
Show Chop Index - two visual styles are provided for user preference, a visible Chop line with a background overlay, or a compact column and label only view.
Chop Lookback Period - the time period to be used in calculating CHOP (14 is the Default).
Chop Offset - changing this number will move the CHOP either forwards or backwards relative to the current market (0 is the Default).
Smooth Chop Line and Length - if enabled, the entered time period will be used in calculating a smooth average of the index (Enabled and 4 are the Defaults).
Color Line to Trend Direction - toggles whether the index line is colored to visually depict the current trend direction (Enabled is the Default).
Color Background - toggles the visibility of a background color based on the index state (Enabled is the Default).
Enable DMI Option - if enabled, then entry will be confirmed by and dependent on the ADX Key Level, with any close or reversal confirmed by both ADX and +/-DI to determine whether there is a strong trend present or not (Enabled is the Default).
ADX Smoothing - the time period to be used in calculating the ADX which has a smoothing component (14 is the Default).
DI Length - the time period to be used in calculating the DI (14 is the Default).
ADX Key Level - any trade with the ADX above the key level is a strong indicator that it is trending (23 to 25 is the suggested setting).
Enable PSAR Option - enables trailing stop loss orders (Enabled is the Default).
PSAR Start - the starting value for the Acceleration Force (0.015 is our chosen Default, 0.02 is more common).
PSAR Increment - the increment in which the Acceleration Force will move (0.001 is our chosen Default, 0.02 is more common).
PSAR Max Value - the maximum value of the Acceleration Factor (0.2 is the Default).
Color Candles Option - an option to transpose the CHOP condition levels to the main candle bars. Note that the outer red and green border will still be distinguished by whether each individual candle is bearish or bullish during the specified timeframe.
Note too that if both DMI and PSAR are deselected, then close determinations will default to a CHOP reversal strategy (e.g., close long when below 38.2 and close short when above 61.8). Though if either DMI or PSAR are enabled, then the CHOP reversal for close determination will automatically be disabled.
Indicator Visuals
---------------------------
For the candle colors, black indicates tight chop (45 to 55), yellow is loose chop (38.2 to 45 and 55 to 61.8), dark purple is trending down (< 38.2), and dark blue is trending up (> 61.8).
The background color has additional shades to differentiate a wider range of more levels…
• < 30 is dark purple
• 30 to 38.2 is purple
• 38.2 to 45 is light purple
• 45 to 55 is black
• 55 to 61.8 is light blue
• 61.8 to 70 is blue
• > 70 is dark blue
Long, Short, Close, and Reverse labels are plotted on the Chop line, which itself can be colored based on the trend. The chop line can also be hidden for a clean and compact, columnar view, which is my preferred option (see example image below).
Visual cues are intended to improve analysis and decrease interpretation time during trading, as well as to aid in understanding the purpose of this strategy and how its inclusion can benefit a comprehensive trading plan.
DMI and Trend Strength
---------------------------
To analyze trend strength, the focus should be on the ADX line and not the +DI or -DI lines. An ADX reading above 25 indicates a strong trend , while a reading below 20 indicates a weak or non-existent trend . A reading between those two values would be considered indeterminable. Though what is truly a strong trend or a weak trend depends on the financial instrument being examined; historical analysis can assist in determining appropriate values.
DMI exits trade when ADX is below the user selected key level (e.g., default is 25) and when the +/- DI lines cross (e.g., -DI > +DI exits long position and +DI > -DI exits short position).
PSAR and Trailing Stop
---------------------------
PSAR is a time and price based indicator that excels at measuring direction and duration, though not the actual strength of a trend, which is why we use this in conjunction with DMI. It is also included in this script as a trailing stop option to maximize gains during strong trends and to mitigate any false ADX strengthening signals.
This creates a parabola that is located below the candle during a Bullish trend and above during a Bearish trend. A buy or reversal is signaled when the price crosses above or below the Parabolic SAR.
Long/Short Entry
---------------------------
1. CHOP must be over 61.8 (long) or under 38.2 (short).
2. If DMI is enabled, then the ADX signal line must be above the user selected Key Level (default is 25).
3. If Sensitivity is selected, then that past candle must meet the criteria in step 1, as well as all the intermediate candles in between.
4. If "Follow Trend" is selected and PSAR is enabled, then a long position can only open when the momentum and PSAR are in an uptrend, or short when both are in a downtrend, to include all intermediate candles if the Sensitivity option is set on a past candle.
Close/Reverse
---------------------------
1. If DMI is enabled, then a close flag will be raised when the ADX signal drops below the Key Level (of 25), and -DI crosses over +DI (if long), or +DI crosses over -DI (if short).
2. If PSAR is enabled, then a close flag will be raised when the current trend state is opposite the last state.
3. If both DMI and PSAR are disabled, then a close flag will be raised if the Chop line drops under 38.2 (if long) or goes over 61.8 (if short).
4. If a Long or Short Entry is triggered on the same candle as any of the above close flags, then the position will be reversed, else the position will be closed.
Strategy Alerts
---------------------------
1. Long Entry
2. Short Entry
3. Reverse
4. Close
The provided backtest result is based on a position sizing of 10% equity with 100k initial capital. When testing SPX, disabling the DMI performed the best, but EURUSD performed poorly without it enabled, and TSLA had a small reduction in net profit. Timeframe likewise differed between commodities with TSLA performing best at 30M, SPX at 15M, and EURUSD at 4H. I do not plan on using this as a standalone strategy, but I also was expecting better results with the inclusion of EMI and PSAR to compliment the CHOP. Key elements of this script will likely be included in future, more holistic strategies.
Disclaimer
---------------------------
Past performance may not be indicative of future results. Due to various factors, including changing market conditions, the strategy may no longer perform as well as in historical backtesting. This post and the script are not intended to provide any financial advice. Trade at your own risk.
No known repainting, though there may be if an offset is introduced in the Inputs. I did my best not to code any other variables that repaint, but cannot fully attest to this fact.

Full strategy Psar+ adx + cmf + rsi This ia full strategy made with a combination of a trender, volume, volatility and oscillator.
In this case we only go long.
Indicators used:
Default PSAR
Default CMF
Modified RSI logic, not using OB/OS
ADX with EMA applied
The rules are : we check if we are in a uptrend on psar, together with a positive value in volume, rsi is above the middle line(50), using a big length, and lastly the ADx is superior to the ema ADx
For exit, we check the opposite, like downtrend psar, negative value volume, rsi < 50, and adx < ema adx
If you have any questions let me know.

QuantNomad - Heikin-Ashi PSAR AlertsUsing this script you can create alerts for my Heikin-Ashi PSAR Strategy:
When creating alerts use "Once Per Bar Close" in parameters.
####################
Disclaimer
Please remember that past performance may not be indicative of future results.
Due to various factors, including changing market conditions, the strategy may no longer perform as good as in historical backtesting.
This post and the script don’t provide any financial advice.
Strategy Myth-Busting #6 - PSAR+MA+SQZMOM+HVI - [MYN]This is part of a new series we are calling "Strategy Myth-Busting" where we take open public manual trading strategies and automate them. The goal is to not only validate the authenticity of the claims but to provide an automated version for traders who wish to trade autonomously.
Our sixth one we are automating is " I Tested ''7% Profit Per Day" Scalping Strategy 100 Times ( Unexpected Results ) " from " TradeIQ " which claims to have made 175% profit on the 5 min chart of BTCUSD with a having a 61% win rate in just 32 days.
Originally, we mimicked verbatim the indicators and settings TradeIQ was using however weren't getting promising results anything close to the claim so we decided to try and improve on it. We changed the static Parabolic SAR to be adaptive based upon the timeframe. We did this by using an adjustable multiplier for the PSAR Max. Also, In TradeIQ's revised version he substituted Hawkeye's Volume Indicator in lieu of Squeeze Momentum. We found that including both indicators we were getting better results so included them both. Feel free to experiment more. Would love to see how this could be improved on.
This strategy uses a combination of 4 open-source public indicators:
Parabolic Sar (built in)
10 in 1 MA's by hiimannshu
Squeeze Momentum by lazybear
HawkEYE Volume Indicator by lazybear
Trading Rules
5m timeframe and above. We saw equally good results in the higher (3h - 4h) timeframes as well.
Long Entry:
Parabolic Sar shifts below price at last dot above and then previous bar needs to breach above that.
Price action has to be below both MA's and 50MA needs to be above 200MA
Squeeze Momentum needsd to be in green or close to going green
HawkEYE Volume Indicator needs to be show a green bar on the histagram
Short Entry:
Parabolic Sar shifts above price at last dot below and then previous bar needs to breach below that.
Price action needs to be above both MA's and 50MA needs to be below 200MA
Squeeze Momentum needsd to be in red or close to going red
HawkEYE Volume Indicator needs to be show a red bar on the histagram
If you know of or have a strategy you want to see myth-busted or just have an idea for one, please feel free to message me.

Adaptive Parabolic SAR (PSAR) [Loxx]Adaptive Parabolic SAR (PSAR) is an advanced Parabolic SAR with adaptive adjustments using either a Kaufman or an Ehlers smoothing algorithms.
What is the Parabolic SAR?
The parabolic SAR attempts to give traders an edge by highlighting the direction an asset is moving, as well as providing entry and exit points. In this article, we'll look at the basics of this indicator and show you how you can incorporate it into your trading strategy. We'll also look at some of the drawbacks of the indicator.
The parabolic SAR is a technical indicator used to determine the price direction of an asset, as well as draw attention to when the price direction is changing. Sometimes known as the "stop and reversal system," the parabolic SAR was developed by J. Welles Wilder Jr., creator of the relative strength index (RSI).1
On a chart, the indicator appears as a series of dots placed either above or below the price bars. A dot below the price is deemed to be a bullish signal. Conversely, a dot above the price is used to illustrate that the bears are in control and that the momentum is likely to remain downward. When the dots flip, it indicates that a potential change in price direction is under way. For example, if the dots are above the price, when they flip below the price, it could signal a further rise in price.
Additional Options
Toggle signals on/off
HiLo mode
Kaufman adaptive, Ehlers adaptive, or non adaptive
Filter by Pips
Minimum Change by Pips
Color bars
Enjoy!
QuantNomad - Heikin-Ashi PSAR StrategyContinue experimenting with different combinations of strategies.
Here is the PSAR Strategy calculated based on HA candles. HA is already calculated inside the script, do not apply it to HA candles.
Strategy is calculated based on 25% equity invested with 0.1% commission.
####################
Disclaimer
Please remember that past performance may not be indicative of future results.
Due to various factors, including changing market conditions, the strategy may no longer perform as good as in historical backtesting.
This post and the script don’t provide any financial advice.

PSAR different v1This is another way to show PSAR , the histogram show the PSAR signals if they are above or bellow 0 =identical to regular PSAR
we can see the power of rising up or falling down by the color of the PSAR on the histogram
since we have point above and bellow 0 we can make fast and slow length and get signals above or bellow the zero . so we can detect buy and sell force much early then the regular PSAR

PSAR differentIts the same as the regular PSAR that we all known just calculated in a different way
so it more easy to see the start and the strength of the PSAR
I did not ad alert as there is no different between this one and regular PSAR

PSAR+EMA+Hull+BBDescription
This all-in-one indicator combines four proven tools:
Parabolic SAR (Everget) — trend direction and potential reversals.
Exponential Moving Averages (20/50/100/200) — customizable lengths, colors, and offsets.
Hull Suite (InSilico) — smooth trend detection with multiple variations (HMA, THMA, EHMA).
Bollinger Bands — volatility and dynamic support/resistance.
Features
Toggle each module on/off in settings.
Fully configurable inputs (lengths, colors, offsets, multipliers).
Optional PSAR labels, highlights, and state fill.
Hull can color candles, draw band fills, and pull from higher timeframes.
Bollinger Bands include multiple basis types, stdev multipliers, and fill transparency.
Built-in alerts: PSAR direction change, Hull trending up/down.
Category
Trend Analysis (with Volatility as secondary).

Validated PSARPSAR works well as trailing stop loss (or WinStop), but is often whipsaw'd as it detect trend changes over enthusiastically.
So, a filter to validate trend changes was added. It basically requires 3 straight bars completely breaking the prior saved PSAR level.
Enjoy!

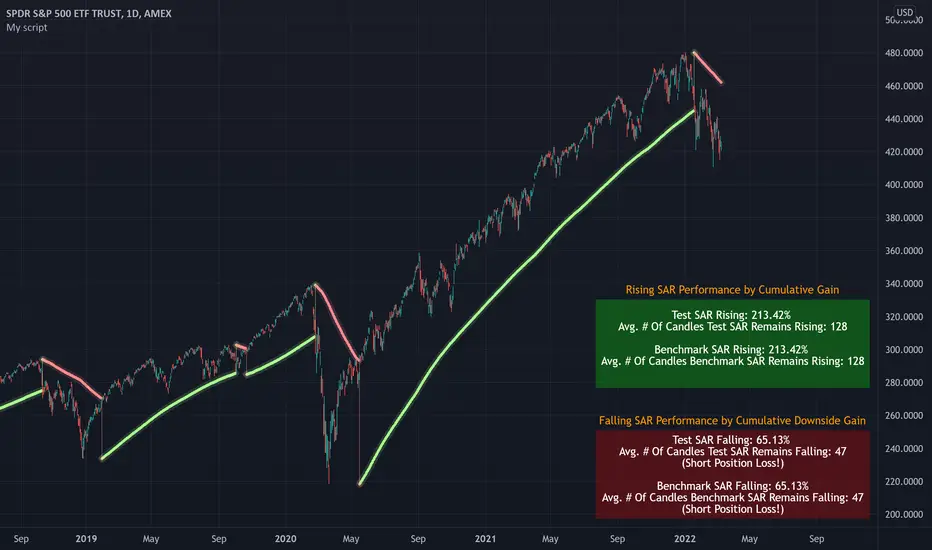
PSAR Optimization ScriptHello!
User @henryph24 suggested I make this script!
This script calculates the cumulative and average gain/Loss of rising SAR following a price crossover of SAR.
The cumulative and average gain/Loss of falling SAR following a price crossunder is also measured.
Changes to the parameters of SAR will return the requisite calculations for evaluating performance.
Benchmark SAR can be used to compare performance against test SAR.
When changing the SAR parameters the script will recalculate and display the rising SAR and falling SAR performance of the modified parameters. The script works for any asset on any timeframe.
Essentially, this script allows you to optimize SAR parameters, and quickly ascertain what can/cannot work for an asset.
The script automatically plots the best performing SAR between a benchmark SAR (SAR #1) and a test SAR (SAR #2). Both benchmark SAR and test SAR works the same. The two are used to compare performance between different SAR parameters. If you would like the script not to plot the best performing SAR you can select "On" for the "Override SAR" input box. Doing so will plot the SAR parameters of your choice while still allowing you to compare the performance of benchmark SAR and test SAR.
There are tooltips available in the user input tab that explain the SAR parameters, in addition to what your modifications of the parameters will do, should you be unfamiliar with the indicator!
Enjoy!
PSAR + EMA + TEMACombined PSAR with EMA and/or TEMA lines, including fast/slow plots, for entry/exit signals. Includes signals for all plots.
Credit to TEMA With Alert by BerkSay and Parabolic SAR by Alex Orekhov (everget).