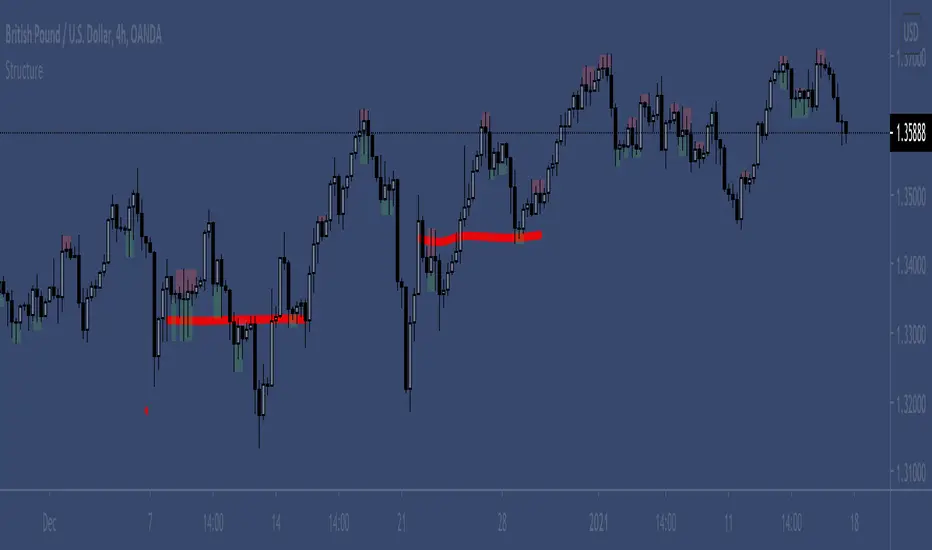
Same high/lowIf you are using support/resistance level-based strategies in your trading then this indicator can help you. I think that the retest level strategy is the best for beginners due to its simplicity of risk/reward calculations and higher abundance on the market. There is a well-known method to recognize a big player (buyer/seller) by candlestick pattern where the last two candles have the same low or same high. Moreover, abnormal candles increase the probability of a retest of a strong level, so my indicator highlights these two situations. In my opinion, a higher timeframe of a candle chart increases the win rate for this indicator (>1h).
So there are several patterns which my indicator can recognize:
1. Same low/high: blue flag up - same low, blue flag down - same high.
2. Mirror levels: high-low - green flag up, low-high - green flag down.
3. abnormal candles: yellow body if >2*ATR (please tune atr in properties, the default value is 5).
4. The red flag indicates the third candle with the same high/low in a row.
Thanks for your attention and have a good trading time!
在腳本中搜尋"retest"

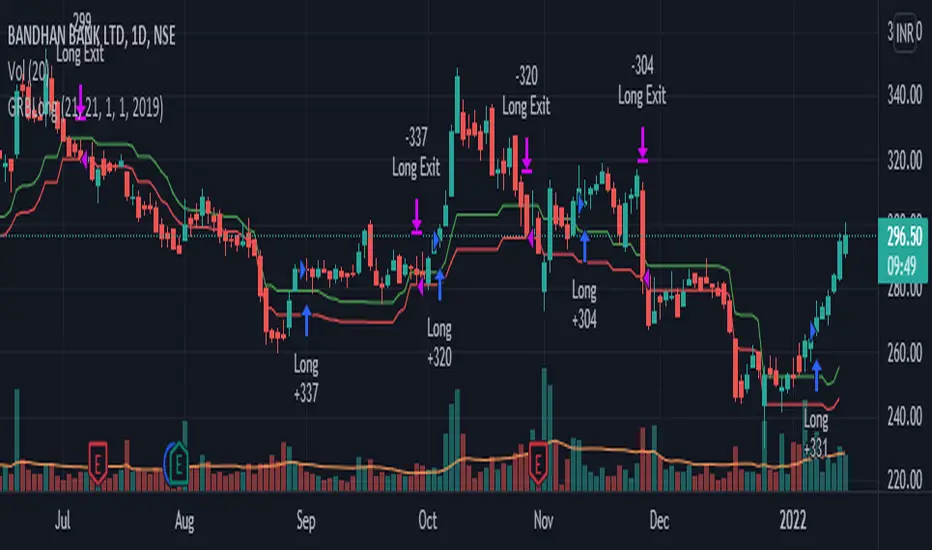
GRB LongThis strategy generates swing trading signals based on the Golden Ratio Breakout. This is a long-only strategy, entry is breakout and retest of 38.2 fib level and SL is 23.6 fib level from last 21 days. These are only suggestions and NOT recommendations. Please do your own due diligence before taking ANY action. No responsibility for any profits/LOSSES.
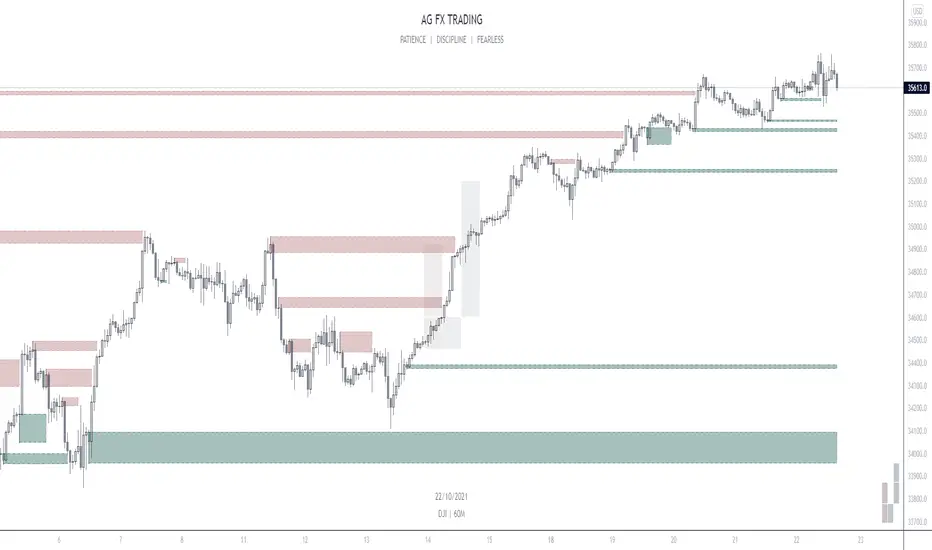
AG FX - INSTITUTIONAL ORDER BLOCKSThis Indicator will help you to find some potential bullish and bearish block.
This indicator, only provides just the the potentials ORDER BLOCKS followed by imbalances.
Forms of using this indicator:
- Plotting the ORDER BLOCKS CANDLES with the color that you prefer
- Plotting the zones given with the ORDER BLOCKS
- Both of them
Indicator Parameters:
- Customizable Candles colors
- Customizable Boxes colors
- Customizable amount of boxes displayed
PD: I just prefer the first one so i can get a clean chart, but it´s up to you.
Inner Circle Trader Institutional ORDER BLOCKS FOREX Theory
Today we are talking about the infamous ORDER BLOCKS by ICT forex trading Strategy. Order Blocks have proven to be a very effective tool in trading as they allow traders to gain high reward with low risk trades.
What is an Order Block? - The Order Block is a specific price range or candle where institutions will be buying or selling against the retail trend/dump money.
Institutions leave order blocks for themselves to trade at a later stage. They will reverse the price to a previous order and then driving the price hard in the direction of the trend (The real institutional trend).
These order blocks we can also call them specific levels of either going Long or Short. If an order block is violated or broken, it now qualifies as a Breaker, meaning Price will retest back to that order block. Sometimes we call it a failed order block.
Types of OBs:
i. Bullish Order Block (BUB)
ii. Bearish Order Block (BEB)
Market Profile with Past SessionsThis script plots market profiles that show the amount of time price has remained at a particular level during past sessions, often referred to as "time price opportunity".
TV user @LonesomeTheBlue created the original Market Profile indicator on which this script is based. This version makes minor changes to the automatic timeframes, and to show historic market profiles and points of control.
The market profile drawing begins at the START of the relevant session being profiled and extends to the right. There is a checkbox in the options that will plot the market profile at the END of the relevant session, if desired.
If you want to view the market profiles for shorter or longer sessions, use the drop down menu to take the Higher Time Frame setting off "Auto", and instead select a specific time interval that is HIGHER than the timeframe your chart is showing.
The market profile and points of control can be used to identify areas likely to serve as potential support or resistance, as well areas where price is likely to retest when it is ranging.

Low Timeframe POCI have recently made a High Timeframe POC script (HFT POC) which is pretty popular. Thanks for this!
There are many requests to include lower timeframes in this script, that is why I created this script. I could have incorporated all the timeframe POC's into one indicator but I went this route to keep things more organized between all the different timeframes.
Currently included: Daily, 6H, 3H and 1H
/* DEFINITION */
Point Of Control (= POC) is a price level at which the heaviest volumes were traded.
/* HOW TO TRADE WITH THIS INDICATOR */
The basis for POC is determining bias on whichever timeframe you choose.
1. Identify a POC on the timeframe of your choosing.
/* If you choose the lowest timeframe (1H here) then always make sure to look at the higher timeframes to see how it is trading against a HTF POC.
2. When the price is moving away from the POC (either to the upside or downside) this can confirm or invalidate a trade.
3. You can now enter the trade on bias or wait for a retest of the same POC.
/* EXAMPLE TRADES /*
Here is a screenshot of some of the trades that are possible using these Low Timeframe POC's and some common sense.
s3.tradingview.com

High Timeframe POCBecause the big Bitcoin crash I have been looking a lot at high timeframe metrics. I never spent much time learning POC so I decided to create a little script for determining these on higher timeframes.
Currently included: Monthly, 3 months and 6 months.
/* DEFINITION */
Point Of Control (= POC) is a price level at which the heaviest volumes were traded.
Value Area High/Low (=VAH/VAL) is a range of prices where the majority of trading volume took place. Naturally, Value Area High being the top price level and Value Area Low being the lowest. POC always is between the two.
/* HOW TO TRADE WITH THIS INDICATOR */
The basis for POC is determining bias on whichever timeframe you choose.
1. Identify a POC on the timeframe of your choosing.
/* If you choose a "low" timeframe (monthly here) then make sure to look at the higher timeframes to see how it is playing against a higher timeframe POC.
2. When the price is moving away from the POC (either to the upside or downside) this will confirm or invalidate the trade.
3. You can now enter the trade on bias or wait for a retest of the same POC.
/* EXAMPLE TRADES /*
Here is a screenshot of some of the trades that are possible solely using the POC and some common sense.
s3.tradingview.com

Triple Exponential Moving AveragesIn this above indicator, one can plot 3 indicators simultaneously
where, 200ema can be used to watch on-going long term trend, dynamic support levels for an instrument
50ema can be combined with 200ema forming a Golden Cross strategy, 50ema can be used as short term support and resistance as well.
Lastly, 20ema could be your swing entry, exit, pullback support/resistance, triple crossover for an Ambush entry, Retest entry, etc.
it is one of the most versatile setup where you can trade an instrument by crosschecking and confirming with multiple parameter
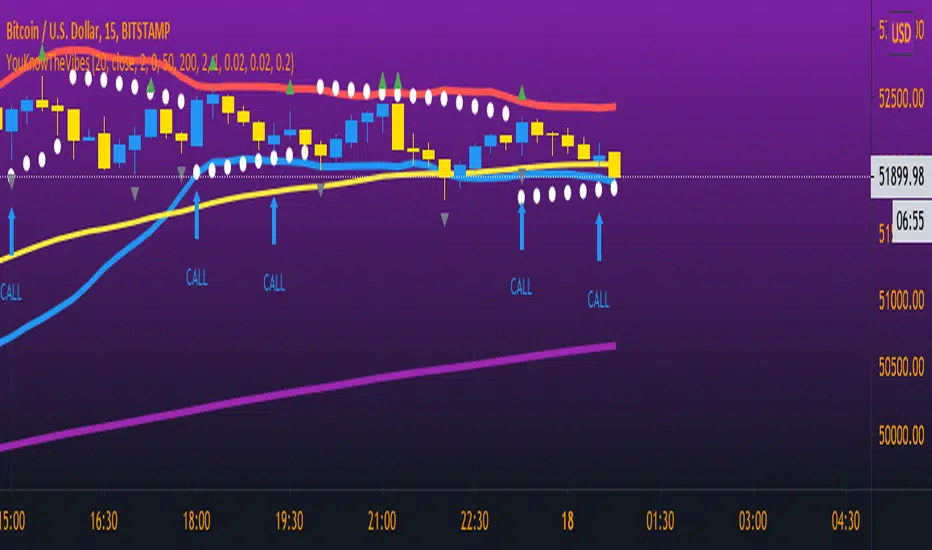
YouKnowTheVibesThis is mainly used for trading binary options but can be used for regular forex trading as well. If price is above BOTH EMAs and PSAR then you're looking for BUY opportunities. If price is below then you're looking for sell opportunities. Wait for price to break the most recent fractal high/low and retest; wait for a confirmation candle then enter a call/put and the expiry time is THREE candles.
Wick Structure FinderFor those who trade structure based support and resistance methods from wicks.
Useful for break and retest trading methods. Mark out the zone and look for S/R flips.
Calculation uses 3 wicks that are next to each other to spot structure.
Includes optional filter for filtering wicks smaller than the average over X previous periods.
Bollinger Band+ Multi EMA, SMAHello Everyone.
I make Bollinger band , 3 ema and 3 sma combined.
I think this indicator can use all timeframe.
--------------------------------------------------------------
Indicator will show you
1. Trend follow
2. Pullback catch
2. Market bounce.
1. Trend Follow
- Trend Follow for I used 3 terms. They are short, Mid and Long Trend.
2. Pullback Catch
- EMA for Save, take care, alert Zones.
- Mid Term Trend can be catch also.
3. Market Bounce
- Bollinger Band will show you market re-bounce point.
Final Notes
Indicator will show Trend, Pullback, Market bounce and some support and resistant level.

Pivot Points 17 - StandardDisclaimer!
-This indicator doesn't tell you the market condition (BUY or SELL)
Cons!
- Totally dependent on your knowledge
Pros!
- Projects the Key Levels of a single time frame on the chart
Usage!
- Watch out for rejections at these levels
- Identify breakouts at these levels with strong confirmation like RETEST (as Level Role Reversal)

Milan OscillatorBill Williams Breakout Setup
I have referred to the man multiple times whether tweeting about him or writing a blog post. Now I want to relearn how breakout trading works, again. A while ago, my friend invited a bunch of us into a Zoom conference sharing us how his setup works for him. He reintroduced me to Bill Williams' indicators which looked like below.
The rules are simple:
Prices are moving away from Alligator, open and closed above the first time.
AC is twice consecutively at par with the direction.
AO is twice consecutively at par with the direction.
Entry on the third candle to be sure, or the second if you're willing to risk it.
The chart above is an example from the 4 hourly time-frame. Before going into any entry, to get a macro perspective, should check on these time-frames first:
Weekly
3 Days
Daily
Bonus points if monthly time-frame is also at par with the bias. Here are the charts for the larger time-frame.
It's been profitable trading with the above setup but then I have an itch to scratch. I wanted to have just a single oscillator instead of two to look at. It will enable me to make decisions faster and can use my brain juice to think about something else.
So I combined the two to create a new oscillator. I call it the `Milan Oscillator` in honor of my friend Patris who reintroduced me to Bill Williams yet again. Patris' favorite team is AC Milan, here's to you bro 🍺
Here are the same charts above with Milan Oscillator.
The rules are a bit different than the rules above:
No entry when the oscillator is gray, this means AC and AO are disagreeing.
Prices are moving away from Alligator, open and closed above the first time.
Oscillator is twice consecutively at par with the direction.
Entry on the third candle to be sure, or the second if you're willing to risk it.
On lower volume moves, prices will retest alligator, can be an entry if the retest fails.
Feedbacks are appreciated.

Pivot Points with Monthly and Weekly optionsA pivot point indicator that has possibility to see even the monthly or the weekly pivot points .
Pivot points are very powerful if used in correct way.
most of the time the price can be rejected from the pivot point or if the price break it it will be a nice entry if retest the pivot
R2/S2 are a very strong pivots to break but of course you need a certain distance between the pivot

Montly Pivot Points indicatorA pivot point indicator that has possibility to see even the monthly or the weekly pivot points.
Pivot points are very powerful if used in correct way.
most of the time the price can be rejected from the pivot point or if the price break it it will be a nice entry if retest the pivot
R2/S2 are a very strong pivots to break but of course you need a certain distance between the pivot.

Simple EMA trend indicatorSimple EMA trend indicator , pretty straightforward green equates to bullish and usually a retest/wick is often seen , same for the flipside viceversa

RSI with plot linesThis is my first script it's pretty simple, the plots are as follows:
80 = Sell
70 = Pending sell
50 = Pullback / Retest
30 = Pending buy
20 = Buy
I would add the text to the plot lines but not sure how, if anyone has away. Please comment and I'll update.
Number StrategyA simple strategy based on fib ratios and numbers
Best time frames for highest accuracy ( Requires Tradingview Pro )
34 mins for quick scalps
89 mins for weekly Swings
254 mins for monthly swings
-Ability to set alerts for btc and $ singals
-Modify Ema values, Set colour
-Trend following strategy, Needs an active trend for best results
-sideways/choppy action results in bad signals
How to trade:
-----------------
Long if Btc signal appears , preferred if price is trading above the 233 EMA .
You can use the 233 EMA for activating trades during price retest
Short if $ signal appears , preferred if price is trading Below the 233 EMA .
You can use the 233 EMA for activating trades during price retest
Adaptive Pivot (HLC3)SUMMARY:
Standard Pivot (HLC3) with ATR leeway added to make it adaptive to market volatility.
DESCRIPTION:
Adaptive Pivot is an indicator utilizing the simplicity of HLC3 Pivots as a turning point (and sometimes a trend indicator) while addressing it's fixed and inflexible nature.
Because the indicator is just a single line in the chart, the price may go near it but never touch it. Or it can go pass through it and never retest it again. In an attempt to lessen these from occurring, we can combine pivots with average true range (ATR). This is the specific formula I applied in this indicator:
>Upper Pivot = HLC3 + ATR
>Lower Pivot = HLC3 - ATR
This creates a kind of a range or cloud around the Pivot, making it possibly a more accurate indicator for market turning points.
ADJUSTABLE PARAMETERS:
The usual ATR parameters are included in this indicator:
>ATR_Length = input(14, title="ATR Length", minval=1)
>ATR_Smoothing = input(title="ATR Smoothing", defval="RMA", options="RMA", "SMA", "EMA", "WMA")
Added to the usual ones is this:
>ATR_Multiplier = input(1, title="ATR Multiplier", minval=0.1)
which modifies the extent of the ATR (similar to Chandelier Exit) as it is added/subtracted from the pivot values.
Pivot’s timeframe is also adjustable:
>Pivot_Timeframe = input("3M", title='Pivot Resolution')
Note: I did not lock the type to input.resolution to allow for more possible timeframes.
OTHER PARAMETERS
Indicator color will change to green when the open is above the HLC3 Pivot and change to red when the reverse is true.
Current Open/Previous High Low Close. Gap HighlightedThis script plots the current open previous high low close. Also the area between the current open and previous close are highlighted to easily see the overnight gap. The idea is that after a significant gap the price will retest previous days levels before continuing in the direction of the gap.
RSI|The Wave PrincipleThe Wave Principle | Modified RSI
30 green | 70 red = Strong Movement (Possible Impulse)
20 cyan | 80 Yellow = Strongest Movement
Support and Resistance Level (Trend Continuation)
Uptrend= 40
Downtrend = 60
Break+Retest = BR
Div = Divergence (Change in trend)
--------------------------------------------
This indicator has been modified from original RSI to fit Wave Principle characteristics:
Uptrend Impulsive Wave over 70 RSI it changes color to red, and > 80 yellow stronger impulse | Usually means continuation, at least once more.
Downtrend Impulsive Wave under 30 RSI it changes color to green, and < 20 cyan stronger impulse | Usually means continuation, at least once more.
Once RSI reached these levels, it doesn't mean trend reversal but a correction is expected. If it shows divergence along with an Ending Diagonal, it's a confirmation for trend reversal.
In a corrective wave, levels 40-60 represents support and resistance levels where price won't go further. Indicating Corrective Waves, not as strong as Impulsives.
Prices can breakout RSI trend lines and retest from the other side before continue the new trend as also described in the Wave Principle.
--------------------------------------------

RSI with Visual Buy/Sell Setup | Corrective/Impulsive IndicatorRSI with Visual Buy/Sell Setup | 40-60 Support/Resistance | Corrective/Impulsive Indicator v2.15
|| RSI - The Complete Guide PDF ||
Modified Zones with Colors for easy recognition of Price Action.
Resistance @ downtrend = 60
Support @ uptrend = 40
Over 70 = Strong Bullish Impulse
Under 30 = Strong Bearish Impulse
Uptrend : 40-80
Downtrend: 60-20
--------------------
Higher Highs in price, Lower Highs in RSI = Bearish Divergence
Lower Lows in price, Higher Lows in RSI = Bullish Divergence
--------------------
Trendlines from Higher/Lower Peaks, breakout + retest for buy/sell setups.
###################
There are multiple ways for using RSI, not only divergences, but it confirms the trend, possible bounce for continuation and signals for possible trend reversal.
There's more advanced use of RSI inside the book RSI: The Complete Guide
Go with the force, and follow the trend.
"The Force is more your friend than the trend"
