Turbulence reversalGiven that the market turbulence tends to cluster, I developed a turbulence moving average system to reveal the unseen underlying structure of the least resistance path for trend following.
Here, I used an SMA subset from the turbulence moving average system to determine the trend direction. This estimation is achieved by calculating the dynamic changes of SMA slope angle and distance between SMA. The former represents a possible reversal signal, and the latter shows the resistance from the intermediate-term SMA.
When the short-term slope angle crossovers the intermediate-term slope angle, the indicator will give a star sign, indicating a possible trend reversal.
Use this indicator together with the turbulence moving average system (Turbulence with direction).
在腳本中搜尋"reversal"
Market direction and pullback based on S&P 500.A simple indicator based on www.swing-trade-stocks.com The link is also the guide for how to use it.
0 - nothing. If the indicator is showing 0 for a prolonged amount of time, it is likely the market is in "momentum mode" (referred to in the link above).
1 - indicates an uptrend based on SMA and EMA and also a place where a reversal to the upside is likely to occur. You should look only for long trades in the stock market when you see a spike upwards and S&P 500 is showing an obvious uptrend.
-1 - indicates a downtrend based on SMA and EMA and also a place where a reversal to the downside is likely to occur. You should look only for short trades in the stock market when you see a spike upwards and S&P 500 is showing an obvious uptrend.

CMYK VRMI RAYS ◊ Introduction
Introducing VRMI in this script, an RMI based on price movement and volume, to indicate bullish and bearish trends.
This script marks the background depending on RMI <> VRMI , VRMI polarity and large buy/sell sprees.
◊ Origin
Based on 'The Relative Momentum Index' by Roger Altman : February, 1993 issue of Technical Analysis of Stocks & Commodities magazine.
While RSI counts up and down days from close to close, the Relative Momentum Index counts up and down days from the close relative to a close x number of days ago.
This results in an RSI that is smoother.
In addition VRMI reacts quick, it is used to cut off latency from RMI, and it's polarity indicates the beginning and end of a trend.
Large buy sell sprees and detected in their proportion with an sma on the volume
◊ Adjustments
CMYK color theme applied.
◊ Usage
This indicator can be used to detect trends and mark reversals.
◊ Prospects
◊ ◊ ◊ ◊ ◊ ◊ ◊ ◊ ◊ ◊ ◊ ◊ ◊ ◊ ◊ ◊ ◊ ◊ ◊ ◊ ◊ ◊ ◊ ◊ ◊ ◊ ◊ ◊ ◊ ◊ ◊ ◊ ◊ ◊ ◊ ◊ ◊ ◊ ◊ ◊ ◊ ◊ ◊ ◊ ◊ ◊ ◊ ◊ ◊ ◊ ◊ ◊ ◊ ◊ ◊ ◊ ◊ ◊ ◊ ◊ ◊ ◊ ◊ ◊ ◊ ◊ ◊ ◊ ◊ ◊ ◊ ◊ ◊ ◊ ◊ ◊ ◊ ◊ ◊ ◊ ◊ ◊ ◊ ◊ ◊ ◊ ◊ ◊ ◊ ◊ ◊ ◊ ◊ ◊ ◊ ◊ ◊ ◊ ◊ ◊ ◊ ◊ ◊ ◊ ◊ ◊

Hurst-Optimized Adaptive Channel [Kodexius]Hurst-Optimized Adaptive Channel (HOAC) is a regime-aware channel indicator that continuously adapts its centerline and volatility bands based on the market’s current behavior. Instead of using a single fixed channel model, HOAC evaluates whether price action is behaving more like a trend-following environment or a mean-reverting environment, then automatically selects the most suitable channel structure.
At the core of the engine is a robust Hurst Exponent estimation using R/S (Rescaled Range) analysis. The Hurst value is smoothed and compared against user-defined thresholds to classify the market regime. In trending regimes, the script emphasizes stability by favoring a slower, smoother channel when it proves more accurate over time. In mean-reversion regimes, it deliberately prioritizes a faster model to react sooner to reversion opportunities, similar in spirit to how traders use Bollinger-style behavior.
The result is a clean, professional adaptive channel with inner and outer bands, dynamic gradient fills, and an optional mean-reversion signal layer. A minimalist dashboard summarizes the detected regime, the current Hurst reading, and which internal model is currently preferred.
🔹 Features
🔸 Robust Regime Detection via Hurst Exponent (R/S Analysis)
HOAC uses a robust Hurst Exponent estimate derived from log returns and Rescaled Range analysis. The Hurst value acts as a behavioral filter:
- H > Trend Start threshold suggests trend persistence and directional continuation.
- H < Mean Reversion threshold suggests anti-persistence and a higher likelihood of reverting toward a central value.
Values between thresholds are treated as Neutral, allowing the channel to remain adaptive without forcing a hard bias.
This regime framework is designed to make the channel selection context-aware rather than purely reactive to recent volatility.
🔸 Dual Channel Engine (Fast vs Slow Models)
Instead of relying on one fixed channel, HOAC computes two independent channel candidates:
Fast model: shorter WMA basis and standard deviation window, intended to respond quickly and fit more reactive environments.
Slow model: longer WMA basis and standard deviation window, intended to reduce noise and better represent sustained directional flow.
Each model produces:
- A midline (basis)
- Outer bands (wider deviation)
- Inner bands (tighter deviation)
This structure gives you a clear core zone and an outer envelope that better represents volatility expansion.
🔸 Rolling Optimization Memory (Model Selection by Error)
HOAC includes an internal optimization layer that continuously measures how well each model fits current price action. On every bar, each model’s absolute deviation from the basis is recorded into a rolling memory window. The script then compares total accumulated error between fast and slow models and prefers the one with lower recent error.
This approach does not attempt curve fitting on multiple parameters. It focuses on a simple, interpretable metric: “Which model has tracked price more accurately over the last X bars?”
Additionally:
If the regime is Mean Reversion, the script explicitly prioritizes the fast model, ensuring responsiveness when reversals matter most.
🔸 Optional Output Smoothing (User-Selectable)
The final selected channel can be smoothed using your choice of:
- SMA
- EMA
- HMA
- RMA
This affects the plotted midline and all band outputs, allowing you to tune visual stability and responsiveness without changing the underlying decision engine.
🔸 Premium Visualization Layer (Inner Core + Outer Fade)
HOAC uses a layered band design:
- Inner bands define the core equilibrium zone around the midline.
- Outer bands define an extended volatility envelope for extremes.
Gradient fills and line styling help separate the core from the extremes while staying visually clean. The midline includes a subtle glow effect for clarity.
🔸 Adaptive Bar Tinting Strength (Regime Intensity)
Bar coloring dynamically adjusts transparency based on how far the Hurst value is from 0.5. When market behavior is more decisively trending or mean-reverting, the tint becomes more pronounced. When behavior is closer to random, the tint becomes more subtle.
🔸 Mean-Reversion Signal Layer
Mean-reversion signals are enabled when the environment is not classified as Trending:
- Buy when price crosses back above the lower outer band
- Sell when price crosses back below the upper outer band
This is intentionally a “return to channel” logic rather than a breakout logic, aligning signals with mean-reversion behavior and avoiding signals in strongly trending regimes by default.
🔸 Minimalist Dashboard (HUD)
A compact table displays:
- Current regime classification
- Smoothed Hurst value
- Which model is currently preferred (Fast or Slow)
- Trend flow direction (based on midline slope)
🔹 Calculations
1) Robust Hurst Exponent (R/S Analysis)
The script estimates Hurst using a Rescaled Range approach on log returns. It builds a returns array, computes mean, cumulative deviation range (R), standard deviation (S), then converts RS into a Hurst exponent.
calc_robust_hurst(int length) =>
float r = math.log(close / close )
float returns = array.new_float(length)
for i = 0 to length - 1
array.set(returns, i, r )
float mean = array.avg(returns)
float cumDev = 0.0
float maxCD = -1.0e10
float minCD = 1.0e10
float sumSqDiff = 0.0
for i = 0 to length - 1
float val = array.get(returns, i)
sumSqDiff += math.pow(val - mean, 2)
cumDev += (val - mean)
if cumDev > maxCD
maxCD := cumDev
if cumDev < minCD
minCD := cumDev
float R = maxCD - minCD
float S = math.sqrt(sumSqDiff / length)
float RS = (S == 0) ? 0.0 : (R / S)
float hurst = (RS > 0) ? (math.log10(RS) / math.log10(length)) : 0.5
hurst
This design avoids simplistic proxies and attempts to reflect persistence (trend tendency) vs anti-persistence (mean reversion tendency) from the underlying return structure.
2) Hurst Smoothing
Raw Hurst values can be noisy, so the script applies EMA smoothing before regime decisions.
float rawHurst = calc_robust_hurst(i_hurstLen)
float hVal = ta.ema(rawHurst, i_smoothHurst)
This stabilized hVal is the value used across regime classification, dynamic visuals, and the HUD display.
3) Regime Classification
The smoothed Hurst reading is compared to user thresholds to label the environment.
string regime = "NEUTRAL"
if hVal > i_trendZone
regime := "TRENDING"
else if hVal < i_chopZone
regime := "MEAN REV"
Higher Hurst implies more persistence, so the indicator treats it as a trend environment.
Lower Hurst implies more mean-reverting behavior, so the indicator enables MR logic and emphasizes faster adaptation.
4) Dual Channel Models (Fast and Slow)
HOAC computes two candidate channel structures in parallel. Each model is a WMA basis with volatility envelopes derived from standard deviation. Inner and outer bands are created using different multipliers.
Fast model (more reactive):
float fastBasis = ta.wma(close, 20)
float fastDev = ta.stdev(close, 20)
ChannelObj fastM = ChannelObj.new(fastBasis, fastBasis + fastDev * 2.0, fastBasis - fastDev * 2.0, fastBasis + fastDev * 1.0, fastBasis - fastDev * 1.0, math.abs(close - fastBasis))
Slow model (more stable):
float slowBasis = ta.wma(close, 50)
float slowDev = ta.stdev(close, 50)
ChannelObj slowM = ChannelObj.new(slowBasis, slowBasis + slowDev * 2.5, slowBasis - slowDev * 2.5, slowBasis + slowDev * 1.25, slowBasis - slowDev * 1.25, math.abs(close - slowBasis))
Both models store their structure in a ChannelObj type, including the instantaneous tracking error (abs(close - basis)).
5) Rolling Error Memory and Model Preference
To decide which model fits current conditions better, the script stores recent errors into rolling arrays and compares cumulative error totals.
var float errFast = array.new_float()
var float errSlow = array.new_float()
update_error(float errArr, float error, int maxLen) =>
errArr.unshift(error)
if errArr.size() > maxLen
errArr.pop()
Each bar updates both error histories and computes which model has lower recent accumulated error.
update_error(errFast, fastM.error, i_optLookback)
update_error(errSlow, slowM.error, i_optLookback)
bool preferFast = errFast.sum() < errSlow.sum()
This is an interpretable optimization approach: it does not attempt to brute-force parameters, it simply prefers the model that has tracked price more closely over the last i_optLookback bars.
6) Winner Selection Logic (Regime-Aware Hybrid)
The final model selection uses both regime and rolling error performance.
ChannelObj winner = regime == "MEAN REV" ? fastM : (preferFast ? fastM : slowM)
rawMid := winner.mid
rawUp := winner.upper
rawDn := winner.lower
rawUpInner := winner.upper_inner
rawDnInner := winner.lower_inner
In Mean Reversion, the script forces the fast model to ensure responsiveness.
Otherwise, it selects the lowest-error model between fast and slow.
7) Optional Output Smoothing
After the winner is selected, the script optionally smooths the final channel outputs using the chosen moving average type.
smooth(float src, string type, int len) =>
switch type
"SMA" => ta.sma(src, len)
"EMA" => ta.ema(src, len)
"HMA" => ta.hma(src, len)
"RMA" => ta.rma(src, len)
=> src
float finalMid = i_enableSmooth ? smooth(rawMid, i_smoothType, i_smoothLen) : rawMid
float finalUp = i_enableSmooth ? smooth(rawUp, i_smoothType, i_smoothLen) : rawUp
float finalDn = i_enableSmooth ? smooth(rawDn, i_smoothType, i_smoothLen) : rawDn
float finalUpInner = i_enableSmooth ? smooth(rawUpInner, i_smoothType, i_smoothLen) : rawUpInner
float finalDnInner = i_enableSmooth ? smooth(rawDnInner, i_smoothType, i_smoothLen) : rawDnInner
This preserves decision integrity since smoothing happens after model selection, not before.
8) Dynamic Visual Intensity From Hurst
Transparency is derived from the distance of hVal to 0.5, so stronger behavioral regimes appear with clearer tints.
int dynTrans = int(math.max(20, math.min(80, 100 - (math.abs(hVal - 0.5) * 200))))

Box TheoryBox Theory – Description
This indicator is based on the popular “Box Theory” concept, where the previous session’s High–Low range acts as the most important structure for the next session.
Traders use this because the market often reacts to the same areas where liquidity, orders, and imbalances were created in the prior session.
At every new session open, the indicator automatically records:
Previous High
Previous Low
Middle (50% level)
These three levels form a box, which becomes your roadmap for the new session.
This method is widely used because it highlights where most reversals, sweeps, and reactions occur—without needing any extra indicators.
How the Zones Are Calculated
Previous High
The highest price of the last session.
This forms the top edge, which acts as resistance and the basis for the Sell Zone.
Previous Low
The lowest price of the last session.
This forms the bottom edge, acting as support and the basis for the Buy Zone.
Middle Line (50% Level)
The exact midpoint between High and Low.
This is the fair-value zone, where price often consolidates and becomes directionless.
No signals are triggered near the middle, because trades taken here historically have low accuracy.
Buy Zone (Green Area)
The lower part of the box.
Price often reacts here because this area held buyers in the previous session.
When price enters this green zone inside the box, the indicator can show a Buy Zone label.
Sell Zone (Red Area)
The upper part of the box.
Price commonly rejects here because this area acted as resistance previously.
When price enters this red zone inside the box, the indicator can show a Sell Zone label.
How Zone Size Is Set (Sensitivity %)
You can adjust how big the Buy/Sell zones are using the Sensitivity (%) input.
Lower % → Smaller zones → More precise signals
Higher % → Larger zones → Signals appear earlier and from farther away
Formula:
Zone Size = (Previous High − Previous Low) × (Sensitivity % ÷ 100)
This lets you customize how tight or how early your signals appear.
Inside-Box Only Logic
The indicator only works inside the previous session’s range.
If price breaks above the previous High → No sell signal
If price breaks below the previous Low → No buy signal
This avoids false signals during breakouts or trending markets.
Alerts
The indicator includes two alerts:
Buy Zone Alert → Triggers when price enters the Buy Zone
Sell Zone Alert → Triggers when price enters the Sell Zone
Just enable them in TradingView’s alert panel.

Continuation / Reversal Sweep (WMA trend)marks hh ll
reversals
continuiation
htf analyisis to enter in ltf

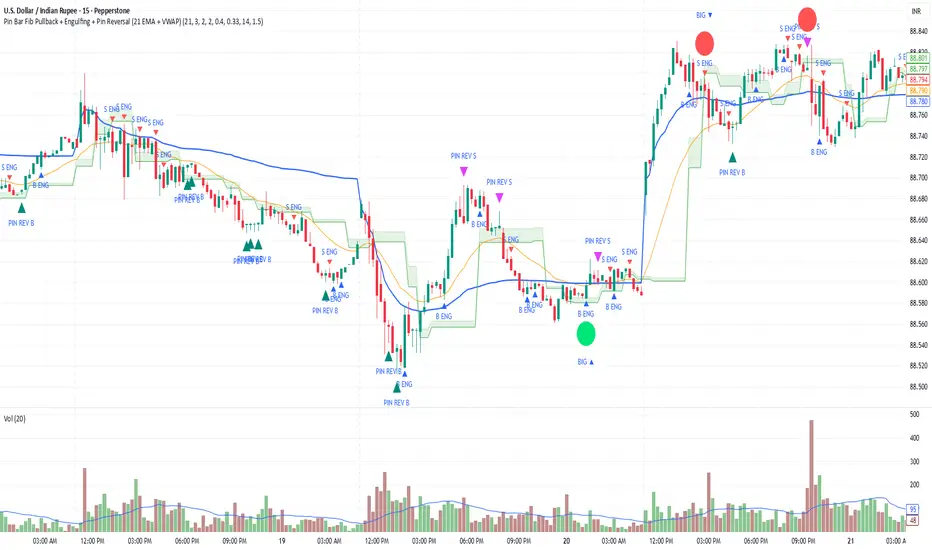
Pin Bar Fib Pullback + Engulfing + Pin Reversal (21 EMA + VWAP)Dear Traders
Pin bar fib pullback continuation (in 0.50–0.618 zone)
Bullish/Bearish engulfing
Pin bar reversals (bottom/top)
Then we ask: did the next candle move at least atrMult × ATR away from the signal close in the right direction?
For a long signal: next high ≥ signal close + ATR * atrMult
For a short signal: next low ≤ signal close − ATR * atrMult
If yes, that signal gets a big circle with text:
BIG ▲ for long
BIG ▼ for short
drawn on the original signal bar (using offset = -1 trick).
You can tune how “big” you want:
Increase ATR length for smoother ATR
Increase ATR * (e.g., from 1.5 → 2.0) to only mark really strong moves.
BTC BRD – Bullet-Proof Reversal DetectorThis indicator identifies true market reversals by analyzing raw price structure instead of traditional lagging indicators. It tracks how Bitcoin (and any crypto asset) naturally shifts direction by detecting confirmed swing points, followed by a structural break in the opposite direction. A bullish signal appears when price forms a higher low and then breaks above the previous structural high; a bearish signal forms when price creates a lower high followed by a break below the previous structural low.
Because it uses pure market structure, every signal reflects an actual change in trend direction, not a temporary pullback or indicator noise. This makes the tool highly reliable across all timeframes — from 1 minute scalping to multi-hour swing setups. The result is a clean, noise-free view of where the market truly reverses, giving traders clear confirmation points to plan entries, exits, or risk management.

ORB Breakout Strategy with reversalORB 1,5,15,30,60min with reversals, its my first strategy Im not 100% sure it works well. Im not a programmer nor a profitable trader.
Max stoploss in points sets maximum fixed stoploss
Stop offset sets additional points below/above signal bar
RR Ratio is pretty self explanatory, it sets target based on stoploss
American session is time when positions can be opened
ORB SessionIs basically almost the same but when the time runs it closes all positions\
ORB candle timeframe is the time which orb is measured
Enable reverse position enables reversing positions on stoploss of first position, stoploss of reverse position is based on max stoploss and target is set by RR times max stoploss
Im sharing this to share this with my friends, discuss some things and dont have to test it manually.
I made it all myself and with help of AI
Sorry for bad english

Momentum Reversal StrategyBEST USE IN 15MIN TIME FRAME EURUSD / XAUSUD
1. Strategy Overview
This strategy hunts short-term momentum reversals at key levels during high-liquidity sessions.
Timeframes: 5-minute for entries; 15-minute for trend context
Sessions: London for EUR/USD & GBP/USD; New York for XAU/USD
Pairs: EUR/USD, GBP/USD, XAU/USD
Indicators (3 max):
EMA(20) and EMA(50) (close)
MACD (12, 26, 9) histogram
Optional: RSI(14) (for divergence filter)
2. Entry Rules
Trend Filter (15 min):
Long only if EMA20 > EMA50; short only if EMA20 < EMA50.
Price-Action Zone (5 min):
Identify recent swing high/low within past 20 bars.
Draw horizontal support (for longs) or resistance (for shorts).
Indicator Alignment (5 min):
MACD histogram crossing from negative to positive for longs, positive to negative for shorts.
Candle close beyond EMA20 in direction of trade.
Candle Confirmation:
Bullish engulfing or hammer at support for longs; bearish engulfing or shooting star at resistance for shorts.
Entry Execution:
Place market order on candle close that meets all above.
3. Exit Rules
Stop-Loss (SL):
Long: 1.5× ATR(14) below entry candle low.
Short: 1.5× ATR(14) above entry candle high.
Take-Profit (TP):
Set at 2× SL distance (RR 1:2).
Trailing SL:
After price moves 1× SL in profit, trail SL to breakeven.
Partial Booking:
Close 50% at 1× SL (50% of TP), move SL to entry.
Close remaining at full TP.
4. Trade Management
False Signal Filter: Skip trades when RSI(14) > 70 for longs or < 30 for shorts (avoids overbought/oversold extremes).
One Trade at a Time: No multiple positions on same pair.
Session Cutoff: Close any open trade 15 minutes before session end.
5. Risk Parameters
Risk per Trade: 1% of account equity.
Reward Target: ≥2% (1:2 RR) per trade.
Win-Rate Expectancy: ≥75% based on indicator confluence and price-action confirmation.

Williams Fractals Ultimate (Donchian Adjusted)Williams Fractals Ultimate (Donchian Adjusted)
Understanding Williams Fractals
Williams Fractals are a simple yet powerful tool used to identify potential turning points in the market. They highlight local highs (up fractals) and local lows (down fractals) based on a set period.
An up fractal appears when a price peak is higher than the surrounding prices.
A down fractal appears when a price low is lower than the surrounding prices.
Fractals help traders spot support and resistance levels, potential trend reversals, and price breakout zones.
Why Adjust Fractals with the Donchian Channel?
The standard Williams Fractals method identifies local highs and lows without considering broader market context. This script enhances fractal accuracy by integrating the Donchian Channel, which tracks the highest highs and lowest lows over a set period.
- The Donchian Baseline is calculated as the average of the highest high and lowest low over a selected period.
- Fractals are filtered based on this baseline:
Up Fractals are only shown if they are above the Donchian baseline.
Down Fractals are only shown if they are below the Donchian baseline.
This filtering method removes weak signals and ensures that only relevant fractals aligned with market structure are displayed.
Key Features of the Script
Customizable Fractal & Donchian Periods – Allows traders to fine-tune fractal sensitivity.
Donchian-Based Filtering – Reduces noise and highlights meaningful fractals.
Fractal ZigZag Line (Optional) – Helps visualize price swings more clearly.
Why Is This So Effective?
Stronger trend signals – Filtering with the Donchian baseline eliminates unreliable fractals.
Clearer price action – The optional ZigZag line visually connects significant highs and lows.
Easy trend identification – Helps traders confirm breakout zones and key price levels.
This script is a technical analysis tool and does not guarantee profitable trades. Always combine it with other indicators and risk management strategies before making trading decisions.

Wick Volume AlertThis indicator is intended to find a possible price reversal and is well suited for scalping in the smaller timeframes from 1 to 15min chart. It is important to use it in conjunction with other indicators such as order blocks or price levels.
The advantage over other Wick indicators is that volume is also taken into account.
Unfortunately, the markers on the chart do not work properly as they do not attach themselves when moving vertically. I would be happy if someone could fix the problem, as I am not a professional in Pine scripting.

Exponential Avg Body Size Green vs RedDescription :
This indicator calculates and plots the Exponential Moving Average (EMA) of green and red candlestick body sizes, allowing traders to easily visualize market momentum and sentiment shifts. The script includes the following features:
Customizable EMA Period: Users can set the number of candles to calculate the EMA through an input setting, with a default value of 21.
Separate Green and Red Candle Averages: Differentiates between bullish (green) and bearish (red) candlestick movements, plotting them as distinct lines.
Dynamic Range Control: Users can adjust the chart range (e.g., -50 to 50) for better visibility of the plotted lines.
Baseline for Reference: A horizontal baseline at 0 serves as a visual aid for easier interpretation.
Standalone Indicator Pane: The script is designed to display in a separate pane, preventing overlap with the price chart.
Use Case:
This indicator is ideal for traders seeking to analyze the relative strength of bullish versus bearish price movements over a specific period. The separation of green and red averages helps identify trends, potential reversals, or shifts in momentum.

VWAP Bands [UAlgo]The "VWAP Bands " indicator is designed to provide traders with valuable insights into market trends and potential support/resistance levels using Volume Weighted Average Price (VWAP) bands. This indicator integrates the core concepts of VWAP with additional trend analysis features, making it a versatile tool for both range trading and trend-following strategies.
The VWAP bands are plotted based on the standard deviation multipliers, creating upper and lower bands around the VWAP. These bands serve as dynamic support and resistance levels. When the price approaches these bands, traders can anticipate potential reversals or continuations of the current trend. Additionally, the indicator provides visual cues for trend strength and potential trend changes, helping traders make informed decisions in various market conditions.
🔶 Settings
Source (Data Source): The data source for VWAP calculations. The default setting is the typical price (HLC3), which is the average of the high, low, and close prices.
Length: The number of bars used in the VWAP calculation. This determines the lookback period for the indicator.
Standard Deviation Multiplier: The multiplier applied to the standard deviation to create the primary upper and lower VWAP bands. This setting controls the distance of the bands from the VWAP.
Secondary Standard Deviation Multiplier: The multiplier applied to the standard deviation to create the secondary upper and lower VWAP bands, providing additional levels of support and resistance.
Display Trend: A toggle to enable or disable the display of the trend analysis feature. When enabled, the indicator highlights trend strength and potential trend changes.
Display Trend Crossovers: A toggle to enable or disable the display of trend crossover signals. When enabled, the indicator plots shapes to indicate where trend switches are likely occurring.
🔶 Calculations
The calculations behind the "VWAP Bands " indicator begin with determining the Volume Weighted Average Price (VWAP), which provides a comprehensive view of the average price of an asset, weighted by trading volume. This gives a more accurate representation of the asset's true average price over a specified period.
The first step in this process involves summing the trading volume over a chosen period, typically represented by the length parameter. Simultaneously, the product of the price (usually an average of the high, low, and close prices) and the trading volume is calculated and summed. By dividing this cumulative price-volume product by the total volume, we obtain the VWAP value. This VWAP serves as the central anchor around which the price action oscillates.
To enhance the utility of VWAP, we introduce standard deviation calculations. Standard deviation measures the extent of price dispersion from the VWAP, providing insight into price volatility. By calculating the variance (which involves the squared deviations of price) and then taking its square root, we derive the standard deviation. This helps in understanding how far prices typically stray from the VWAP.
With the VWAP and standard deviation in hand, we then establish upper and lower bands by adding and subtracting multiples of the standard deviation from the VWAP. These bands act as dynamic support and resistance levels, adapting to changes in market volatility. The primary bands, set by the first standard deviation multiplier, are augmented by secondary bands defined by a larger multiplier, offering additional layers of potential support and resistance.
It also integrates trend analysis, highlighting areas where the price action suggests a strong or weak trend. This is achieved by overlaying colored zones above and below the bands, indicating the strength and direction of the trend. When the price crosses these bands, it signals potential trend changes, aiding traders in making timely decisions.
🔶 Disclaimer
The "VWAP Bands " indicator is provided for educational and informational purposes only. It is not intended as financial advice and should not be construed as such.
Trading involves significant risk and may not be suitable for all investors. Before using this indicator or making any investment decisions, it is important to conduct thorough research and consider your financial situation.

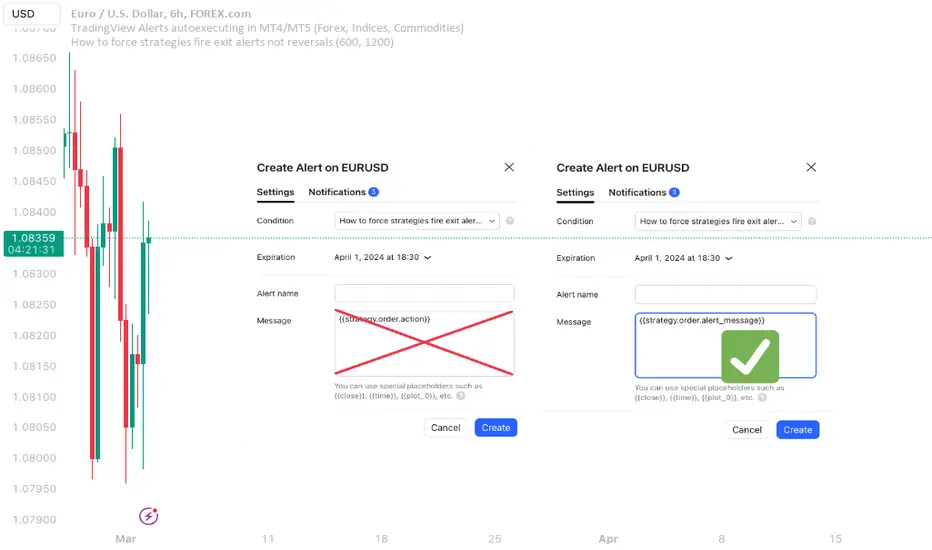
How to force strategies fire exit alerts not reversalsPineScript has gone a long way, from very simple and little-capable scripting language to a robust coding platform with reliable execution endpoints. However, this one small intuitivity glitch is still there and is likely to stay, because it is traditionally justified and quite intuitive for significant group of traders. I'm sharing this workaround in response to frequent inquiries about it.
What's the glitch? When setting alerts on strategies to be synchronized with TradingView's Strategy Tester events, using simple alert messages such as "buy" or "sell" based on entry direction seems straightforward by inserting {{strategy.order.action}} into the Create Alert's "Message" field. Because "buy" or "sell" are exactly the strings produced by {{strategy.order.action}} placeholder. However, complications arise when attempting to EXIT positions without reversing, whether triggered by price levels like Stop Loss or Take Profit, or logical conditions to close trades. Those bricks fall apart, because on such events {{strategy.order.action}} sends the same "sell" for exiting buy positions and "buy" for exiting sell positions, instead of something more differentiating like "closebuy" or "closesell". As a result reversal trades are opened, instead of simply closing the open ones.
This convention harkens back to traditional stock market practices, where traders either bought shares to enter positions or sold them to exit. However, modern trading encompasses diverse instruments like CFDs, indices, and Forex, alongside advanced features such as Stop Loss, reshaping the landscape. Despite these advancements, the traditional nomenclature persists.
And is poised to stay on TradingView as well, so we need a workaround to get a simple strategy going. Luckily it is here and is called alert_message . It is a parameter, which needs to be added into each strategy.entry() / strategy.exit() / strategy.close() function call - each call, which causes Strategy Tester to produce entry or exit orders. As in this example script:
line 12: strategy.entry(... alert_message ="buy")
line 14: strategy.entry(... alert_message ="sell")
line 19: strategy.exit(... alert_message ="closebuy")
line 20: strategy.exit(... alert_message ="closesell")
line 24: strategy.close(... alert_message ="closebuy")
line 26: strategy.close(... alert_message ="closesell")
These alert messages are compatible with the Alerts Syntax of TradingConnector - a tool facilitating auto-execution of TradingView alerts in MetaTrader 4 or 5. Yes, simple alert messages like "buy" / "sell" / "closebuy" / "closesell" suffice to carry the execution of simple strategy, without complex JSON files with multiple ids and such. Other parameters can be added (actually plenty), but they are only option and that's not a part of this story :)
Last thing left to do is to replace "Message" in Create Alert popup with {{strategy.order.alert_message}} . This placeholder transmits the string defined in the PineScript alert_message= parameter, as outlined in this publication. With this workaround, executing closing alerts becomes seamless within PineScript strategies on TradingView.
Disclaimer: this content is purely educational, especially please don't pay attention to backtest results on any timeframe/ticker.
Trend Channels With Liquidity Breaks [ChartPrime]Trend Channels
This simple trading indicator is designed to quickly identify and visualize support and resistance channels in any market. The primary purpose of the Trend Channels with Liquidity Breaks indicator is to recognize and visualize the dominant trend in a more intuitive and user-friendly manner.
Main Features
Automatically identifies and plots channels based on pivot highs and lows
Option to extend the channel lines
Display breaks of the channels where liquidity is deemed high
Inclusion of volume data within the channel bands (optional)
Market-friendly and customizable colors and settings for easy visual identification
Settings
Length: Adjust the length and lookback of the channels
Show Last Channel: Only shows the last channel
Volume BG: Shade the zones according to the volume detected
How to Interpret
Trend Channels with Liquidity Breaks indicator uses a combination of pivot highs and pivot lows to create support and resistance zones, helping traders to identify potential breakouts, reversals or continuations of a trend.
These support and resistance zones are visualized as upper and lower channel lines, with a dashed center line representing the midpoint of the channel. The indicator also allows you to see the volume data within the channel bands if you choose to enable this functionality. High volume zones can potentially signal strong buying or selling pressure, which may lead to potential breakouts or trend confirmations.
To make the channels more market-friendly and visually appealing, Trend Channels indicator also offers customizable colors for upper and lower lines, as well as the possibility to extend the line lengths for further analysis.
The indicator displays breaks of key levels in the market with higher volume.

Rainbow Collection - VioletMoving averages come in all shapes and types. The most basic type is the simple moving average which is simply the sum divided by the quantity. Therefore, the simple moving average is the sum of the values divided by their number.
In technical analysis, you generally use moving averages to understand the underlying trend and to find trading signals. In the case of the Violet indicator, we are using a Hull moving average which is a special variation based on different weights to minimize lag.
The Violet indicator is therefore used as follows:
* A bullish signal is generated whenever the close price surpasses the 20-period Hull moving average while the previous close prices from periods were all below their respective Hull moving average of the period.
*A bearish signal is generated whenever the close price breaks the 20-period Hull moving average while the previous close prices from periods were all above their respective Hull moving average of the period.
The aim of the Violet indicator is to capture reversals as early as possible through a combination of lagged conditions based on the Fibonacci sequence.

Return Abnormality Score [SpiritualHealer117]The Return Abnormality Score indicator is designed to help traders identify potential reversals in price by detecting abnormal daily returns beyond a certain significance level. The indicator uses a normal cumulative distribution function to calculate the probability of the daily return and flags it when it exceeds the specified significance level.
Traders can use this indicator by monitoring the abnormality score. If the daily return is negative, the probability is multiplied by a negative number. Therefore, if the abnormality score goes above the positive threshold, it suggests that the price is oversold, while if it goes below the negative threshold, it indicates that the price is overbought. It can also be helpful for spotting bear or bull traps due to their irregular behavior.
Depending on the trader's preference, the indicator can be smoothed or unsmoothed.
This indicator should be paired with other technical analysis tools like SSL Hybrid for trend confirmation, and proper risk management strategies.

William Blau Ergodic Tick Volume Indicator (TVI) [Loxx]William Blau Ergodic Tick Volume Indicator (TVI) is a volume/volatility indicator that is used for finding reversals in price movement
What is William Blau Ergodic Tick Volume?
This is one of the techniques described by William Blau in his book "Momentum, Direction and Divergence" (1995). If you like to learn more, we advise you to read this book. His book focuses on three key aspects of trading: momentum, direction and divergence. Blau, who was an electrical engineer before becoming a trader, thoroughly examines the relationship between price and momentum in step-by-step examples. From this grounding, he then looks at the deficiencies in other oscillators and introduces some innovative techniques, including a fresh twist on Stochastics. On directional issues, he analyzes the intricacies of ADX and offers a unique approach to help define trending and non-trending periods.
William Blau's definition of TVI ergodicity is that the indictor is ergodic when periods are set to 32, 5, 1, and the signal is set to 5. Other combinations are not ergodic, according to Blau.
How to use TVI
TVI bar color change is a signal to enter the market. When the TVI changes from yellow to red, it is a signal to buy and if the TVI bar changes from blue to green, it is a signal to sell.
Just like the MACD and TRIX, the zero line on the indicator determines market sentiment and trend. If the TVI bars are above the zero line it's bullish and if the TVI bars are below the zero line the trend is bearish. Zero line crosses can be used to determine continuation and trend entries as well.
Included
Bar coloring
35+ moving averages for both TVI and the signal
Infiten's Price Percentage Oscillator Channel (PPOC Indicator)What is the script used for?
Infiten's Price Percentage Oscillator (PPOC Indicator) can be used as a contrarian indicator for volatile stocks and futures to indicate reversals, areas of support and resistance. For longer term trading, if the Short SMA or prices go above the High PPO Threshold line, it is a sign that the asset is overbought, whereas prices or the Short SMA going below the Low PPO Threshold line indicates that the asset is oversold.
What lines can be plotted?
Low PPO Thresh - Calculated as -PPO Threshold * Short MA + Long MA : Gives the price below which the PPO hits your lower threshold
High PPO Thresh - Calculated as PPO Threshold * Short MA + Long MA : Gives the price above which the PPO hits your upper threshold
MA PPO : Plots candles with the Low PPO Thresh as the low, High PPO Thresh as the high, Short MA as the open, and Long MA as the close.
Short SMA : plots the short simple moving average
Long SMA : plots the long simple moving average
Customizable Values :
Short MA Length : the number of bars back used to calculate the short moving average for a PPO
Long MA Length : the number of bars back used to calculate the long moving average for a PPO
PPO Threshold : the percent difference from the moving average expressed as a decimal (0.5 = 50%)
Recommendations:
Longer timeframes like 300 days are best with larger PPO Thresholds, I recommend using a PPO Threshold of 0.5 or higher. For shorter timeframes like 14 days I recommend setting smaller PPO Thresholds, like 0.3 or lower. I find that these values typically capture the most extremes in price action.
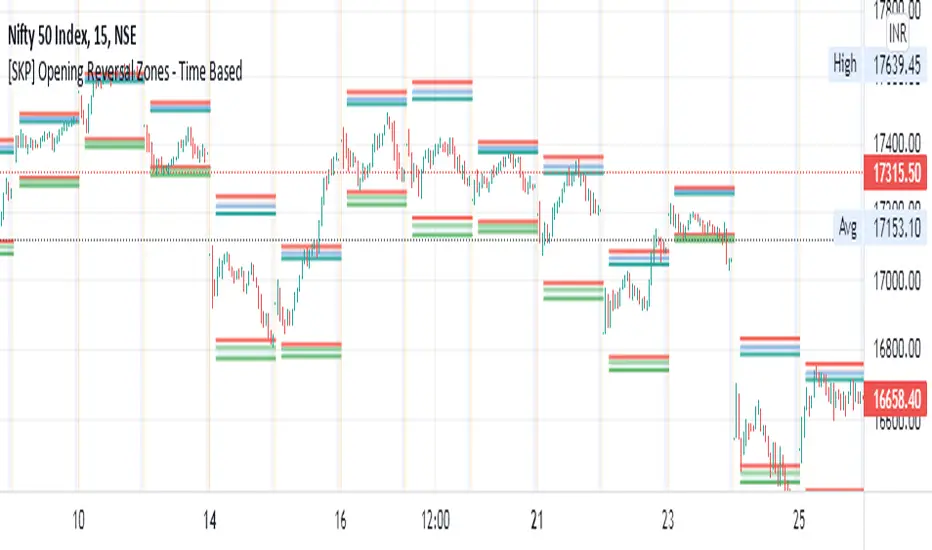
[SKP] Opening Range Reversals with FIBO zonesopening range reversal zones with fibo .50, .618, .786, 1 levels
opening range time can set as you like, 15M, 30M etc
entry at .50 and .618 levels with stop loss .786 and 1 levels.
do backtest and practice..
idea from author colejustice
Random Walk ReversalUses the Random Walk script as a tool for predicting trend reversals instead of trend strength.

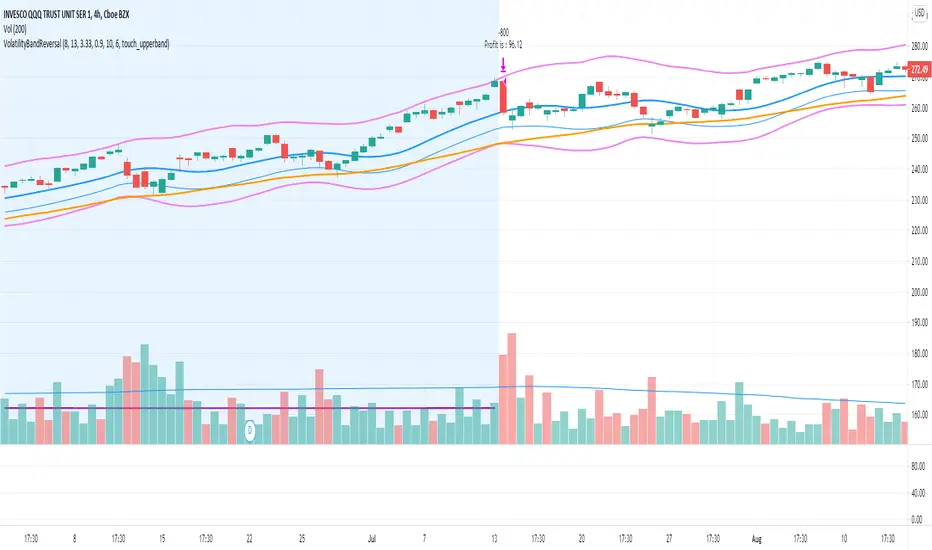
Volatility Bands Reversal Strategy [Long Only]This strategy based on existng indicator available on TV
If finds the reversals for LONG entries ... I have modified the settings to back test it ...
BUY
====
When the price touches lower band , and tries to close above lower band
some signals are mixed up, you can research and look for a confirmation ...
if the middle band is above EMA50 , you can simply follow the strategy BUY signal
but if the middle band is EMA50 , wait for the price to close above middle band
Sell / Close
==========
wait for the sell signa OR close when price touches the upper band
How do you want to close , you can chose in settings. Chnage these values and see the performance
Please note , sell means just closing the existing LONG position , not short selling
Stop Loss
=========
Stop Loss is defaulted to 6%
This is tested in 1HR, 2HR and 4 HRs chart for SPY and QQQ ETFS ...
for long term investing style , 4 Hrs is the best time frme for this strategy
Warning
========
It is not a financial advise , it is for educational purposes only. Please do your own research before taking any trading decission