Breakout & Trend & Scalping (Zeiierman)█ Overview
Breakout & Trend & Scalping (Zeiierman) transforms time, volume, and trend behavior into a unified visual framework for identifying market expansion, compression, and breakout phases. Instead of viewing price as an isolated movement, the indicator reinterprets it as a continuous relationship between time-driven flow, volume displacement, and trend momentum.
The system constructs a hybrid analytical field using OBV-based flow modeling, time–trend alignment, and adaptive candle smoothing, providing a clear and fluid representation of both breakout probability and structural trend strength.
This advanced framework adapts to different market contexts, including intraday scalping, swing-trend validation, and multi-timeframe continuation analysis, revealing how volume and trend energy accumulate before volatility expansion.
⚪ Why This One Is Unique
Unlike conventional breakout or trend indicators that rely solely on price or volatility, this tool integrates time-weighted OBV mechanics, multi-timeframe trend correlation, and volatility-normalized candle transformation.
Its design leverages an adaptive Time–Trend Integration Engine that adjusts dynamically based on the selected timeframe and method. The result is a fluid, self-normalizing view of market rhythm, capturing not only the visible structure of trends but also the hidden buildup of momentum that precedes breakouts.
█ Main Feature: BTS Adaptive Candle System
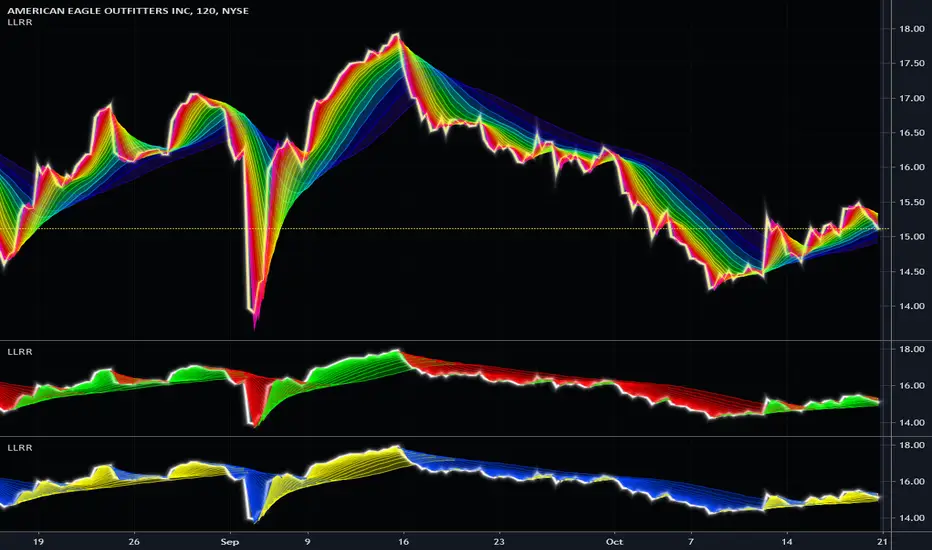
The BTS Adaptive Candle System unifies time-based and trend-based flow analysis into a single visual model of market behavior. It synchronizes short-term momentum with long-term trend equilibrium, revealing how volume and directional energy evolve across different temporal structures.
The flow is inherently adaptive. During stable phases, it compresses volatility to emphasize directional persistence and trend continuity. When acceleration builds, it expands to highlight breakout potential and the ignition of new momentum.
Green-to-red and (red-to-green) transitions indicate shifts in order-flow dominance, while color intensity reflects the relative strength of participation. The built-in smoothing system filters out random noise while maintaining fast response to emerging direction, making the BTS Candle System equally effective for scalping precision, breakout confirmation, and long-term trend tracking.
█ How to Use
⚪ Trend Trading
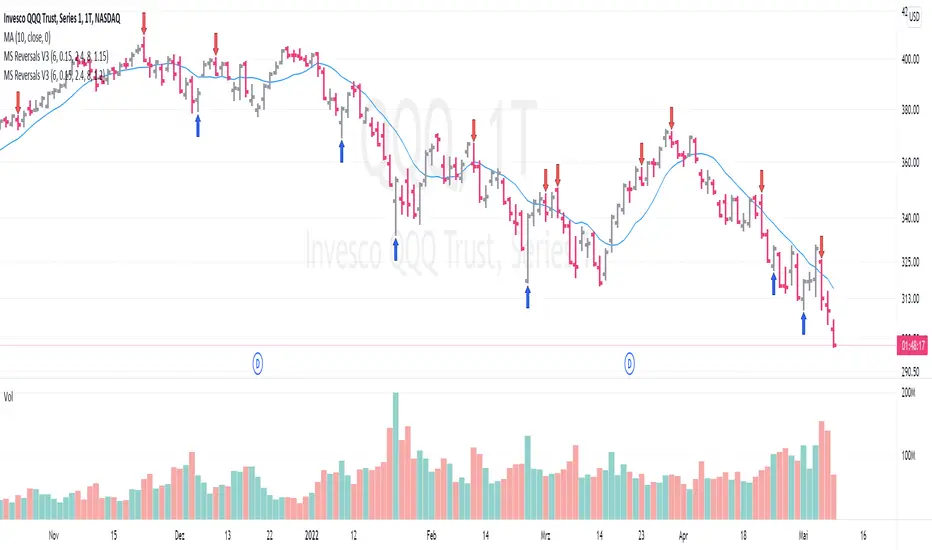
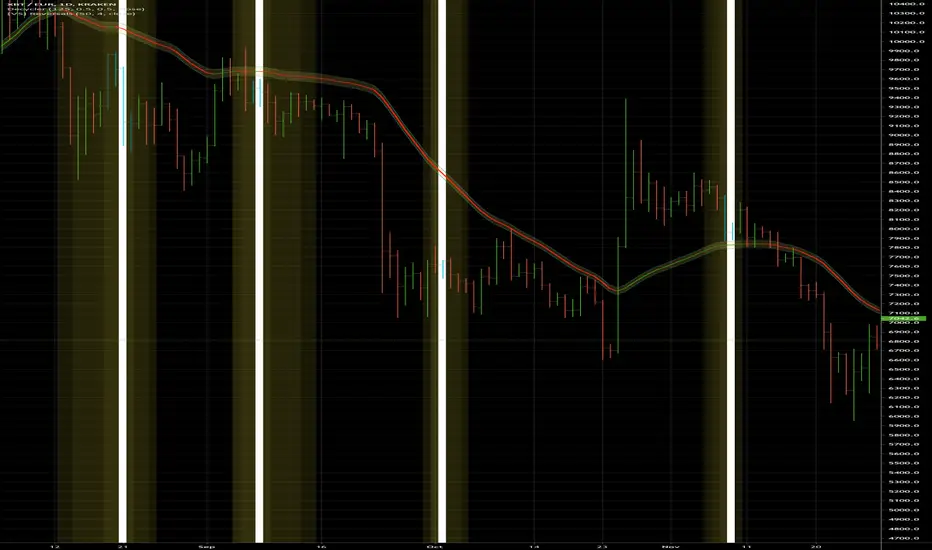
Bullish trends appear when candles remain near the top of their range with bright, steady coloration. This structure shows sustained accumulation and consistent trend support. Fading color or mixed tones suggest short pauses or shallow pullbacks within an ongoing uptrend.
Bearish trends form when candles cluster near the lower range and deepen in red intensity, reflecting growing selling pressure. Consistent red sequences mark continued distribution, while lighter tones or brief color shifts often precede corrective bounces within a broader downtrend.
⚪ Trend Change Trading
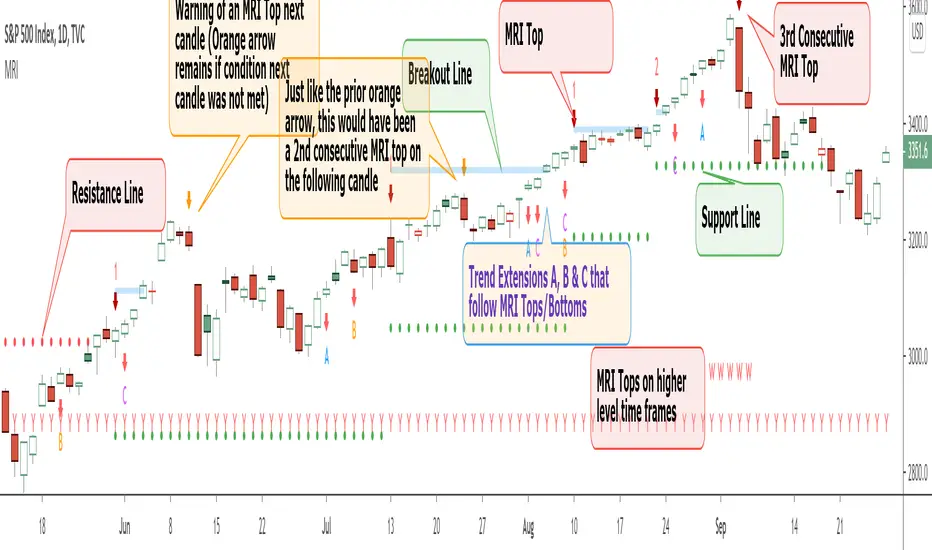
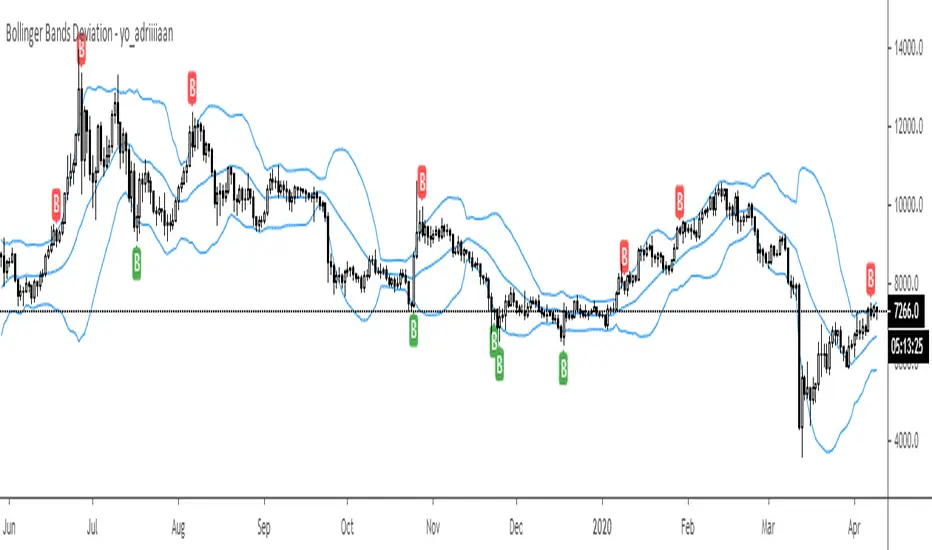
When a large BTS candle crosses the midline, it often marks a decisive shift in market control. A strong candle breaking above the midline reflects dominant buying flow and the early phase of bullish momentum, often signaling the start of a new upward trend.
Conversely, when a large candle drops below the midline, it shows dominant selling pressure and the potential beginning of a downward cycle.
These midline transitions represent key moments where institutional flow changes direction. A rapid color shift or fading saturation in candles around these areas frequently precedes a trend reversal or volatility breakout, making them powerful confirmation points for both breakout and trend-change strategies.
⚪ Retracement/Pullback Trading
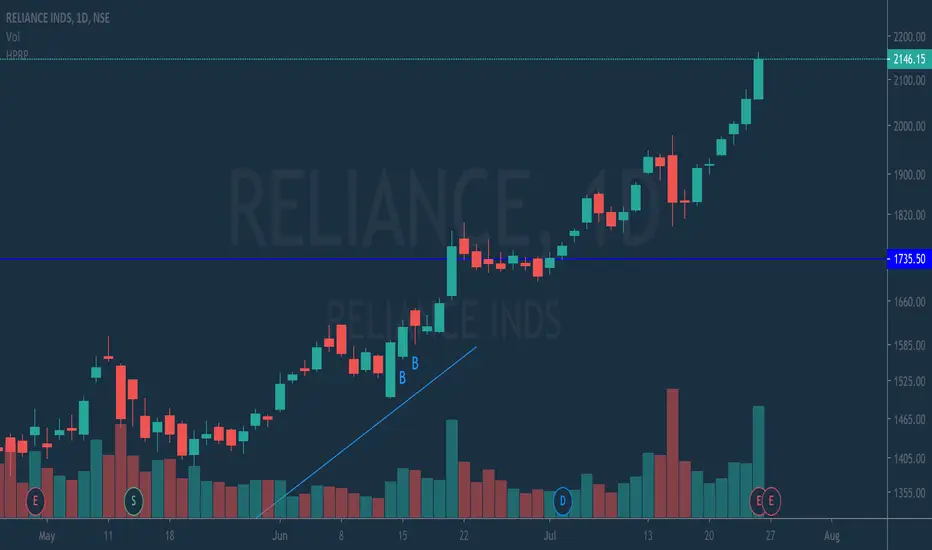
When BTS candles remain green or turn light yellow near the midline, it indicates balanced momentum as price consolidates during a temporary retracement. A renewed shift back to bright green candles from this area often signals the end of the pullback and the continuation of the uptrend.
In a downtrend, when BTS candles shift to light yellow or fade toward the midline, it shows a temporary slowdown in selling pressure as the price retraces upward. A return to deep red candles after this brief balance phase confirms renewed selling momentum and continuation of the prevailing downtrend.
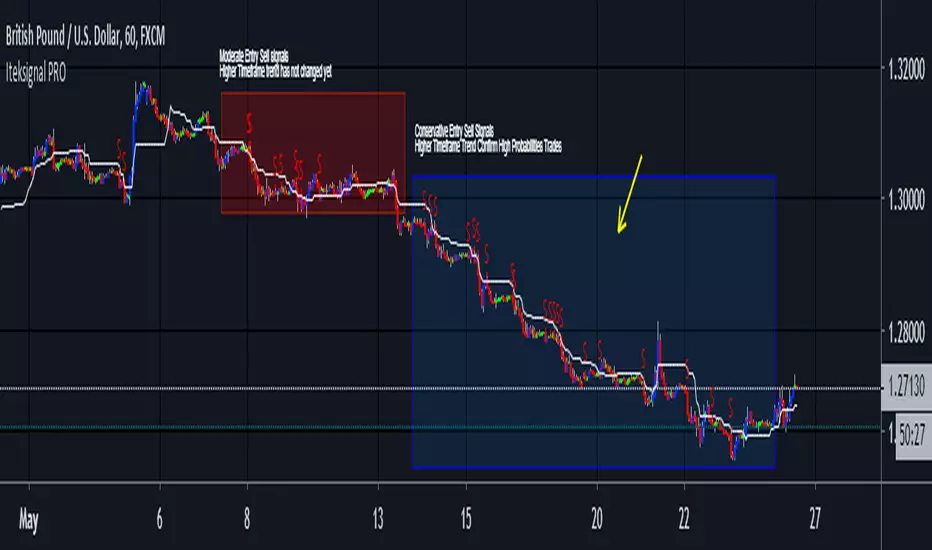
⚪ Breakout Trading
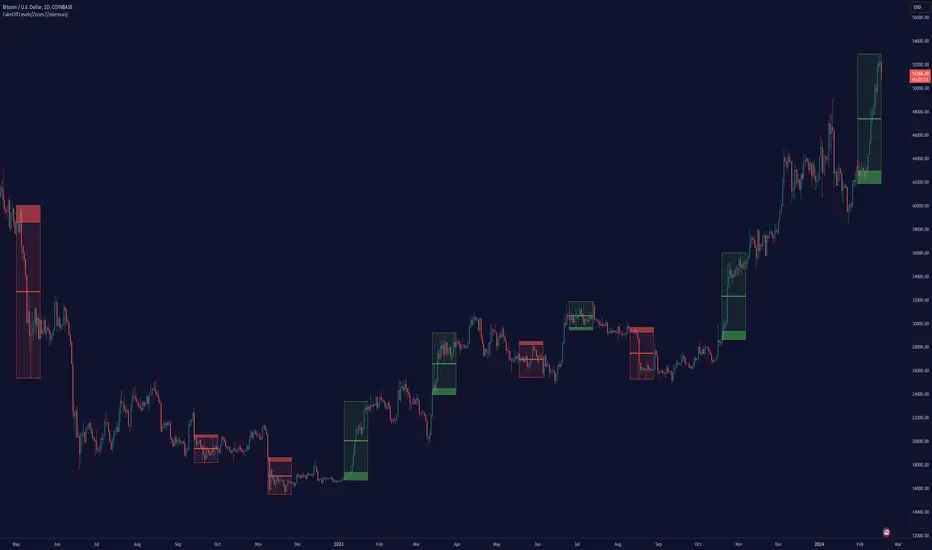
Big candles in the BTS indicate a shift in control. If this occurs around a resistance level, there is a high chance that price will break out upward.
Similarly, if a large downward BTS candle appears near a support level, there is a high chance that a bearish breakout will follow through.
█ How It Works
⚪ Integrated Market Framework
The BTS system merges time, trend, and volatility behavior into a single adaptive flow field. It constantly balances fast and slow market components, maintaining a smooth equilibrium between short-term reactions and long-term structure.
Calculation: Uses normalized scaling and adaptive synchronization to align directional momentum across changing market states.
⚪ Core Trend Engine
At its center, the model interprets how price movement evolves within its volatility range. It tracks shifts in directional energy and transforms them into a stable momentum surface that highlights both trend continuation and turning points.
Calculation: Applies equilibrium-based mapping to sustain consistent directional flow even during market acceleration or compression.
⚪ Volatility Envelope System
The indicator forms a dynamic envelope around price movement, expanding and contracting with the current market speed. These zones reflect where energy concentrates or fades, helping visualize breakout potential and exhaustion levels.
Calculation: Adapts envelope boundaries through volatility-responsive scaling and balanced symmetry control.
⚪ Adaptive Time Modes
Two adaptive modes — Time and Trend — control how the model responds to changing conditions. The system automatically adjusts its responsiveness, allowing it to behave as a fast scalping model or a slow trend tracker without losing structural balance.
Calculation: Dynamically modifies its internal scaling to maintain equilibrium between speed and smoothness across selected timeframes.
-----------------
Disclaimer
The content provided in my scripts, indicators, ideas, algorithms, and systems is for educational and informational purposes only. It does not constitute financial advice, investment recommendations, or a solicitation to buy or sell any financial instruments. I will not accept liability for any loss or damage, including without limitation any loss of profit, which may arise directly or indirectly from the use of or reliance on such information.
All investments involve risk, and the past performance of a security, industry, sector, market, financial product, trading strategy, backtest, or individual's trading does not guarantee future results or returns. Investors are fully responsible for any investment decisions they make. Such decisions should be based solely on an evaluation of their financial circumstances, investment objectives, risk tolerance, and liquidity needs.
付費腳本