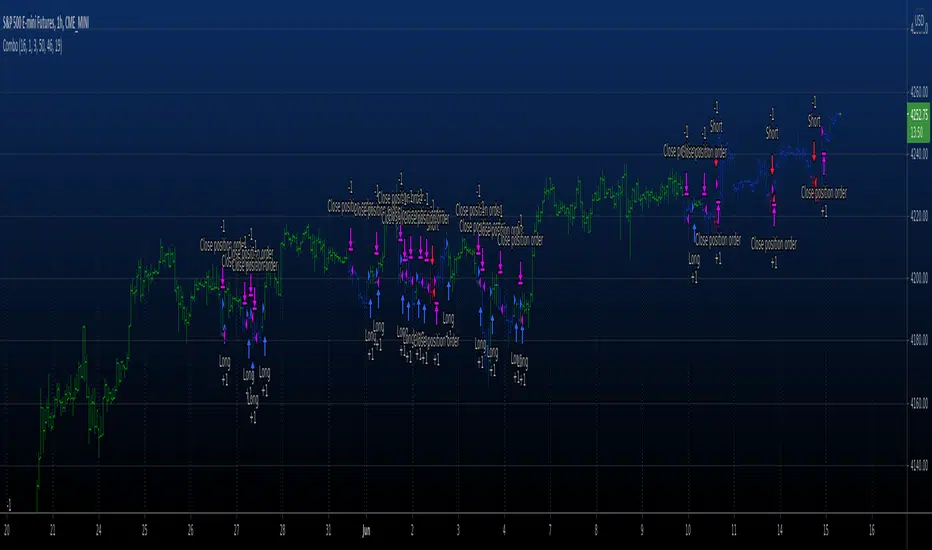
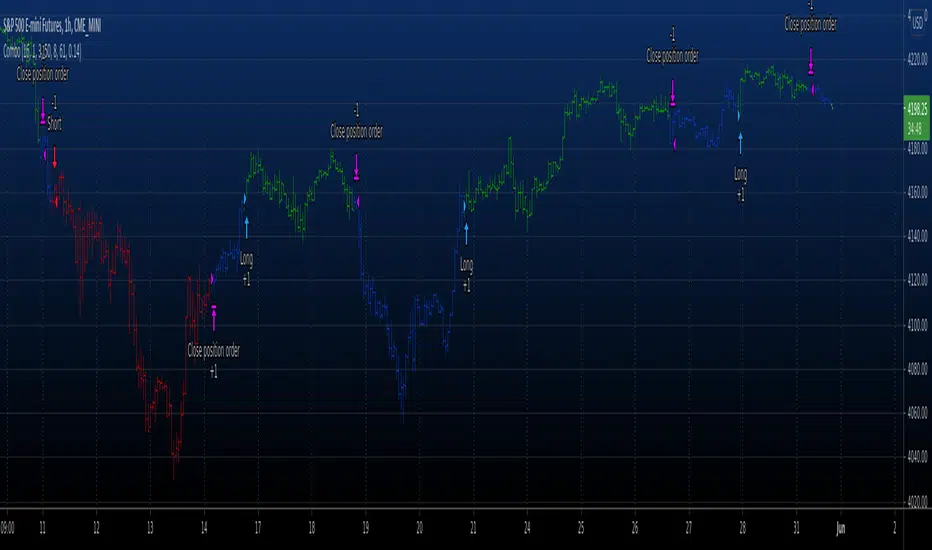
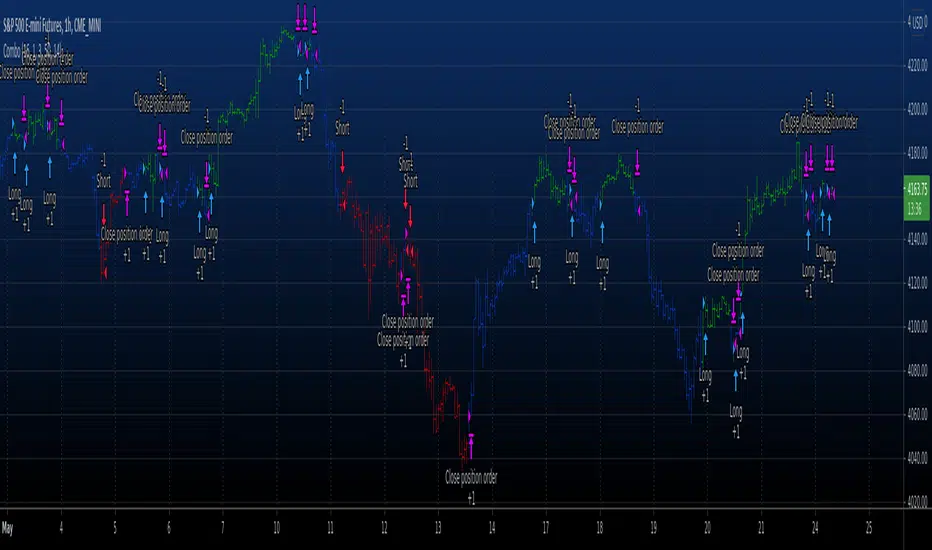
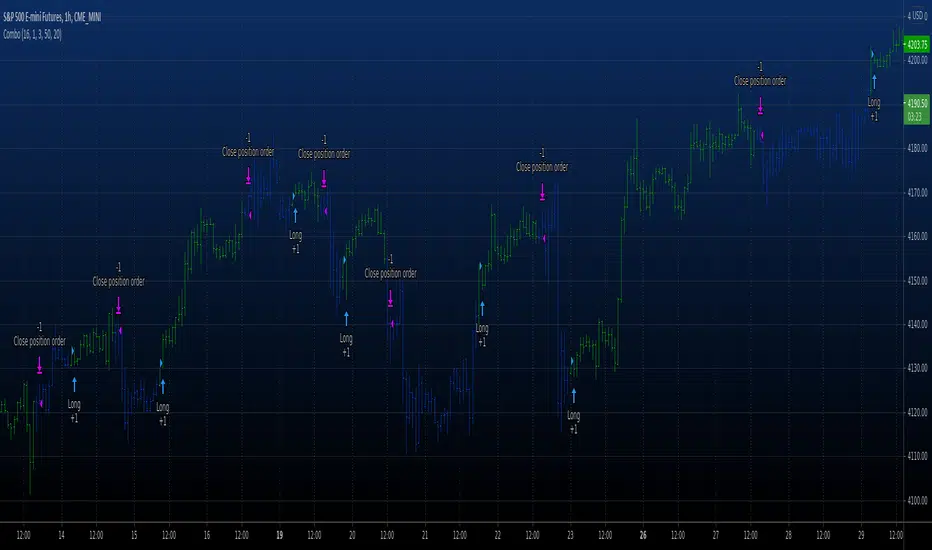
Pivot Reversal Strategy with backtest date rangeThis is standard Pivot Reversal Strategy with backtest date range added.
In parameters you can select from/to date for backtesting range.
在腳本中搜尋"reversal"
Pivot Reversal Strategy - TimeFramedThis is Pivot Reversal Strategy including the time frames for backtesting.
Livermore's One Day ReversalThis is an indicator based on Jessie Livermore's "One Day Reversal" from the book "How to Trade in Stocks" by Richard Smitten.
3-Bar-Reversal-Pattern Strategy Backtest This startegy based on 3-day pattern reversal described in "Are Three-Bar
Patterns Reliable For Stocks" article by Thomas Bulkowski, presented in
January, 2000 issue of Stocks&Commodities magazine.
That pattern conforms to the following rules:
- It uses daily prices, not intraday or weekly prices;
- The middle day of the three-day pattern has the lowest low of the three days, with no ties allowed;
- The last day must have a close above the prior day's high, with no ties allowed;
- Each day must have a nonzero trading range.
Please, use it only for learning or paper trading. Do not for real trading.
Bollinger Band and Moving Average v0.1 by JustUncleLThis is another Bollinger Band strategy+indicator in my series of Bollinger based setups. This one is seems to work best with 5min charts and 20 to 30min expiry. The strategy follows variation of a Bollinger band + Moving Averages
reversal strategy, it uses the 2 moving averages mainly to determine market direction.
Triple Bollinger BandsI found myself using multiple bollinger bands a lot so I decided to add them all to one script and add the ability to adjust them by 0.2. It has helped me by not taking up as much space in the upper left corner as well as improving my in's and outs of trend continuation trades. If you manage to find a double top at +2 or greater deviation, and with a bearish divergence on the RSI as shown in this picture, GO SHORT SON! This was a fast and easy 35 - 40 pips and if you used your fibonacci for an exit you had little doubt of the final result and could have even been prepared for an immediate reversal knowing you were then at an oversold -2.8 deviation. I could go on and on........
Outside Reversal SetUpwww.tradingview.com
This is an outside reversal set up from Frank Ochoa's book Secrets of a Pivot Boss. He recommends using this in confirmation with Pivots but I guess you can play with any other indicator of your choice.
PATTERN PSYCHOLOGY " The power behind this pattern lies in the psychology behind the traders involved in this setup. If you have ever participated in a breakout at support or resistance only to have the market reverse sharply against you, then you are familiar with the market dynamics of this setup .
Basically, market participants are testing the waters above resistance or below support to make sure there is no new business to be done at these levels. When no initiative buyers or sellers participate in range extension, responsive participants have all the information theyneed to reverse price back toward a new area of perceived value."
1-2-3 Reversal Strategy This System was created from the Book "How I Tripled My Money In The
Futures Market" by Ulf Jensen, Page 183. This is reverse type of strategies.
The strategy buys at market, if close price is higher than the previous close
during 2 days and the meaning of 9-days Stochastic Slow Oscillator is lower than 50.
The strategy sells at market, if close price is lower than the previous close price
during 2 days and the meaning of 9-days Stochastic Fast Oscillator is higher than 50.
reversalthis is a simple ema indicator. i specifically set my fast ema to 4 and my slow ema to 13. i only turn on signals after 9;30 am and wait for the ema cross signal to fire once a swing point has been sweeped. i follow the daily. If the daily high has been sweep the previous day and or closed then we are taking highs therefor bullish bias. vice versa for sells. if bullish then only take bullish 4/13 ema cross.THIS CROSS IS MY SIGNAL THAT THERE IS A POTENTIAL CHANGE OF ORDERFLOW, YOU MUST VERIFY THAT THERE IS INDEED A BREAKER BLOCK BEFORE ENTERING. i dont actually just follow a simple ema cross. it means something.
Reversal off EMA-XsEMA-Xs works mostly on Forex due to the small prices and price fluctuations. It does work on Gold, oddly enough, and some others like UKX 100...but mostly on forex. It doesn't work as well on JPY pairs but occasionally does; the JPY pairs give less signals, but when a JPY pair gives a signal, its a high probability setup. Another script EMA-XL works better on the higher priced instruments like S&P, DJI, OIL, BTC etc.
This script will show 3 moving averages: 13, 34, 200 and works on the 5m, 1hr, 4hr, daily charts. Signals "B" or "S" will be on the chart above or below the candles respectively.
When to open:
The script gives buy and sell signals based on a counter-trend move away from the MA's. When the price rises a specific percent above/below the EMA, it'll give a signal. It's best to take a trade when it gives a cluster of consecutive signals near the same price. If using on the 5m, definitely wait for consecutive signals. Also, use this in conjunction with support and resistance areas. Using with fibs for confirmation really makes this a good tool with high probability: IE, when price hits a fib and the script gives a signal, its a high probability setup.
When to close:
1. After a fast move up/down you may use this to counter trade a scalp 10+ pips, but you need to be quick; applies mostly to the 5m chart.
2. If you have the tenacity wait until you see an opposite signal. With this method you may be holding a loosing trade for a while. But what I've noticed is if it trends against you, price usually with come near to the first time it signaled. You may want to stack trades on each cluster of signals. IE first trade is 1000 units, next is 2000 units, etc... then close when prices comes near the first time it signaled. By this time, if you held, you should have profit. This strategy will really test your mental resilience.
3. Wait until it comes back to one of the trendlines; remember this is a counter trend signal so price is moving away from the MA and it always returns to touch one of the MA's...LOL eventually
4. Applying to scalping on the 5m, keep the stops tight because if the instrument trends hard and fast, you'll be upside-down quickly.
If you put a lot of time into using this signal generator, you can really make good profit. But with all tools, you need to master it. There are nuances to the simple logic of this script that can be both fun and frustrating. With all endeavors, if you put the time into it, you will reap the rewards.
Good luck and let me know if you have any questions/comments.
Madrid Moving Average Ribbon (WMA)Madrid Moving Average Ribbon (WMA version)
This indicator visualizes a ribbon of 19 Weighted Moving Averages (WMA), ranging from 5 to 100 periods in 5-step increments. Each WMA is color-coded based on its slope and its position relative to the 100-period WMA, which serves as a baseline.
Color Logic:
LIME: Strong uptrend (rising and above WMA100)
GREEN: Possible recovery (rising but below WMA100)
MAROON: Potential reversal warning (falling but above WMA100)
RED (RUBI): Confirmed downtrend (falling and below WMA100)
GRAY: Neutral or unclear
Use this indicator to quickly evaluate trend direction, strength, and potential reversal zones.
Ideal for trend-following, swing trading, and visual confirmation strategies.
----
Madrid 이동평균 리본 (WMA 버전)
이 인디케이터는 5에서 100까지 5단위로 증가하는 총 19개의 WMA(가중이동평균)를 리본 형태로 시각화합니다.
각 선은 기준선인 WMA100을 중심으로 기울기와 상대적 위치에 따라 색상이 지정됩니다.
색상 의미:
라임색 (LIME): 강한 상승 추세 (상승 중이며 WMA100 위에 위치)
초록색 (GREEN): 반등 가능성 (상승 중이나 WMA100 아래에 위치)
밤색 (MAROON): 하락 반전 경고 (하락 중이지만 WMA100 위에 위치)
빨간색 (RUBI): 명확한 하락 추세 (하락 중이며 WMA100 아래에 위치)
회색 (GRAY): 방향성 불명확 (횡보 또는 모호한 구간)
이 지표는 추세의 방향성과 강도, 그리고 전환 구간을 빠르게 파악할 수 있도록 도와줍니다.
추세 추종, 스윙 트레이딩, 시각적 확인 보조지표로 적합합니다.
Mean Reversion Indictor, Based on Standard Deviations Description:
The Reversal Candle Mean Reversion Indicator is designed for traders seeking to identify potential reversal points in the market based on key price action and volatility. This indicator combines price action analysis (sweeping prior highs or lows) with mean reversion theory, highlighting opportunities where the price tests or touches a moving average's standard deviation bands.
By focusing on these moments of price extremes, the indicator helps traders spot bullish and bearish reversal signals when the price retraces from volatile movements. These conditions often signal a return to the mean—an ideal setup for reversal traders who thrive on fading exaggerated price moves.
How It Works:
1. Price Action Reversal Signal:
* Bullish Reversal: The indicator flags a bullish signal when the current candle's low sweeps the prior candle's low, and the candle closes higher than the prior candle's close.
* Bearish Reversal: The indicator flags a bearish signal when the current candle's high sweeps the prior candle's high, and the candle closes lower than the prior candle's close.
2. Mean Reversion Confirmation:
* Mean Reversion Signal is triggered when the price touches or tests the upper or lower bands, calculated using a user-selected moving average (SMA, EMA, WMA, VWMA, or Hull MA) and standard deviation.
* The indicator combines price action and volatility, providing stronger reversal signals when the price reaches an extreme distance from the moving average.
3. Customization Options:
* Moving Average Type: Choose from SMA, EMA, WMA, VWMA, or Hull MA.
* Moving Average Length: Adjust the length of the moving average (default: 20).
* Standard Deviation Multiplier: Set the number of standard deviations for the volatility bands (default: 2.0).
* Custom Candle Colors: Choose custom colors for bullish and bearish reversal candles to easily spot signals.
How to Use for Trading Reversals:
1. Identify Extremes:
* Watch for candles where the price tests or touches the standard deviation bands. These are key moments when the price has moved significantly from the moving average, indicating a potential overbought or oversold condition.
2. Look for Reversals:
* When the price tests a band and simultaneously forms a bullish reversal pattern (sweeping the prior low and closing higher), it signals a potential mean reversion to the upside.
* When the price tests a band and forms a bearish reversal pattern (sweeping the prior high and closing lower), it signals a potential mean reversion to the downside.
3. Entry Points:
* Long Trades: Enter a long trade after a bullish signal appears (green candle) near the lower band, indicating a likely price reversal back towards the mean.
* Short Trades: Enter a short trade after a bearish signal appears (red candle) near the upper band, indicating a likely price pullback.
4. Exit Strategy:
* Set a profit target at the moving average (the mean) or a specific price level based on your strategy.
* Consider using a trailing stop to capture additional profit in case of a stronger reversal beyond the mean.
5. Risk Management:
* Place stops just below the low of the bullish reversal candle or just above the high of the bearish reversal candle to manage risk efficiently.
Geometric Trend Angle [AstroHub]This script, "Geometric Trend Angle," is designed to identify trend reversals based on the geometric angle of the price chart. Here's a detailed explanation of its originality, functionality, and usage:
Originality and Usefulness:
The uniqueness of this script lies in its approach to trend reversal detection through the calculation of the geometric trend angle. Unlike traditional methods, this script combines the analysis of the angle of the price movement with specific conditions for identifying potential trend reversals.
How it Works:
Length and Trend Angle: The user sets the "Length" parameter, determining the period for calculating the trend angle. The script then computes the trend angle, representing the change in prices over the specified period.
Trend Reversal: The script identifies potential trend reversals when the trend angle changes from positive to negative, and the current closing price is higher than the previous closing price.
Green Reversal: Additionally, the script looks for instances where the trend angle changes from negative to positive, and the current closing price is lower than the previous closing price, indicating a potential reversal to the downside.
Graphical Representation: The script visually highlights the identified reversal points on the chart with labels ("Trend Reversal" and "Green Reversal") and draws a line from the reversal point for better visualization.
Alerts: Traders are alerted to potential trend reversals and green reversals, allowing for timely responses to changing market dynamics.
How to Use:
Apply the script to your TradingView chart.
Customize the "Length" parameter based on your preference and analysis.
Observe the colored candles and graphical elements to identify potential trend reversals.
Pay attention to alerts for timely notifications of reversal signals.
Conclusion:
The "Geometric Trend Angle" script provides a unique perspective on trend reversals, combining geometric angle analysis with specific conditions for improved accuracy. Traders can use it as part of their overall analysis to make informed decisions in the dynamic market environment.
OBV with MA & Bollinger Bands by Marius1032OBV with MA & Bollinger Bands by Marius1032
This script adds customizable moving averages and Bollinger Bands to the classic OBV (On Balance Volume) indicator. It helps identify volume-driven momentum and trend strength.
Features:
OBV-based trend tracking
Optional smoothing: SMA, EMA, RMA, WMA, VWMA
Optional Bollinger Bands with SMA
Potential Combinations and Trading Strategies:
Breakouts: Look for price breakouts from the Bollinger Bands, and confirm with a rising OBV for an uptrend or falling OBV for a downtrend.
Trend Reversals: When the price touches a Bollinger Band, examine the OBV for divergence. A bullish divergence (price lower low, OBV higher low) near the lower band could signal a reversal.
Volume Confirmation: Use OBV to confirm the strength of the trend indicated by Bollinger Bands. For example, if the BBs indicate an uptrend and OBV is also rising, it reinforces the bullish signal.
1. On-Balance Volume (OBV):
Purpose: OBV is a momentum indicator that uses volume flow to predict price movements.
Calculation: Volume is added on up days and subtracted on down days.
Interpretation: Rising OBV suggests potential upward price movement. Falling OBV suggests potential lower prices.
Divergence: Divergence between OBV and price can signal potential trend reversals.
2. Moving Average (MA):
Purpose: Moving Averages smooth price fluctuations and help identify trends.
Combination with OBV: Pairing OBV with MAs helps confirm trends and identify potential reversals. A crossover of the OBV line and its MA can signal a trend reversal or continuation.
3. Bollinger Bands (BB):
Purpose: BBs measure market volatility and help identify potential breakouts and trend reversals.
Structure: They consist of a moving average (typically 20-period) and two standard deviation bands.
Combination with OBV: Combining BBs with OBV allows for a multifaceted approach to market analysis. For example, a stock hitting the lower BB with a rising OBV could indicate accumulation and a potential upward reversal.
Created by: Marius1032
UVR Crypto TrendINDICATOR OVERVIEW: UVR CRYPTO TREND
The UVR Crypto Trend indicator is a custom-built tool designed specifically for cryptocurrency markets, utilizing advanced volatility, momentum, and trend-following techniques. It aims to identify trend reversals and provide buy and sell signals by analyzing multiple factors, such as price volatility(UVR), RSI (Relative Strength Index), CMF (Chaikin Money Flow), and EMA (Exponential Moving Average). The indicator is optimized for CRYPTO MARKETS only.
KEY FEATURES AND HOW IT WORKS
Volatility Analysis with UVR
The UVR (Ultimate Volatility Rate) is a proprietary calculation that measures market volatility by comparing significant price extremes and smoothing the data over time.
Purpose: UVR aims to reduce noise in low-volatility environments and highlight significant movements during higher-volatility periods. While it strives to improve filtering in low-volatility conditions, it does not guarantee perfect performance, making it a balanced and adaptable tool for dynamic markets like cryptocurrency.
HOW UVR (ULTIMATE VOLATILITY RATE) IS CALCULATED
UVR is calculated using a method that ensures precise measurement of market volatility by comparing price extremes across consecutive candles:
Volatility Components:
Two values are calculated to represent potential price fluctuations:
The absolute difference between the current candle's high and the previous candle's low:
Volatility Component 1=∣High−Low ∣
The absolute difference between the previous candle's high and the current candle's low:
Volatility Component 2=∣High −Low∣
Volatility Ratio:
The larger of the two components is selected as the Volatility Ratio, ensuring UVR captures the most significant movement:
Volatility Ratio=max(Volatility Component 1,Volatility Component 2)
Smoothing with SMMA:
To stabilize the volatility calculation, the Volatility Ratio is smoothed using a Smoothed Moving Average (SMMA) over a user-defined period (e.g., 14 candles):
UVR=(UVR(Previous)×(Period−1)+Volatility Ratio)/Period
This calculation ensures UVR adapts dynamically to market conditions, focusing on significant price movements while filtering out noise.
RSI FOR MOMENTUM DETECTION
RSI (Relative Strength Index) identifies overbought and oversold conditions.
Trend Confirmation at the 50 Level
RSI values crossing above 50 signal the potential start of an upward trend.
RSI values crossing below 50 indicate the potential start of a downward trend.
Key Reversals at Extreme Levels
RSI detects trend reversals at overbought (>70) and oversold (<30) levels.
For example:
Overbought Trend Reversal: RSI >70 followed by bearish price action signals a potential downtrend.
Oversold Trend Reversal: RSI <30 with bullish confirmation signals a potential uptrend.
Rare Extreme RSI Readings
Extreme levels, such as RSI <12 (oversold) or RSI >88 (overbought), are used to identify rare yet powerful reversals.
---HOW IT DIFFERS FROM OTHER INDICATORS---
Using UVR High and Low Values
The Ultimate Volatility Rate (UVR) focuses on analyzing the high and low price ranges of the market to measure volatility.
Unlike traditional trend indicators that rely primarily on momentum or moving average crossovers, UVR leverages price extremes to better identify trend reversals.
This approach ensures fewer false signals during low-volatility phases and more accurate trend detection during high-volatility conditions.
UVR as the Core Component
The indicator is fundamentally built around UVR as the primary filter, while supporting tools like RSI (momentum detection), CMF (volume confirmation), and EMA (trend validation) complement its functionality.
By integrating these additional components, the indicator provides a multidimensional analysis rather than relying solely on a single approach.
Dynamic Adaptation to Volatility
UVR dynamically adjusts to market conditions, striving to improve filtering in low-volatility phases. While not flawless, this approach minimizes false signals and adapts more effectively to varying levels of market activity.
Trend Clouds for Visual Guidance
UVR-based dynamic clouds visually mark high and low price areas, highlighting potential consolidation or retracement zones.
These clouds serve as guides for setting stop-loss or take-profit levels, offering clear risk management strategies.
BUY AND SELL SIGNAL LOGIC
BUY CONDITIONS
Momentum-Based Buy-Entry
RSI >50, CMF >0, and the close price is above EMA50.
The price difference between open and close exceeds a threshold based on UVR.
Oversold Reversal
RSI <30 and CMF >0 with a strong bullish candle (close > open and UVR-based sensitivity filter).
Breakout Confirmation
The price breaks above a previously identified resistance, with conditions for RSI and CMF supporting the breakout.
Reversal from Oversold RSI Extreme
RSI <12 on the previous candle with a strong rebound on the current candle with UVR confirmation filter.
SELL CONDITIONS
Momentum-Based Sell-Entry
RSI <50, CMF <0, and the close price is below EMA50.
The price difference between open and close exceeds the UVR threshold.
Overbought Reversal
RSI >70 with bearish price action (open > close and UVR-based sensitivity filter).
Breakdown Confirmation
The price breaks below a previously identified support, with RSI and CMF supporting the breakdown.
Reversal from Overbought RSI Extreme
RSI >88 on the previous candle with a bearish confirmation on the current candle with UVR confirmation filter.
BUY AND SELL SIGNALS VISUALIZATION
The UVR Crypto Trend Indicator visually represents buy and sell conditions using dynamic plots, making it easier for traders to interpret and act on the signals. Below is an explanation of the visual representation:
Buy Signals and Visualization
Signal Trigger:
A buy signal is generated when one of the defined Buy Conditions is met (e.g., RSI >50, CMF >0, price above EMA50).
Visual Representation:
A blue upward arrow appears at the candle where the buy condition is triggered.
A blue cloud forms above the price candles, representing the strength of the bullish trend. The cloud dynamically adapts to market volatility, using the UVR calculation to mark support zones or consolidation levels.
Purpose of the Blue Cloud:
It acts as a visual guide for price movements and stay horizontal when the trend is not moving up
Sell Signals and Visualization
Signal Trigger:
A sell signal is generated when one of the defined Sell Conditions is met (e.g., RSI <50, CMF <0, price below EMA50).
Visual Representation:
A red downward arrow appears at the candle where the sell condition is triggered.
A red cloud forms below the price candles, representing the strength of the bearish trend. Like the blue cloud, it uses the UVR calculation to dynamically mark resistance zones or potential retracement levels.
Purpose of the Red Cloud:
It acts as a visual guide for price movements and stay horizontal when the trend is not moving down.
CONCLUSION
The UVR Crypto Trend indicator provides a powerful tool for trend reversal detection by combining volatility analysis, momentum confirmation, and trend-following techniques. Its unique use of the Ultimate Volatility Rate (UVR) as a core element, supported by proven indicators like RSI, CMF, and EMA, ensures reliable and actionable signals tailored for the crypto market's dynamic nature. By leveraging UVR’s high and low price range analysis, it achieves a level of precision that traditional indicators lack, making it a high-performing system for cryptocurrency traders.
BX-Volume Trend and OscillatorBX-Volume Trend and Oscillator (VTO)
This is my second indicator. I created this indicator for myself. I was inspired by the indicators created by Bjorgum, Duyck and QuantTherapy and decided to create multiple indicators that either work well combined with their indicators or something new that applies some of their indicator concepts. I decided to share this because I believe in learning and earing together as a community. I will later share the rest of the indicators I have created. If you guys have any questions or suggestions write them.
The BX-Volume Trend and Oscillator (VTO) is a comprehensive trading indicator designed to help traders identify trends, momentum shifts, and potential reversals by analyzing volume and price action through various metrics. This indicator combines relative volume analysis with custom Xtrender oscillators and moving averages to provide valuable insights into market behavior.
Image: BX-Volume Trend and Oscillator (VTO)
Features:
Relative Volume Analysis: Measures the current volume relative to the average volume over a specified period, helping traders understand if the current trading activity is unusually high or low.
Short-Term Xtrender Oscillator: This oscillator analyzes the difference between two short-term Exponential Moving Averages (EMAs) and smooths it with a custom RSI, highlighting short-term trends and potential reversal points.
Long-Term Xtrender Oscillator: Similar to the short-term oscillator but uses longer-term EMAs and RSI for identifying more sustained trends and shifts.
T3 Moving Average: A smoothed version of the Xtrender oscillator that helps in detecting trend changes more clearly.
Volume Trend Plot: Shows the smoothed relative volume to understand how trading activity aligns with the trend.
Visual Indicators: Uses colors and shapes to highlight significant changes and trends, such as circles to mark potential reversal points.
How to Use the Indicator
Analyze Relative Volume:
Relative Volume Plot: The smoothed relative volume is displayed in white, helping you assess if current trading volumes are above or below the historical average.
High Relative Volume: Indicates strong trading interest, which could support or contradict the prevailing trend.
Image above: is set to daily timeframe
Monitor Short-Term Xtrender Oscillator
Short-Term Xtrender: Plotted as a column histogram with colors changing from green to red based on the oscillator's movement and momentum. Green and lime colors indicate bullish trends, while maroon and red suggest bearish conditions.
Smoothed Short-Term Xtrender (T3): Plotted as a line that adjusts color based on the short-term Xtrender's trend. The line changes color to match the histogram's color, providing a clearer view of momentum shifts.
Reversal Markers: Small circles indicate potential short-term trend reversals, where changes in the T3 moving average suggest shifts in momentum.
Assess Long-Term Xtrender Oscillator:
Long-Term Xtrender: Plotted as a histogram, with color changes similar to the short-term Xtrender. It shows longer-term trends and shifts.
Color Indicators: Lime and green colors suggest an uptrend, while red and maroon indicate a downtrend.
Look for Zero Line Crossings:
The zero line serves as a reference point. Crossings above the zero line may indicate bullish trends, while crossings below may signal bearish trends.
Image above: is set to daily timeframe, and it showcases the Short-Term Xtrender (T3) applied.
Image above: is set to 8hr timeframe: Using the lower timeframe you can spot better details of pullbacks and potential reversals.
Example of Use:
Identify Trend and Momentum: Use the combination of the short-term and long-term Xtrender oscillators to gauge the prevailing market trend. For instance, if both oscillators are above zero and showing upward momentum, it suggests a strong bullish trend.
Spot Reversals: Observe the short-term Xtrender and its smoothed T3 version. If the T3 line changes direction and crosses through previous peaks and troughs, it could signal a potential reversal.
Volume Confirmation: Check the relative volume and its smoothed version to confirm the strength of price movements. Significant changes in volume can validate the trends indicated by the Xtrender oscillators.
By combining these elements, the BX-Volume Trend and Oscillator (VTO) provides a holistic view of market dynamics, helping traders make more informed decisions based on trend strength, potential reversals, and volume activity.
Lastly, my Scripts/Indicators/Ideas /Systems that I share are only for educational purposes!
Goldmine Wealth Builder - DKK/SKKGoldmine Wealth Builder
Version 1.0
Introduction to Long-Term Investment Strategies: DKK, SKK1 and SKK2
In the dynamic realm of long-term investing, the DKK, SKK1, and SKK2 strategies stand as valuable pillars. These strategies, meticulously designed to assist investors in building robust portfolios, combine the power of Super Trend, RSI (Relative Strength Index), Exponential Moving Averages (EMAs), and their crossovers. By providing clear alerts and buy signals on a daily time frame, they equip users with the tools needed to make well-informed investment decisions and navigate the complexities of the financial markets. These strategies offer a versatile and structured approach to both conservative and aggressive investment, catering to the diverse preferences and objectives of investors.
Each part of this strategy provides a unique perspective and approach to the accumulation of assets, making it a versatile and comprehensive method for investors seeking to optimize their portfolio performance. By diligently applying this multi-faceted approach, investors can make informed decisions and effectively capitalize on potential market opportunities.
DKK Strategy for ETFs and Funds:
The DKK system is a strategy designed for accumulating ETFs and Funds as long-term investments in your portfolio. It simplifies the process of identifying trend reversals and opportune moments to invest in listed ETFs and Funds, particularly during bull markets. Here's a detailed explanation of the DKK system:
Objective: The primary aim of the DKK system is to build a long-term investment portfolio by focusing on ETFs and Funds. It facilitates the identification of stocks that are in the process of reversing their trends, allowing investors to benefit from upward price movements in these financial instruments.
Stock Selection Criteria: The DKK system employs specific criteria for selecting ETFs and Funds:
• 200EMA (Exponential Moving Average): The system monitors whether the prices of ETFs and Funds are consistently below the 200-day Exponential Moving Average. This is considered an indicator of weakness, especially on a daily time frame.
• RSI (Relative Strength Index): The system looks for an RSI value of less than 40. An RSI below 40 is often seen as an indication of a weak or oversold condition in a financial instrument.
Alert Signal: Once the DKK system identifies ETFs and Funds meeting these criteria, it provides an alert signal:
• Red Upside Triangle Sign: This signal is automatically generated on the daily chart of ETFs and Funds. It serves as a clear indicator to investors that it's an opportune time to accumulate these financial instruments for long-term investment.
It's important to note that the DKK system is specifically designed for ETFs and Funds, so it should be applied to these types of investments. Additionally, it's recommended to track index ETFs and specific types of funds, such as REITs (Real Estate Investment Trusts) and INVITs (Infrastructure Investment Trusts), in line with the DKK system's approach. This strategy simplifies the process of identifying investment opportunities within this asset class, particularly during periods of market weakness.
SKK1 Strategy for Conservative Stock Investment:
The SKK 1 system is a stock investment strategy tailored for conservative investors seeking long-term portfolio growth with a focus on stability and prudent decision-making. This strategy is meticulously designed to identify pivotal market trends and stock price movements, allowing investors to make informed choices and capitalize on upward market trends while minimizing risk. Here's a comprehensive overview of the SKK 1 system, emphasizing its suitability for conservative investors:
Objective: The primary objective of the SKK 1 system is to accumulate stocks as long-term investments in your portfolio while prioritizing capital preservation. It offers a disciplined approach to pinpointing potential entry points for stocks, particularly during market corrections and trend reversals, thereby enabling you to actively participate in bullish market phases while adopting a conservative risk management stance.
Stock Selection Criteria: The SKK 1 system employs a stringent set of criteria to select stocks for investment:
• Correction Mode: It identifies stocks that have undergone a correction, signifying a decline in stock prices from their recent highs. This conservative approach emphasizes the importance of seeking stocks with a history of stability.
• 200EMA (Exponential Moving Average): The system diligently analyses daily stock price movements, specifically looking for stocks that have fallen to or below the 200-day Exponential Moving Average. This indicator suggests potential overselling and aligns with a conservative strategy of buying low.
Trend Reversal Confirmation: The SKK 1 system doesn't merely pinpoint stocks in correction mode; it takes an extra step to confirm a trend reversal. It employs the following indicators:
• Short-term Downtrends Reversal: This aspect focuses on identifying the reversal of short-term downtrends in stock prices, observed through the transition of the super trend indicator from the red zone to the green zone. This cautious approach ensures that the trend is genuinely shifting.
• Super Trend Zones: These zones are crucial for assessing whether a stock is in a bullish or bearish trend. The system consistently monitors these zones to confirm a potential trend reversal.
Alert & Buy Signals: When the SKK 1 system identifies stocks that have reached a potential bottom and are on the verge of a trend reversal, it issues vital alert signals, aiding conservative investors in prudent decision-making:
• Orange Upside Triangle Sign: This signal serves as a cautious heads-up, indicating that a stock may be poised for a trend reversal. It advises investors to prepare funds for potential investment without taking undue risks.
• Green Upside Triangle Sign: This is the confirmation of a trend reversal, signifying a robust buy signal. Conservative investors can confidently enter the market at this point, accumulating stocks for a long-term investment, secure in the knowledge that the trend is in their favor.
In summary, the SKK 1 system is a systematic and conservative approach to stock investing. It excels in identifying stocks experiencing corrections and ensures that investors act when there's a strong indication of a trend reversal, all while prioritizing capital preservation and risk management. This strategy empowers conservative investors to navigate the intricacies of the stock market with confidence, providing a calculated and stable path toward long-term portfolio growth.
Note: The SKK1 strategy, known for its conservative approach to stock investment, also provides an option to extend its methodology to ETFs and Funds for those investors who wish to accumulate assets more aggressively. By enabling this feature in the settings, you can harness the SKK1 strategy's careful criteria and signal indicators to accumulate aggressive investments in ETFs and Funds.
This flexible approach acknowledges that even within a conservative strategy, there may be opportunities for more assertive investments in assets like ETFs and Funds. By making use of this option, you can strike a balance between a conservative stance in your stock portfolio while exploring an aggressive approach in other asset classes. It offers the versatility to cater to a variety of investment preferences, ensuring that you can adapt your strategy to suit your financial goals and risk tolerance.
SKK 2 Strategy for Aggressive Stock Investment:
The SKK 2 strategy is designed for those who are determined not to miss significant opportunities within a continuous uptrend and seek a way to enter a trend that doesn't present entry signals through the SKK 1 strategy. While it offers a more aggressive entry approach, it is ideal for individuals willing to take calculated risks to potentially reap substantial long-term rewards. This strategy is particularly suitable for accumulating stocks for aggressive long-term investment. Here's a detailed description of the SKK 2 strategy:
Objective: The primary aim of the SKK 2 strategy is to provide an avenue for investors to identify short-term trend reversals and seize the opportunity to enter stocks during an uptrend, thereby capitalizing on a sustained bull run. It acknowledges that there may not always be clear entry signals through the SKK 1 strategy and offers a more aggressive alternative.
Stock Selection Criteria: The SKK 2 strategy utilizes a specific set of criteria for stock selection:
1. 50EMA (Exponential Moving Average): It targets stocks that are trading below the 50-day Exponential Moving Average. This signals a short-term reversal from the top and indicates that the stock is in a downtrend.
2. RSI (Relative Strength Index): The strategy considers stocks with an RSI of less than 40, which is an indicator of weakness in the stock.
Alert Signals: The SKK 2 strategy provides distinct alert signals that facilitate entry during an aggressive reversal:
• Red Downside Triangle Sign: This signal is triggered when the stock is below the 50EMA and has an RSI of less than 40. It serves as a clear warning of a short-term reversal from the top and a downtrend, displayed on the daily chart.
• Purple Upside Triangle Sign: This sign is generated when a reversal occurs through a bullish candle, and the RSI is greater than 40. It signifies the stock has bottomed out from a short-term downtrend and is now reversing. This purple upside triangle serves as an entry signal on the chart, presenting an attractive opportunity to accumulate stocks during a strong bullish phase, offering a chance to seize a potentially favorable long-term investment.
In essence, the SKK 2 strategy caters to aggressive investors who are willing to take calculated risks to enter stocks during a continuous uptrend. It focuses on identifying short-term reversals and provides well-defined signals for entry. While this strategy is more aggressive in nature, it has the potential to yield substantial rewards for those who are comfortable with a higher level of risk and are looking for opportunities to build a strong long-term portfolio.
Introduction to Strategy Signal Information Chart
This chart provides essential information on strategy signals for DKK, SKK1, and SKK2. By quickly identifying "Buy" and "Alert" signals for each strategy, investors can efficiently gauge market conditions and make informed decisions to optimize their investment portfolios.
In Conclusion
These investment strategies, whether conservative like DKK and SKK1 or more aggressive like SKK2, offer a range of options for investors to navigate the complex world of long-term investments. The combination of Super Trend, RSI, and EMAs with their crossovers provides clear signals on a daily time frame, empowering users to make well-informed decisions and potentially capitalize on market opportunities. Whether you're looking for stability or are ready to embrace more risk, these strategies have something to offer for building and growing your investment portfolio.
RSI of Accumulation/DistributionHow to Use the RSI of Accumulation/Distribution Indicator:
1. Identify Overbought/Oversold Conditions:
Overbought: When the RSI of the ADL is above 70, it indicates that the asset may be overbought and could be due for a pullback or correction.
Oversold: When the RSI of the ADL is below 30, it suggests that the asset may be oversold and could be poised for a rebound.
2. Look for Divergences:
Bullish Divergence: If the price is making lower lows while the RSI of the ADL is making higher lows, it can signal a potential reversal to the upside.
Bearish Divergence: If the price is making higher highs while the RSI of the ADL is making lower highs, it can indicate a potential reversal to the downside.
3. Confirm Trend Strength:
Use the RSI of the ADL to confirm the strength of a trend. For example, if the RSI is consistently above 50 during an uptrend, it suggests strong buying pressure and the trend is likely to continue.
Conversely, if the RSI is consistently below 50 during a downtrend, it indicates strong selling pressure and the trend is likely to persist.
4. Monitor for Reversals:
When the RSI of the ADL crosses above 50, it can signal a potential bullish reversal.
When the RSI of the ADL crosses below 50, it can signal a potential bearish reversal.
Is It Worth It?
The RSI of the Accumulation/Distribution Line can be a valuable tool for traders looking to gain insights into market momentum and trend strength. Here are a few reasons why it might be worth considering:
1. Volume and Price Combination: By combining price action (RSI) with volume-based analysis (ADL), this indicator provides a more comprehensive view of market dynamics.
2. Divergence Detection: It helps identify divergences between price and volume, which can be early signals of potential reversals.
3. Trend Confirmation: It offers additional confirmation of trend strength and potential reversal points, helping traders make more informed decisions.
However, like any indicator, it's important to use it in conjunction with other analysis methods and not rely on it solely for trading decisions. Backtesting the indicator on historical data and combining it with other technical analysis tools can improve its effectiveness.
Feel free to test the script in TradingView and see how it performs in different market conditions. If you have any specific questions or need further assistance, let me know! 😊
Curved Smart Money Concepts Probability (Zeiierman)█ Overview
The Curved Smart Money Concepts Probability indicator, developed by Zeiierman, is a sophisticated trading tool designed to leverage the principles of Smart Money trading. This indicator identifies key market structure points and adapts to changing market conditions, providing traders with actionable insights into market trends and potential reversals. The trading tool stands out due to its unique curved structure and advanced probability features, which enhance its effectiveness and usability for traders.
█ How It Works
The indicator operates by analyzing market data to identify pivotal moments where institutional investors might be influencing price movements. It employs a combination of adaptive trend lengths, multipliers for sensitivity adjustments, and pivot periods to accurately capture market structure shifts. The indicator calculates upper and lower bands based on adaptive sizes and identifies zones of overbought (premium) and oversold (discount) conditions.
Key Features of Probability Calculations
The Curved Smart Money Concepts Probability indicator integrates sophisticated probability calculations to enhance trading decision-making:
Win/Loss Tracking: The indicator tracks the number of successful (win) and unsuccessful (loss) trades based on the identified market structure points (ChoCH, SMS, BMS). This provides a historical context of the indicator's performance.
Probability Percentages: For each market structure point (ChoCH, SMS, BMS), the indicator calculates the probability of the next move being successful or not. This is presented as a percentage, giving traders a quantifiable measure of confidence in the signals.
Dynamic Adaptation: The probability calculations adapt to market conditions by considering the frequency and success rate of the signals, allowing traders to adjust their strategies based on the indicator’s historical accuracy.
Visual Representation: Probabilities are displayed on the chart, helping traders quickly assess the likelihood of future price movements based on past performance.
Key benefits of the Curved Structure
The Curved Smart Money Concepts Probability indicator features a unique curved structure that offers several advantages over traditional linear structures:
Noise Reduction: The curved structure smooths out short-term market fluctuations, reducing the noise often seen in linear structures. This helps traders focus on the true trend direction rather than getting distracted by minor price movements.
Adaptive Sensitivity: The curved structure adjusts its sensitivity based on market conditions. This means it can effectively capture both short-term and long-term trends by dynamically adapting to changes in market volatility, something linear structures struggle with.
Enhanced Trend Detection: By providing a more gradual transition between market phases, the curved structure helps in identifying trends more accurately. This is particularly useful in volatile markets where linear structures might give false signals due to their rigid nature.
Improved Market Structure Analysis: The curved structure's ability to adapt and smooth out irregularities provides a clearer picture of the overall market structure. This clarity is essential for identifying premium and discount zones, as well as mid-range support and resistance levels, which are crucial for effective ICT Smart Money Trading.
█ Terminology
ChoCH (Change of Character): Indicates a potential reversal in market direction. It is identified when the price breaks a significant high or low, suggesting a shift from a bullish to bearish trend or vice versa.
SMS (Smart Money Shift): Represents the transition phase in market structure where smart money begins accumulating or distributing assets. It typically follows a BMS and indicates the start of a new trend.
BMS (Bullish/Bearish Market Structure): Confirms the trend direction. Bullish Market Structure (BMS) confirms an uptrend, while Bearish Market Structure (BMS) confirms a downtrend. It is characterized by a series of higher highs and higher lows (bullish) or lower highs and lower lows (bearish).
Premium: A zone where the price is considered overbought. It is calculated as the upper range of the current market structure and indicates a potential area for selling or shorting.
Mid Range: The midpoint between the high and low of the market structure. It often acts as a support or resistance level, helping traders identify potential reversal or continuation points.
Discount: A zone where the price is considered oversold. It is calculated as the lower range of the current market structure and indicates a potential area for buying or going long.
█ How to Use
Identifying Trends and Reversals: Traders can use the indicator to identify the overall market trend and potential reversal points. By observing the ChoCH, SMS, and BMS signals, traders can gauge whether the market is transitioning into a new trend or continuing the current trend.
Example Strategies
⚪ Trend Following Strategy:
Identify the current market trend using BMS signals.
Enter a trade in the direction of the trend when the price retraces to the mid-range zone.
Set a stop-loss just below the mid-range (for long trades) or above the mid-range (for short trades).
Take profit in the premium/discount zone or when a ChoCH signal indicates a potential reversal.
⚪ Reversal Strategy:
Wait for a ChoCH signal to identify a potential market reversal.
Enter a trade in the direction of the new trend as indicated by the SMS signal.
Set a stop-loss just beyond the recent high (for short trades) or low (for long trades).
Take profit when the price reaches the premium or discount zone opposite to the entry.
█ Settings
Curved Trend Length: Determines the length of the trend used to calculate the adaptive size of the structure. Adjusting this length allows traders to capture either longer-term trends (for smoother curves) or short-term trends (for more reactive curves).
Curved Multiplier: Scales the adjustment factors for the upper and lower bands. Increasing the multiplier widens the bands, reducing sensitivity to price changes. Decreasing it narrows the bands, making the structure more responsive.
Pivot Period: Sets the period for capturing trends. A higher period captures broader trends, while a lower period focuses on short-term trends.
Response Period: Adjusts the structure’s responsiveness. A low value focuses on short-term changes, while a high value smoothens the structure.
Premium/Discount Range: Allows toggling between displaying the active range or previous range to analyze real-time or historical levels.
Structure Candles: Enables the display of curved structure candles on the chart, providing a modified view of price action.
-----------------
Disclaimer
The information contained in my Scripts/Indicators/Ideas/Algos/Systems does not constitute financial advice or a solicitation to buy or sell any securities of any type. I will not accept liability for any loss or damage, including without limitation any loss of profit, which may arise directly or indirectly from the use of or reliance on such information.
All investments involve risk, and the past performance of a security, industry, sector, market, financial product, trading strategy, backtest, or individual's trading does not guarantee future results or returns. Investors are fully responsible for any investment decisions they make. Such decisions should be based solely on an evaluation of their financial circumstances, investment objectives, risk tolerance, and liquidity needs.
My Scripts/Indicators/Ideas/Algos/Systems are only for educational purposes!
Volume Trend Swing Points | viResearchVolume Trend Swing Points | viResearch
Conceptual Foundation and Innovation
The "Volume Trend Swing Points" script is designed to identify pivotal swing points in market trends by leveraging the Price Volume Trend (PVT) indicator. This unique approach combines price and volume movements to highlight moments when a market may experience a significant trend reversal. By detecting the highest and lowest points of the PVT over customizable periods, this script aims to provide traders with valuable insights into potential bullish or bearish market behavior.
The simplicity of the script, combined with its use of the PVT, offers an effective way for traders to anticipate key market swings based on both price and volume momentum.
Technical Composition and Calculation
The core of the "Volume Trend Swing Points" script is built around the Price Volume Trend (PVT) indicator, which adjusts price changes according to trading volume. The script focuses on identifying the highest and lowest values of the PVT over user-defined lookback periods:
Price Volume Trend (PVT): The PVT is used to calculate the momentum of price movements, taking volume into account. By incorporating both price and volume, the PVT offers a more dynamic and responsive indicator of trend direction compared to price alone.
Swing Point Detection: The script identifies the highest and lowest PVT values over user-defined lookback periods (x for highs and y for lows). When the current PVT matches either the highest or lowest value, it signals a potential trend reversal or continuation, depending on whether the high or low is detected.
Entry and Exit Signals: A long signal (bullish) is generated when the current PVT matches the highest value over the lookback period, while a short signal (bearish) is generated when the current PVT matches the lowest value. These signals can be visualized with alerts and background colors.
Features and User Inputs
The "Volume Trend Swing Points" script allows traders to customize several parameters to better suit their trading strategies and market conditions:
Lookback Periods (x and y): The script allows for two customizable lookback periods—one for detecting the highest PVT and another for the lowest. Adjusting these values can help refine the sensitivity of the swing points.
Bar Coloring: The script includes an optional setting to color the bars based on detected bullish or bearish trends, making it easier to visualize potential market shifts.
Background Colors: The background color changes dynamically based on whether a high or low swing point is detected, providing traders with a clear visual indication of potential trend reversals.
Alerts: The script includes alert conditions for both long and short signals, enabling traders to set notifications for when potential swing points are detected.
Practical Applications
The "Volume Trend Swing Points" script is ideal for traders who focus on price and volume dynamics when making trading decisions. Its application is particularly useful in the following scenarios:
Detecting Trend Reversals: By identifying the highest and lowest PVT values over a given period, the script can help traders spot potential reversal points, allowing for more timely entries or exits.
Confirming Trend Continuations: When the PVT continues to match the highest or lowest values, it may indicate that the trend is likely to continue, helping traders maintain their positions with greater confidence.
Volume-Based Trend Analysis: Since the script uses the PVT, it is particularly effective in markets where volume plays a significant role in driving price movements, offering insights that go beyond simple price-based indicators.
Advantages and Strategic Value
This script enhances traditional trend analysis by incorporating both price and volume through the PVT, providing a more comprehensive view of market momentum. The customizable lookback periods allow traders to adapt the script to different assets and timeframes, making it a versatile tool for swing trading and trend-following strategies.
The visual cues provided by bar coloring and background shading help traders quickly identify potential market shifts, improving decision-making speed and accuracy.
Summary and Usage Tips
The "Volume Trend Swing Points" script is a straightforward yet powerful tool for identifying market reversals and trend continuations based on both price and volume. By adjusting the lookback periods, traders can fine-tune the script to better suit their trading style and the assets they are monitoring. The visual and alert features further enhance the script's usability, making it easy to incorporate into a trading strategy.
Remember to backtest the script across various market conditions to better understand its performance. Past performance is not necessarily indicative of future results, so using this script in conjunction with other technical tools is recommended for optimal decision-making.