One Trading Setup for Life ICT [TradingFinder] Sweep Session FVG🔵 Introduction
ICT One Trading Setup for Life is a trading strategy based on liquidity and market structure shifts, utilizing the PM Session Sweep to determine price direction. In this strategy, the market first forms a price range during the PM Session (from 13:30 to 16:00 EST), which includes the highest high (PM Session High) and lowest low (PM Session Low).
In the next session, the price first touches one of these levels to trigger a Liquidity Hunt before confirming its trend by breaking the Change in State of Delivery (CISD) Level. After this confirmation, the price retraces toward a Fair Value Gap (FVG) or Order Block (OB), which serve as the best entry points in alignment with liquidity.
In financial markets, liquidity is the primary driver of price movement, and major market participants such as institutional investors and banks are constantly seeking liquidity at key levels. This process, known as Liquidity Hunt or Liquidity Sweep, occurs when the price reaches an area with a high concentration of orders, absorbs liquidity, and then reverses direction.
In this setup, the PM Session range acts as a trading framework, where its highs and lows function as key liquidity zones that influence the next session’s price movement. After the New York market opens at 9:30 EST, the price initially breaks one of these levels to capture liquidity.
However, for a trend shift to be confirmed, the CISD Level must be broken.
Once the CISD Level is breached, the price retraces toward an FVG or OB, which serve as optimal trade entry points.
Bullish Setup :
Bearish Setup :
🔵 How to Use
In this strategy, the PM Session range is first identified, which includes the highest high (PM Session High) and lowest low (PM Session Low) between 13:30 and 16:00 EST. In the following session, the price touches one of these levels for a Liquidity Hunt, followed by a break of the Change in State of Delivery (CISD) Level. The price then retraces toward a Fair Value Gap (FVG) or Order Block (OB), creating a trading opportunity.
This process can occur in two scenarios : bearish and bullish setups.
🟣 Bullish Setup
In a bullish scenario, the PM Session High and PM Session Low are identified. In the following session, the price first breaks the PM Session Low, absorbing liquidity. This process results in a Fake Breakout to the downside, misleading retail traders into taking short positions.
After the Liquidity Hunt, the CISD Level is broken, confirming a trend reversal. The price then retraces toward an FVG or OB, offering an optimal long entry opportunity.
The initial take-profit target is the PM Session High, but if higher timeframe liquidity levels exist, extended targets can be set.
The stop-loss should be placed below the Fake Breakout low or the first candle of the FVG.
🟣 Bearish Setup
In a bearish scenario, the market first defines its PM Session High and PM Session Low. In the next session, the price initially breaks the PM Session High, triggering a Liquidity Hunt. This movement often causes a Fake Breakout, misleading retail traders into taking incorrect positions.
After absorbing liquidity, the CISD Level breaks, indicating a shift in market structure. The price then retraces toward an FVG or OB, offering the best short entry opportunity.
The initial take-profit target is the PM Session Low, but if additional liquidity exists on higher timeframes, lower targets can be considered.
The stop-loss should be placed above the Fake Breakout high or the first candle of the FVG.
🔵 Setting
CISD Bar Back Check : The Bar Back Check option enables traders to specify the number of past candles checked for identifying the CISD Level, enhancing CISD Level accuracy on the chart.
Order Block Validity : The number of candles that determine the validity of an Order Block.
FVG Validity : The duration for which a Fair Value Gap remains valid.
CISD Level Validity : The duration for which a CISD Level remains valid after being broken.
New York PM Session : Defines the PM Session range from 13:30 to 16:00 EST.
New York AM Session : Defines the AM Session range from 9:30 to 16:00 EST.
Refine Order Block : Enables finer adjustments to Order Block levels for more accurate price responses.
Mitigation Level OB : Allows users to set specific reaction points within an Order Block, including: Proximal: Closest level to the current price. 50% OB: Midpoint of the Order Block. Distal: Farthest level from the current price.
FVG Filter : The Judas Swing indicator includes a filter for Fair Value Gap (FVG), allowing different filtering based on FVG width: FVG Filter Type: Can be set to "Very Aggressive," "Aggressive," "Defensive," or "Very Defensive." Higher defensiveness narrows the FVG width, focusing on narrower gaps.
Mitigation Level FVG : Like the Order Block, you can set price reaction levels for FVG with options such as Proximal, 50% OB, and Distal.
Demand Order Block : Enables or disables bullish Order Block.
Supply Order Block : Enables or disables bearish Order Blocks.
Demand FVG : Enables or disables bullish FVG.
Supply FVG : Enables or disables bearish FVGs.
Show All CISD : Enables or disables the display of all CISD Levels.
Show High CISD : Enables or disables high CISD levels.
Show Low CISD : Enables or disables low CISD levels.
🔵 Conclusion
The ICT One Trading Setup for Life is a liquidity-based strategy that leverages market structure shifts and precise entry points to identify high-probability trade opportunities. By focusing on PM Session High and PM Session Low, this setup first captures liquidity at these levels and then confirms trend shifts with a break of the Change in State of Delivery (CISD) Level.
Entering a trade after a retracement to an FVG or OB allows traders to position themselves at optimal liquidity levels, ensuring high reward-to-risk trades. When used in conjunction with higher timeframe bias, order flow, and liquidity analysis, this strategy can become one of the most effective trading methods within the ICT Concept framework.
Successful execution of this setup requires risk management, patience, and a deep understanding of liquidity dynamics. Traders can enhance their confidence in this strategy by conducting extensive backtesting and analyzing past market data to optimize their approach for different assets.
在腳本中搜尋"reversal"

Three-Bar Reversal SignalThis indicator is a simple setup of Three Bar Reversal. Logic of the code is as below.
Rules :
Long Setup
Bar 1 closes down
Low of Bar 2 is below the low of Bar 1 (and Bar 3)
Bar 3 closes above the high of both Bar 1 and Bar 2
Buy at the close of Bar 3
Short Setup
Bar 1 closes up
High of Bar 2 is above the high of Bar 1 (and Bar 3)
Bar 3 closes below the low of both Bar 1 and Bar 2
Sell at the close of Bar 3

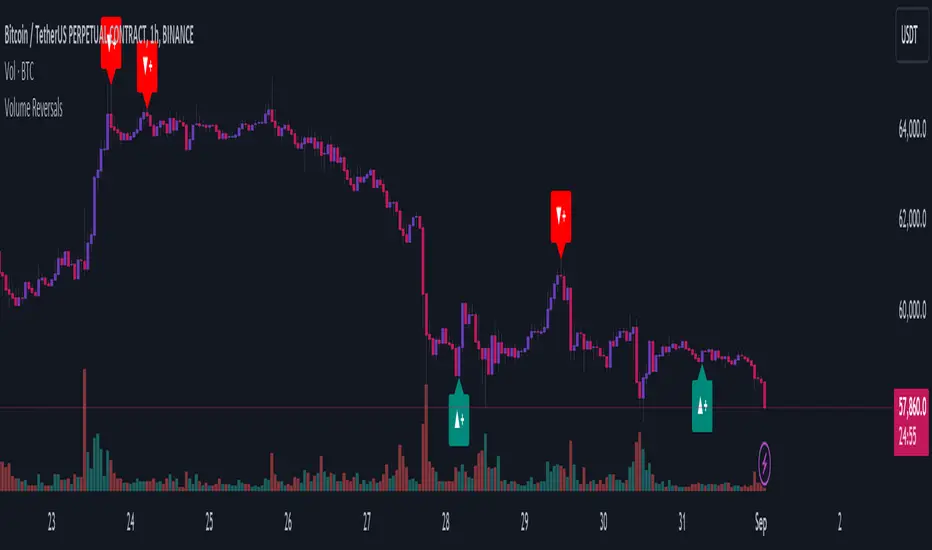
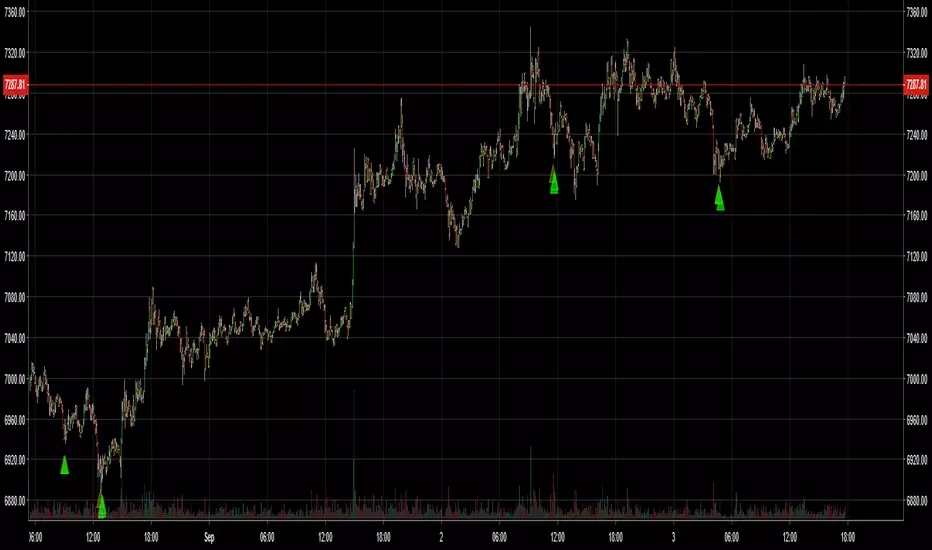
Volume ReversalsThe "Volume Reversals" indicator is a trading tool designed to identify potential buy and sell signals based on volume patterns.
Features
Filter Signals : Traders can enable or disable additional filtering of signals, which refines the conditions under which buy and sell labels are displayed.
Buy and Sell Labels: The indicator dynamically places labels on the chart to signify buy ("▲+") and sell ("▼+") opportunities. Buy labels appear at low points of bars with a green upward-pointing arrow, while sell labels appear at high points with a red downward-pointing arrow.
Customizable Alerts: Users can set alerts for buy and sell signals, receiving notifications when conditions match predefined patterns.
Logic Explained
Volume Comparison: The script examines a sequence of the last five volume bars to detect increasing or decreasing trends.
Price Action Analysis: Each volume bar is paired with a corresponding price action (bullish or bearish) from the same period.
Signal Conditions: A signal is generated under two scenarios:
Normal Conditions: Sequential increase/decrease in volume over three bars accompanied by bearish/bullish price action, followed by a dip in volume with a bullish/bearish bar.
Filtered Conditions (if filter is active): Requires all last four bars to be bearish/bullish, the most recent bar's volume to be less than the immediate previous, and then exceeds the volume two bars prior, closing bullish/bearish.
This indicator is suited for various assets and timeframes, especially in markets where volume plays a significant role in price dynamics.
Crypto Realized Profits/Losses Extremes [AlgoAlpha]🌟🚀 Introducing the Crypto Realized Profits/Losses Extremes Indicator by AlgoAlpha 🚀🌟
Unlock the potential of cryptocurrency markets with our cutting-edge On-Chain Pine Script™ indicator, designed to highlight extreme realized profit and loss zones! 🎯📈
Key Features:
✨ Realized Profits/Losses Calculation: Uses real-time data from the blockchain to monitor profit and loss realization events.
📊 Multi-Crypto Compatibility: The Indicator is compatible on other Crypto tickers besides Bitcoin.
⚙️ Customizable Sensitivity: Adjust the look-back period, normalization period, and deviation thresholds to tailor the indicator to your trading style.
🎨 Visual Enhancements: Choose from a variety of colors for up and down trends, and toggle extreme profit/loss overlay for easy viewing.
🔔 Integrated Alerts: Set up alerts for high and extreme profit or loss conditions, helping you stay ahead of significant market movements.
🔍 How to Use:
🛠 Add the Indicator: Add the indicator to favorites. Customize settings like period lengths and deviation thresholds according to your needs.
📊 Market Analysis: Monitor the main oscillator and the bands to understand current profit and loss extremes in the market. When the oscillator is at the upper band, this means that the market is doing really well and traders/investors will be likely to take profit and cause a reversal. The opposite is true when the oscillator reaches the lower band. The main oscillator can also be used for trend analysis.
🔔 Set Alerts: Configure alerts to notify you when the market enters a zone of high profit or loss, or during trend changes, enabling timely decisions without constant monitoring.
How It Works:
The indicator calculates a normalized area under the RSI curve applied on on-chain data regarding the number of wallets in profit. It employs a custom "src" variable that aggregates data from the blockchain about profit and loss addresses, adapting to intraday or longer timeframes as needed. The main oscillator plots this normalized area, while the upper and lower bands are plotted based on a deviation metric to identify extreme conditions. Colored fills between these bands visually denote these zones. For interaction, the indicator plots bubbles for extreme profits or losses and provides optional bar coloring to reflect the current market trend.
🚀💹 Enjoy a comprehensive, customizable, and visually engaging tool that helps you stay ahead in the fast-paced crypto market!

Catching Trend Reversals by shorting tops and buying bottomsHOLP (High of the low period) and LOHP (Low of the high period)
Catching Trend Reversals by shorting tops and buying bottoms
using this Swing High/Low Indicator
Trading Strategy comes from Mastering the Trade, by John Carter pg 300.
Trading Rules for Sells, Buys are reversed
1. Identifying a trending market, where today's price is making a 20-day high (17-18 day highs are also fine)
Note this is configurable by setting the trending period variable (defaults to 20)
For example if price is making a 20 period high or 20 period low, it will show a triangle up/down above the candle.
2. Identify the high bar in the uptrend
3. Go short once the price action closes below the low of this high bar
4. The initial stop is the high of the high bar.
5. If you are in the trade on the third day or period, use a 2 bar trailing stop.
You can check 2-bar trailing stop to draw the line, defaults to off.
Stop is indicated by the white dot.
Code Converted from TradeStation EasyLanguage
I can't find the original source anymore for the swing high/low plots, but if someone knows,
let me know and I'll credit here.

Fibonacci Ranges (Real-Time) [LuxAlgo]The "Fibonacci Ranges" indicator combines Fibonacci ratio-derived ranges (channels), together with a Fibonacci pattern of the latest swing high/low.
🔶 USAGE
The indicator draws real-time ranges based on Fibonacci ratios as well as retracements. Breakouts from a Fibonacci Channel are also indicated by labels, indicating a potential reversal.
Each range extremity/area can also be used as support/resistance.
🔶 CONCEPTS
Fibonacci Channels
Latest Fibonacci
Both, Latest Fibonacci and Fibonacci Channels , display different Fibonacci levels (labels not included in the code):
However, the 2 react in a totally different way.
🔹 Fibonacci Channels
2 conditions must be fulfilled until a Fibonacci Channel is displayed:
New swing high/low
close has to be between chosen limits/levels ( Break level )
As visual guidance, chosen Break levels are accentuated by 2 small gray blocks:
Once the channel is displayed, it will remain visible until x consecutive bars break out of the chosen Break level at closing time.
• x consecutive bars is set by Break count .
The amount of breaks is counted in the code. When the price, without breaking the user-set limit, closes back between the 2 levels, the count is reset to 0.
By enabling Channels and Shadows you can see previous channels (" Shadows ", which is always delayed with 1 bar)
Previous channels can be helpful in finding potential support/resistance areas, especially from large channel blocks
The more narrow Break levels are set the less chance the price closes between these 2 levels, and the quicker close breaks out.
In other words, narrow levels give fewer & smaller channels, broader levels give more & larger channels.
Note:
• swing settings: L & R
• Break count (x consecutive bars that close outside chosen levels to invalidate the Fibonacci Channel )
will also be of influence in displaying the channels.
• Show breaks enable you to visualize signals when there is a break:
• Alerts can also be set ( Break Down / Break Up )
🔹 Latest Fibonacci
This displays the Fibonacci levels between the latest swing high and swing low, independently from the Fibonacci Channel .
The Lastest Fibonacci can be helpful in detecting the current trend against the larger Fibonacci Channel .
🔶 SETTINGS
🔹 Swing Settings
L: set left of pivothigh / pivotlow
R: set right of pivothigh / pivotlow
🔹 Fibonacci Channels
Channel : Channel / Channels + Shadows / None
Break level
-0.382 - 1.382
0.000 - 1.000
0.236 - 0.764
0.382 - 0.618
Break count
🔹 Fibonacci
Toggle
Colours: [ -0.382 - 0 ], [ 0.236 - 0.382 ], [ 0.5 ], [ 0.618 - 0.764 ], [ 1 - 1.382 ]

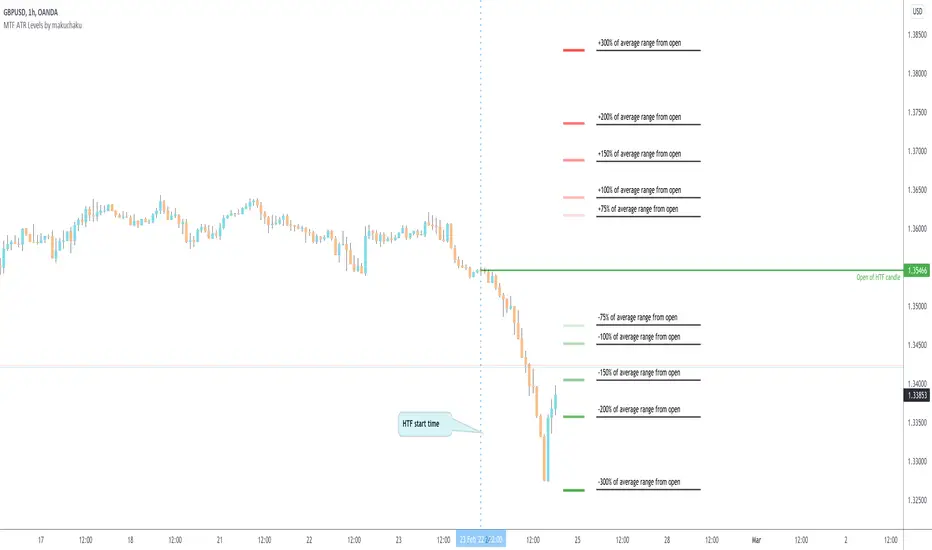
MTF ATR Levels by makuchakuKnowing how big a range one is operating in (from a higher time frame perspective) is very important to understand where the reversals could potentially come from.
This indicator uses the closing price of previous HTF candle and plots its ATR range - and several levels on top of it.
+/- 75%
+/- 100%
+/- 150%
+/- 200%
+/- 300%
Consecutive Color Reversal for Binary Option TradingThis indicator is only for Binary Option trading. It alerts when a specific number of consecutive same color candlesticks are generated and it signals for a reversal. As an example, when it signals "Long", a long trade should be opened for a few of next candlesticks (upto 2 to 3 candles).

Adjustable MA & Alternating Extremities [LuxAlgo]Returns a moving average allowing the user to control the amount of lag as well as the amplitude of its overshoots thanks to a parametric kernel. The indicator displays alternating extremities and aims to provide potential points where price might reverse.
Due to user requests, we added the option to display the moving average as candles instead of a solid line.
Settings
Length: MA period, refers to the number of most recent data points to use for its calculation.
Mult: Multiplicative factor for each extremity.
As Smoothed Candles: Allows the user to show the MA as a series of candles instead of a solid line.
Show Alternating Extremities : Determines whether to display the alternating extremities or not.
Lag: Controls the amount of lag of the MA, with higher values returning a MA with more lag.
Overshoot: Controls the amplitude of the overshoots returned by the MA, with higher values increasing the amplitude of the overshoots.
Usage
Moving averages using parametric kernels allows users to have more control over characteristics such as lag or smoothness; this can greatly benefit the analyst. A moving average with reduced lag can be used as a leading moving average in a MA crossover system, while lag will benefit moving averages used as slow MA in a crossover system.
Increasing 'Lag' will increase smoothness while increasing 'overshoot' will reduce lag.
The following indicator puts more emphasis on its alternating extremities, an upper extremity will be shown once the high price crosses the upper extremity, while a low extremity will be shown once the low price crosses the lower extremity. These can be interpreted like extremities of a band indicator.
The MA using a length value of 200 with a multiplicative factor of 1.
In general, extremities will effectively return points where price might potentially bounce in ranging markets while closing prices under trending markets will often be found above an upper extremity and under a lower extremity.
Reducing the lag of the moving average allows the user to obtain a more timely estimate of the underlying trend in the price, with a better fit overall. This allows the user to obtain potentially pertinent extremities where price might reverse upon a break, even under trending markets.
In the above chart, the price initially breaks the upper extremity, however, we can observe that the upper extremity eventually reaches back the price, goes above it, provides a resistance, and effectively indicates a reversal.
Users can plot candles from the moving average, these are fairly similar to heikin-ashi candles in the sense that CandleOpen(t) ≠ CandleClose(t-1) , each point of the candle is calculated as follows for our indicator:
Open = Average between MA(t-1) and MA(t-2)
High = MA using the high price as input
Low = MA using the low price as input
Close = MA using the closing price as input
Details
Lag is defined as the effect of moving averages to reflect past price variations instead of new ones, lag can be observed by the user and is the main cause of false signals. Lag is proportional to the degree of filtering returned by the moving average.
Overshooting is a common effect encountered in non-lagging moving averages, and is defined as the tendency of a moving average to exceed a maximum level (or minimum level, which can be defined as undershooting )
MA and rolling maximum/minimum, both using a length of 50 bars. While we can think of lag as a cost of smoothness, we can think of overshooting as a cost for reduced lag on some occasions.
Explaining the kernel design behind our moving average requires understanding of the logic behind lag reduction in moving averages. This can prove to be complex for non informed users, but let's just focus on the simpler part; moving averages can be defined as a weighted sum between past prices and a set of coefficients (kernel).
MA(t) = b(0)C(t) + b(1)C(t-1) + b(2)C(t-2) + ... + b(n-1)C(t-n-1)
Where n is the period of the moving average. Lag is (non optimally) reduced by "underweighting" past prices - that is multiplying them by negative numbers.
The kernel used in our moving average is based on a modified sinewave. A weighted sum making use of a sinewave as a kernel would return an oscillator centered at 0. We can divide this sinewave by an increasing linear function in order to obtain a kernel allowing us to obtain a low lag moving average instead of a centered oscillator. This is the main idea in the design of the kernel used by our moving average.
The kernel equation of our moving average is:
sin(2πx^α)(1 - x^β)
With 1>x>0 , and where α controls the lag, while β controls the overshoot amplitude.
Using this equation we can obtain the following kernels:
Here only α is changed, while β is equal to 1. Values to the left would represent the coefficients for the most recent prices. Notice how the most significant coefficients are given to the oldest prices in the case where α increases.
Higher overshoot would require more negative values, this is controlled by β
Here only β is changed, while α is equal to 1. Notice how higher values return lower negative coefficients. This effectively increases the overshoots amplitude in our moving average. We can decrease α in order for these negative coefficients to underweight more recent values.
Using α = 0 allows us to simplify the kernel equation to:
1 - x^β
Using this kernel we can obtain more classical moving averages, this can be seen from the following results:
Using β = 1 allows us to obtain a linearly decreasing kernel (the one of a WMA), while increasing allows the kernel to converge toward a rectangular kernel (the one of SMA).

[TrustedSignals] Oscillator DivergencesDivergences are powerful tools that assess the price momentum and the likelihood of a price reversal. A positive divergence occurs when the price of an asset makes a new low while an oscillator, starts to climb. Conversely, a negative divergence is when the price makes a new high but the oscillator analyzed makes a lower high.
Once again, with the idea of providing an All-in-One indicator, this script can display the Divergences in up to 9 most used oscillators (RSI, Stochastic RSI, Stochastic, Williams%, MFI, ChangeMO, CCI, BB %B) including our own branded no-lag ‘ TS Oscillator ’
We have also included an optional custom no-lag smoothing function, that allows the user to smooth out the noise on all the oscillators and increase their accuracy, without delaying the actual data. This feature can be turned off if necessary and the smoothing length can be manually adjusted.
After the user selects from the first input the desired oscillator, the indicator can display Regular and Hidden Divergences on the chart.
The lookback period of the divergences is also fully configurable, as the settings for each of our individual oscillators.

CuandoCrypto's Swing Trade IndicatorThis indicator combines RSI, MACD, Williams %R and Z-Score to determine if there's a high probability of an imminent trend reversal. This indicator is best used on higher timeframes.
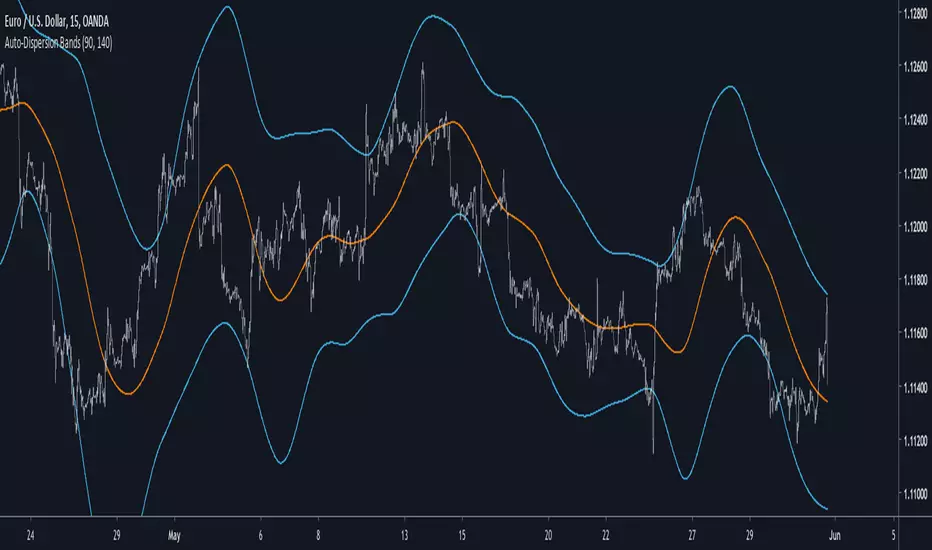
Auto-Dispersion BandsIntroduction
A really old indicator as well, thus i have no much ideas of what is going on with it, but i know that those bands returns good reversals points. The indicator don't use standard deviation, instead its a simple differencing of the price and the price length bars back who will provide a dispersion measurement, thus the name auto-dispersion.
The Indicator
The smooth parameter allow the band to cross the price, if smooth is low the chance of crosses are lower.
smooth = 3
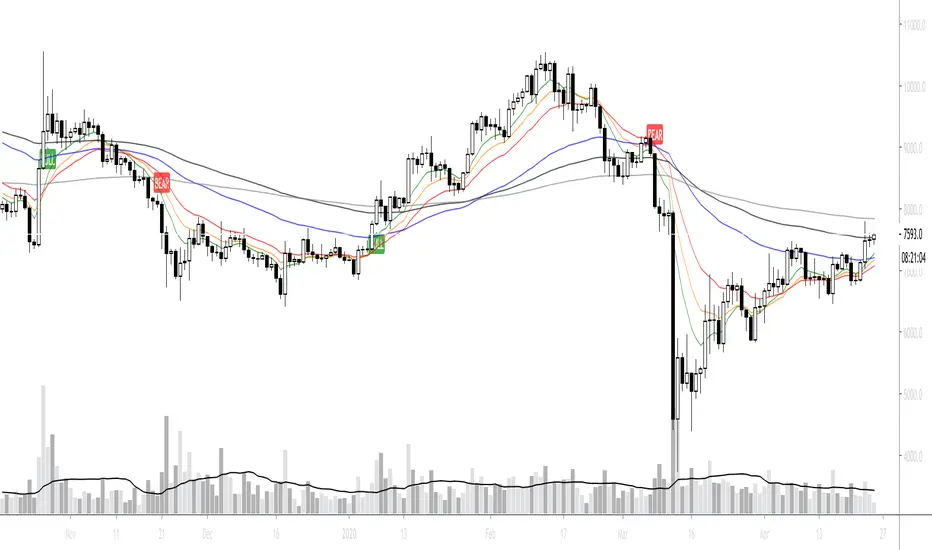
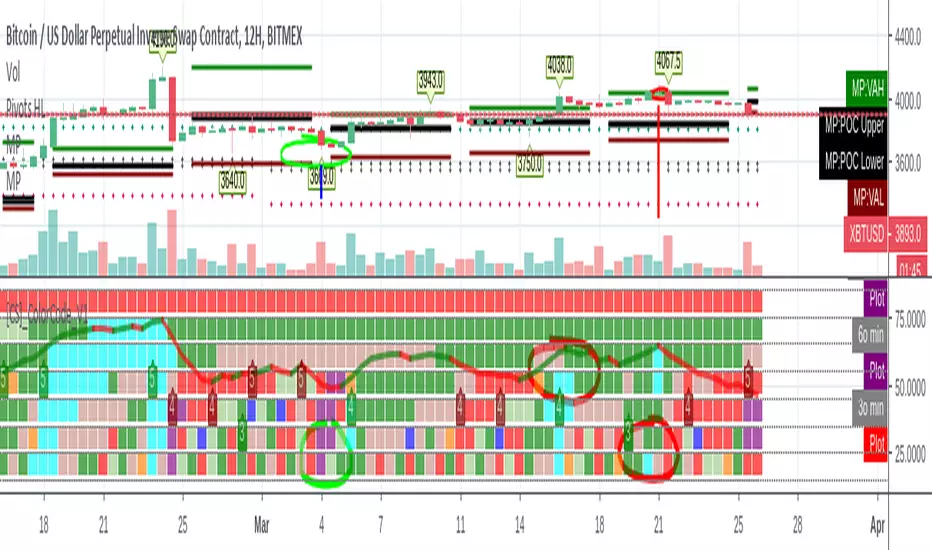
[CS]_ColorCode_V1 Multitimeframe Cardwell ReversalsToday I decided to create a powerful indicator for helping in identifying trend continuation and reversals using Cardwell's famous techniques.
For the whom interested Cardwell's work is widely presented in different textbooks such as "John Hayden" The Complete RSI Guide and accessible online.
From "John Hayden" The Complete RSI Guide:
Wilder (Author of RSI) states in his opinion that the greatest value of the RSI is in pointing out a divergence between the graphs for the RSI and price behavior. Their graphical behavior reveals a bullish divergence (or as he calls
it a bottom failure swing) when the price makes a new low, while the RSI continues under 30 and fails to make a new low. When the RSI proceeds to exceed the previous RSI peak, a short-term buy signal occurs
according to Wilder.
However, what the average investor comprehends is a small part of the dynamic overall picture. For example, if the range effectively shifts in a bull market so
that 80 is overbought, then Andrew Cardwell realized that the support level must also shift. Inversely if the oversold level in a bear market will shift down to 20, then the resistance level in a bear market must also
shift.
Another tools I prefer to use to indicate trend is moving averages, the standard workhorse used by most technical traders. Moving averages are valuable, as they will remove the volatility from whatever they are
calculated from. For example, calculating a moving average based on the RSI, effectively removes the volatility and gives a smoother signal. In fact, the trend can be confirmed by calculating a 9 period simple
moving average and a second 45 period weighted moving average on both the RSI and price.
From Cardwell's famous RSI Workbook, when the:
1. The 9 period on price is above the 45 period on price, and The 9 period on RSI is above the 45 period on RSI the trend is up.
2. The 9 period on price is below the 45 period on price, and The 9 period on RSI is below the 45 period on RSI the trend is down.
3. The 9 period on price is above the 45 period on price, and The 9 period on RSI is below the 45 period on RSI the trend is sideways to up.
4. The 9 period on price is below the 45 period on price, and The 9 period on RSI is above the 45 period on RSI the trend is sideways to down.
Since the RSI is more volatile than the price, the 9 period simple moving average (SMA) on RSI will cross its respective 45 period weighted moving average (WMA) before the 9 period (SMA) on price will cross its
respective 45 period moving average. I place more emphasis on the moving averages based on price than those based on RSI. Staying aware of what the moving averages are doing will help you to stay focused on
the overall trend. When I am talking to another trader, I will often say that the moving average on price is positive.
This implies that the short term, 9 period SMA is, above the longer term, 45 WMA. The largest moves will frequently come when both moving averages are moving in the same direction. One more thought on
moving averages. You will find the moving average 45 WMA will prove to be support or resistance on both price and RSI. For example, you will often see a bullish market retrace to its respective 45 period
moving average (price and/or RSI). When this is observed it is another sign of what the trend actually is.
On the indicator:
1. is represented in Green Color
2. is represented in Red Color
3. is represented in Light-Green-Grey
4. is represented in Light-Pink-Grey
1. + Overbought (RSI Above 80) is represented in Acqua
2. + Oversold (RSI Below 20) is represented in Purple
1. + RSI Turned Bearish (RSI Below 50) is represented in Orange
2. + RSI Turned Bullish (RSI Above 50) is represented in Blue
In Addition a counter is displayed about the positives or negatives timeframes and an average line is computed across timeframes with green / red color comparison.
Timeframes are specified in the indicator panel and are the following:
- Weekly
- Daily
- 12h
- 4h
- 2h
- 1h
- 30 min
Enjoy,
CryptoStatistical
MidnightMouse Bounce FestIdentifies areas with highly oversold conditions, leading to a high probability of a bounce or trend reversal. Does not include sell signals.
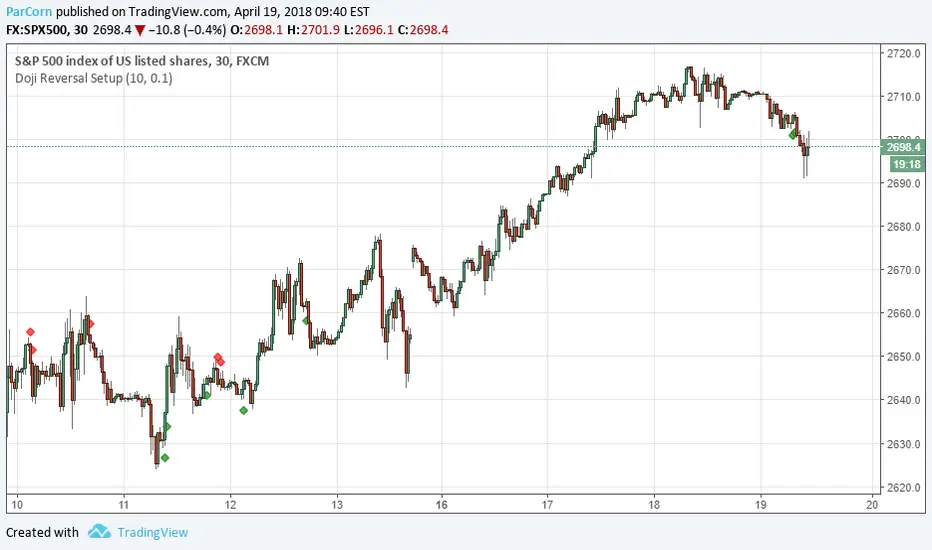
PivotBoss Doji Reversal SetupPATTERN SUMMARY
1. The open and close price of the doji should fall within 10 percent of each other, as measured by the total range
of the candlestick.
2. For a bullish doji, the high of the doji candlestick should be below the ten-period simple moving average (H <
SMA(lO)).
3. For a bearish doji, the low of the doji candlestick should be above the ten-period simple moving average (L >
SMA(lO)).
4. For a bearish doji, one of the two bars following the doji must close beneath the low of the doji (C < L or C <
L ).
5. For a bullish doji setup, one of the two bars following the doji must close above the high of the doji (C > H )
or C > H )
PATTERN PSYCHOLOGY
The doji candlestick is the epitome of indecision. The pattern illustrates a virtual stalemate between buyers
and sellers, which means the existing trend may be on the verge of a reversal. If buyers have been controlling a
bullish advance over a period of time, you will typically see full-bodied candlesticks that personify the bullish
nature of the move. However, if a doji candlestick suddenly appears, the indication is that buyers are suddenly
not as confident in upside price potential as they once were. This is clearly a point of indecision, as buyers are no
longer pushing price to higher valuation, and have allowed sellers to battle them to a draw-at least for this one
candlestick. This leads to profit taking, as buyers begin to sell their profitable long positions, which is heightened
by responsive sellers entering the market due to perceived overvaluation. This "double whammy" of selling
pressure essentially pushes price lower, as responsive sellers take control of the market and push price back
toward fair value.
Keltner Channel with auto highlighting of Bear/Bull reversals*** New version @ ****
All options configurable.
Reversals are marked using crosses. as well as highlighted using green/red color (depending on bull/bear). Enjoy!

The Ultimate Smart Money AQP + Reversal + Risk-Reward DashboardKEY FEATURES
Add. Analyze. Execute.
The Smart Money Way.
#AQUNAT_PRICE
#AQUNAT_PRICE
#AQUNAT_PRICE
FeatureBenefit15 Buy + 13 Sell Conditions Institutional-grade signal engine Next Target Prediction Auto-calculates closest pivot level Risk-Reward Ratio (Long/Short)Filters trades ≥ 2.0:1Wick Reversal Detector Bull/Bear Wick, Extreme, Outside, Doji Hot Zone Detection DPZ (Red), GPZ (Green), MTZ Valuation Engine Over/Undervalued vs VPOC, TC, BC Multi-Timeframe Summary Daily, Weekly, Monthly bias Buy/Sell Quant Layers Shows support/resistance clusters Probability Table PP-Tested vs PP-Untested rules Novice Mode Simplified "Yes/No" signals Customizable Levels Show All, Key, or None Alerts Built-InL3/H3, R1/S1, VPOC breaks
USE CASES & TRADING STRATEGIES
1. Scalping with Wick + Hot Zone (5M–15M)
Rule: Trade only when "Wick Reversal = Yes" + Hot Zone = GPZ
text Example:
Wick: Yes - Bull Wick
Hot Zone: GPZ: VPOC+PP
Buy Count: 12/15
→ Enter long at pullback to VPOC
Target: Next R1
Stop: Below L3
RR: 2.8:1
2. Risk-Reward Filter Trading (15M–1H)
Rule: Enter only if RR ≥ 2.0
text Long RR: 2.5 (Green)
Short RR: 1.4 (Gray)
→ Only take longs
Entry: Current Open
Target: Avg of Buy Targets
Stop: Avg of Buy Layers
3. Reversal Trading at L3/H3
Rule: Reversal Signal + Wick + Camarilla = Lower/Higher
text Price < L3
Reversal Signal: Bull Reversal
Camarilla: Lower Value
Wick: Yes - Bull Wick
→ High-Probability Bottom Reversal
4. Trend Continuation (PP-Untested)
Rule: Day Expectation = Bullish Beyond R1 + No Reversal
text Price > R1
Expectation: Extended Move
No Wick Reversal
→ Trail stop below PP
Target: R2 or H3
5. Multi-Timeframe Confluence
Rule: Enter when ≥2 timeframes agree
TFBuySellBiasDaily114BullishWeekly103BullishSummaryStrong Buy
→ Wait for pullback to Buy Layer (S1 or L3)
HOW TO READ THE DASHBOARD
Column Meaning Timeframe D, W, M Open Price Session open PP, R1, S1, etc . Key levels (highlighted if in Hot Zone) Buy X/15 (≥10 = Strong)Sell X/13 (≥7 = Strong)Wick Reversal "Yes - Bull Wick" = Enter Next Target Closest pivot level Long/Short RR Green = Valid trade Reversal Signal Bull/Bear Reversal at extremes Valuation Over/Undervalued Hot Zone DPZ = Sell, GPZ = Buy Camarilla Higher/Lower Value Day Expectation Momentum direction
PROBABILITY TABLE (PP-Tested vs PP-Untested)
LevelTouch%Close%PP-TestedPP-UntestedPP63%N/A All rules Trending rulesL173.3%46.6%Fade reversions73.8% close >L1L2↓50%↓70%*Take partials61.9% touchedL3↓25%90.9%*Avoid extremes72.4% touchedL4+Rare80%*High risk77.8% touched
*PP-Tested = Price opened inside CPR
*PP-Untested = Price opened outside CPR
PRO TIPS
Best on 5M–1H charts
Use with volume profile for VPOC confirmation
Set alerts on L3/H3 crossover or RR ≥ 2.5
Novice Mode for beginners (Yes/No only)
Hide levels to declutter: Show Levels = Key
Combine with A Quant Price Institutional Matrix for macro view
IDEAL MARKETS
Forex (EURUSD, GBPUSD, USDJPY)
Indices (NAS100, SPX500)
Crypto (BTC, ETH – set 6–8 decimals)
Futures (ES, NQ, CL)
SETUP GUIDE
Open TradingView
Go to Indicators
Search: AQuantPrice Dashboard
Click Add to Chart
Customize:
Min Buy = 10, Min Sell = 7
Min RR = 2.0
Show Levels = Key
Novice Mode = On (for beginners)
AUTHOR
© @AQuant_Price
Professional Pine Script Developer | 12+ Years in Algo Trading
Trusted by 15,000+ traders worldwide.
Not financial advice. Trade at your own risk.
FINAL TAGLINE
"One Dashboard. All Decisions."
A Quant Price Dashboard – Small Timeframes ALL IN ONE
Your Edge. Live.

PivotBoss Outside Reversal SetupPATTERN SUMMARY
1. The engulfing bar of a bullish outside reversal setup has a low that is below the prior bar's low (L < L ) and a
close that is above the prior bar's high (C > H ).
2. The engulfing bar of a bearish outside reversal setup has a high that is above the prior bar's high (H > H )
and a close that is below the prior bar's low (C < L ).
3. The engulfing bar is usually 5 to 25 percent larger than the size of the average bar in the lookback period.
PATTERN PSYCHOLOGY
The power behind this pattern lies in the psychology behind the traders involved in this setup. If you have
ever participated in a breakout at support or resistance only to have the market reverse sharply against you, then
you are familiar with the market dynamics of this setup. What exactly is going on at these levels? To understand
this concept is to understand the outside reversal pattern. Basically, market participants are testing the waters
above resistance or below support to make sure there is no new business to be done at these levels. When no
initiative buyers or sellers participate in range extension, responsive participants have all the information they
need to reverse price back toward a new area of perceived value.
As you look at a bullish outside reversal pattern, you will notice that the current bar's low is lower than the
prior bar's low. Essentially, the market is testing the waters below recently established lows to see if a downside
follow-through will occur. When no additional selling pressure enters the market, the result is a flood of buying
pressure that causes a springboard effect, thereby shooting price above the prior bar's highs and creating the
beginning of a bullish advance.
If you recall the child on the trampoline for a moment, you'll realize that the child had to force the bounce
mat down before he could spring into the air. Also, remember Jennifer the cake baker? She initially pushed price
to $20 per cake, which sent a flood of orders into her shop. The flood of buying pressure eventually sent the price
of her cakes to $35 apiece. Basically, price had to test the $20 level before it could rise to $35.
Let's analyze the outside reversal setup in a different light for a moment. One of the reasons I like this setup
is because the two-bar pattern reduces into the wick reversal setup, which we covered earlier in the chapter. If
you are not familiar with candlestick reduction, the idea is simple. You are taking the price data over two or more
candlesticks and combining them to create a single candlestick. Therefore, you will be taking the open, high, low,
and close prices of the bars in question to create a single composite candlestick.
Take a look at Figure 2.13, which illustrates the candlestick reduction of the outside reversal setup.
Essentially, taking the highest high and the lowest low over the two-bar period gives you the range of the
composite candlestick. Then, taking the opening price of the first candle and the closing price of the last candle
will finish off the composite candlestick. Depending on the structure of the bars of the outside reversal setup, the
result of the candlestick reduction will usually be the transformation into a wick reversal setup, which we know to
be quite powerful. Therefore, in many cases the physiology of the outside reversal pattern basically demonstrates
the inherent psychological traits of the wick reversal pattern. This is just another level of analysis that reinforces
my belief in the outside reversal setup.

teril 1H EMA50 Harami Reversal Alerts BB Touch teril Harami Reversal Alerts BB Touch (Wick Filter Added + 1H EMA50)
teril Harami Reversal Alerts BB Touch (Wick Filter Added + 1H EMA50)
teril Harami Reversal Alerts BB Touch (Wick Filter Added + 1H EMA50)
teril Harami Reversal Alerts BB Touch (Wick Filter Added + 1H EMA50)

Swing Reversal Candlestick PatternThis indicator identifies high-probability swing reversal points by combining a fixed 20-period swing structure with strict candlestick reversal conditions. It is designed for traders who want to detect liquidity sweeps, failed breakouts, and sharp turning points in price.
The tool first determines the most recent swing high and swing low by scanning the previous 20 bars. When the price touches or sweeps these levels, the indicator evaluates the current candle for strong reversal characteristics. These include wick dominance, body direction change, and structural validation against the previous bar. Only candles that meet all reversal criteria are marked.
Bullish signals appear when the price sweeps a swing low followed by a strong upward reversal candle.
Bearish signals appear when the price sweeps a swing high, followed by a strong downward reversal candle.
This tool is intended strictly for reversal setups, not for trend continuation trading. Traders may also use the candle wick as a natural stop-loss reference, aligning entries with liquidity sweep behavior.

teril Harami Reversal Alerts BB Touch (Wick Filter Added) teril Harami Reversal Alerts BB Touch (Wick Filter Added)
teril Harami Reversal Alerts BB Touch (Wick Filter Added) teril Harami Reversal Alerts BB Touch (Wick Filter Added) teril Harami Reversal Alerts BB Touch (Wick Filter Added)
teril Harami Reversal Alerts BB Touch (Wick Filter Added)

Harami Reversal Alerts BB Touch (Strict First Candle)Harami Reversal Alerts BB Touch (Strict First Candle)
Harami Reversal Alerts BB Touch (Strict First Candle)Harami Reversal Alerts BB Touch (Strict First Candle)Harami Reversal Alerts BB Touch (Strict First Candle)Harami Reversal Alerts BB Touch (Strict First Candle)Harami Reversal Alerts BB Touch (Strict First Candle)

WSMR v3.8 — WhaleSplash → Mean Reversal# WSMR v3.8 — WhaleSplash → Mean Reversal
### Global, Anchored, Non-Repainting Signal Framework for Futures, Crypto & Index Markets
**WSMR v3.8** is a volatility-anchored market-structure framework designed to detect two high-probability turning points:
## 1️⃣ WhaleSplash (WS) — Short Impulse Exhaustion
A “WhaleSplash” is a large downside impulse characterised by:
- bar range ≥ *k × ATR*
- strong % move
- volume expansion vs SMA(20)
- deep Z-Score oversold
- compression away from VWAP
- RSI weakness
When these conditions align, the indicator marks a short exhaustion event and prints a 🐋 icon below the bar. This is a **non-repainting bar-close confirmation**.
---
## 2️⃣ Mean Reversal (MR) — Bullish Reversal Setup
The MR module combines:
- RSI bullish divergence (pivot-based, safe)
- Z-Score reset above threshold
- SMA20 reclaim with positive slope
- Higher-low structure
When confirmed at bar-close, the indicator identifies conditions favourable for a **mean-reversion long**.
MR signals can optionally trigger an “**1st green candle after MR**” confirmation within a user-defined TTL (default 12 bars).
---
# 🎯 Key Features
### ✔ Non-Repainting Confirmed Signals
WS & MR only fire **after** bar close, using cooldown logic to avoid clustering and noise.
### ✔ VWAP-Anchored Z-Score Framework
All signals reference price distance and statistical deviation from VWAP, producing adaptive, volatility-aware setups.
### ✔ Session Filter (Asia-Optimised)
Optional session gating allows signals only between **23:00–09:00 UTC**, ideal for systematic Asia-session breakout & mean-reversion traders.
### ✔ Volatility Monitor (Normal → Extreme)
Dynamic volatility classification using:
- ATR baseline ratio
- wickiness index
- range Z-Score
States: **Normal → Wicky → Spiky → Extreme**
Displayed with colour-coded background in the status panel.
### ✔ Rolling WhaleSplash Frequency (Analytics Panel)
WSMR tracks the frequency of WhaleSplash events over a rolling window (Bars/Days/Weeks/Months) and estimates average WS/day (on minute timeframes).
### ✔ Status Panel (Bottom-Right)
Live display of:
- Mode (Global/Asia)
- Timeframe + TTL status
- WhaleSplash frequency
- Volatility state
- ATR/Range information
---
# 📌 Best Timeframes
Optimised and validated on **5-minute charts**, but compatible with all intraday timeframes.
---
# 🚨 Alerts Included
- WhaleSplash SHORT
- WhaleSplash LONG
- Volatility Warning (Spiky/Extreme)
---
# ⚠️ Notes
WSMR v3.8 is not a buy/sell system. It is a **signal framework** highlighting exhaustion and reversal conditions. Always combine with market structure, session context, and risk management. Past performance does not guarantee future results.
---
# 💬 Credits
Script created by **John Nolan (JohnFrancisNolan)**
Pine Script® v6
© 2024–2025 — Published under the **Mozilla Public License 2.0**
