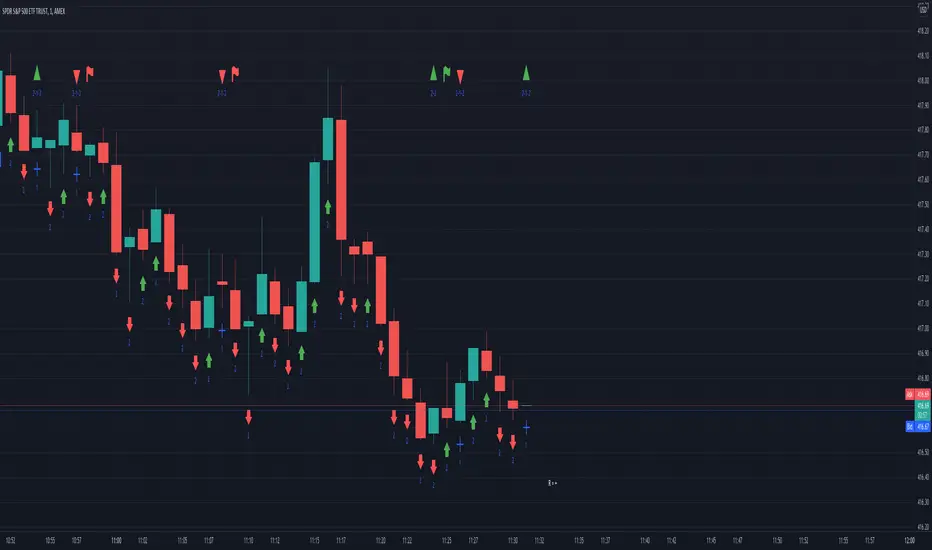
Extreme Reversal SignalThe Extreme Reversal Signal is designed to signal potential pivot points when the price of an asset becomes extremely overbought or oversold. Extreme conditions typically signal a brief or extensive price reversal, offering valuable entry or exit points. It's important to note that this indicator may produce multiple signals, making it essential to corroborate these signals with other forms of analysis to determine their validity. While the default settings provide valuable insights, it might be beneficial to experiment with different configurations to ensure the indicator's efficacy.
Two primary conditions define extremely overbought and oversold states. The first condition is that the price must deviate by two standard deviations from the 20-day Simple Moving Average (SMA). The second condition is that the 3-day SMA of the 14-day Stochastic Oscillator (STO) derived from the 14-day Relative Strength Index (RSI) is above or below the upper or lower limit.
Oversold states arise when the first condition is met and the 3-day SMA of the 14-day Stochastic RSI falls below the lower limit, suggesting a buy signal. These are visually represented by green triangles below the price bars. Overbought states arise when the first condition is met and the 3-day SMA of the 14-day Stochastic RSI rises above the upper limit, suggesting a sell signal. These are visually represented by red triangles above the price bars. It's also possible to set up automated alerts to get notifications when either of these two conditions is met to avoid missing out.
While this indicator has traditionally identified overbought and oversold conditions in various different assets, past performance does not guarantee future results. Therefore, it is advisable to supplement this indicator with other technical tools. For instance, trend indicators can greatly improve the decision-making process when planning for entries and exit points.
在腳本中搜尋"reversal"

DHL reversal indicator [promuckaj]DHL reversal indicator was developed as idea to mark interesting zones on the chart according to previous daily High/Low prices that in most scenarios could be a good point to open reversal scalp position.
Logic behind this is that if price is above previous daily high, or below previous daily low, with confluence of MA20 indicator will mark that zones with color. If price pullback and cross MA20 (at least with 80% with candles body) but still is out of previous daily high/low it will mark respective bars as confirmed potential signals with triangles.
Confirmed potential signals can be filtered with simple MACD, preferred with 1D timeframe for MACD, used as general bias.
Settings allow to change MA, MACD and colors as well as integrated alerts for potential confirmed signals for long/short.
Everyone enjoy and happy scalping!
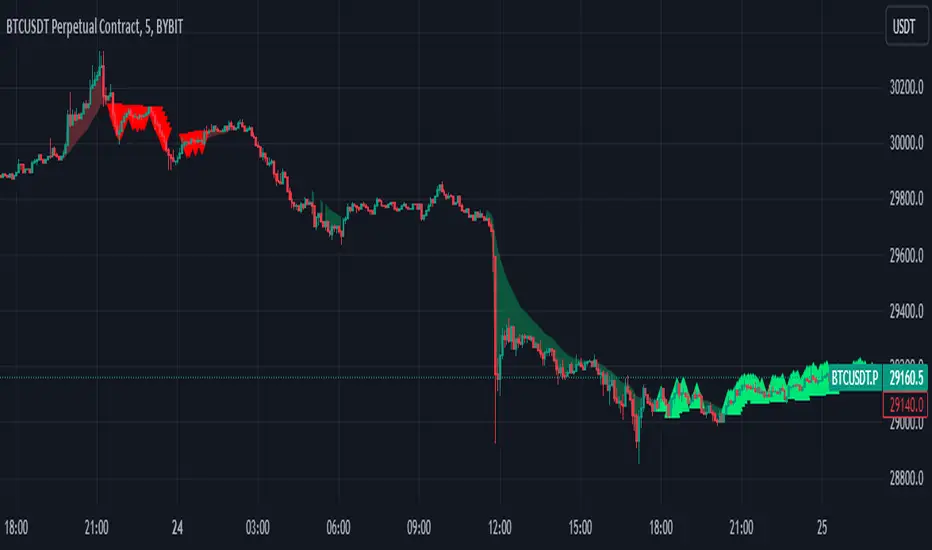
Volume Weighted Reversal BandsThis is a vwap & vwma hybrid with upper & lower deviation bands that provide excellent price channels and reversal areas. It can be used on lower & higher timeframes, just increase the deviation % for higher timeframes. Try out the 1 minute timeframe with .5% deviation for great scalping levels.
Here is the calculation used for the main line.
(VWMA100 + VWMA500 + VWMA1000 + VWAP) / 4
So it combines 3 VWMAs with the VWAP and divides that number by 4 to give us a moving average. Then we add new levels above and below that moving average to get our channels. The channels are separated by the % deviation you choose in the settings. For tighter bands, lower the percentage deviation and for wider bands, increase the percentage deviation.
The fattest line in the middle is the main moving average and you can expect price to regularly return to this level. The thick lines are the main moving average plus or minus the percentage deviation you have set. There are 10 levels in each direction from the main moving average. The is also a thin short term moving average as well with a custom calculation. It takes 4 different length moving averages that are weighted and 4 more that are volume weighted and divides the total by 8.The lines will be green when price is above the line and red when price is below the line. The thin white line is the VWAP on its own.
These lines will act as dynamic support and resistance so you can scalp them back and forth. These levels work so well because they are volume weighted and the algos hedge their positions back and forth constantly.
For best results, use this indicator on tickers with the highest volume and trading action as the price will stick to these levels better when the big money players are hedging. Some great tickers for this indicator are APPL, SPY, BTC, ETH.
All colors and linewidths can be customized in the settings easily as well as turning off the VWAP or short moving average and adjusting the percentage deviation for the channels.
***MARKETS***
This indicator can be used on all markets, including stocks, crypto, futures and forex.
***TIMEFRAMES***
This indicator can be used on all timeframes.
***TIPS***
Try using numerous indicators of ours on your chart for extra confirmation. Our favorites to pair with these bands are the Scalper Ribbon and Trend Friend Signals. The 3 combined give you a lot of extra confirmation on whether the market is going to reverse at these levels.

[Rygel] Trend Reversal IndicatorThis indicator is a trend reversal detector. It provides a bullish or bearish signal derived from the analysis of 22 indicators.
It analyzes and aggregates the divergences and the overbought and oversold conditions to determine a signal strength going from -100 to 100.
You can choose the appearance of the signals, how sensitive you want the signals to be and the indicators you want to use.
You can also display divergences, and show signal, divergence, overbought and oversold strength as a background color.
This indicators also provides several alerts.
You can find more information about the divergence algorithm I'm using on this page .
Please note this indicator will not give you buy nor sell signals. A bullish signal will not always be followed by a bearish one and vice-versa. You may get the same type of signals for a long time ; expect to see far more bearish signals in a bullish market and far more bullish signals in a bearish market.
You should never make a buy or sell decision based solely on this indicator, even when the signal is very strong.
This indicator is made to help you to confirm your market analysis and to warn you of possible incoming trend reversals so you can anticipate them and adapt your trading strategy accordingly. It may also help you to optimize your DCA times of purchase.
Please note a signal becomes final only after the bar after it is closed, as a divergence pivot may still be invalidated by then. When the signal bar is closed, the signal is considered as confirmed but may still disappears if it is invalidated by the next bar. When the second bar is closed, the signal is made final and stays definitely on the chart.
This indicator currently supports the following indicators as sources:
AO (Awesome Oscillator)
BBP (Bear Bull Power)
CCI (Commodity Channel Index)
CMF (Chaikin Money Flow)
CO (Chaikin Oscillator)
EOM (Ease of Movement)
MACD (Moving Average Convergence Divergence)
MACD histogram
MFI (Money Flow Index)
MOM (Momentum)
OBV (On-Balance Volume)
OBV oscillator
RSI (Relative Strength Index)
RVGI (Relative Vigor Index)
RVI (Relative Volatility Index)
Stochastic
Stochastic RSI
TSI (True Strength Index)
UO (Ultimate Oscillator)
VWMACD (Volume-Weighted MACD)
VWMACD histogram
WT (Wave Trend)
You can disable any of them in the settings. You only need one indicator source enabled for the Trend Reversal Indicator to work.
If you disable some indicators, you may need to lower the sensitivity or even use a custom one as the signals strength will probably be higher as it will be easier to match most of the indicators.
As this indicator makes a lot of computation, it takes a few seconds to load. If it's an issue for you, you may improve its performance by disabling some indicator sources.
HOW IS THE SIGNAL CALCULATED
The algorithm analyzes the last three bars (the current one and the two previous bars) and for each enabled indicator source:
Add one point for a positive divergence ;
Add one point for an oversold condition (when the indicator supports it) ;
Add one point for a strongly oversold condition (cumulated with the oversold point) ;
Remove one point for a negative divergence ;
Remove one point for an overbought condition ;
Remove one point for a strongly overbought condition (cumulated with the overbought point).
It then normalizes the signal from -100 to 100, where -100 is the minimum theoretical score and 100 is the maximum theoretical one.
The algorithm detects up to 100 bars long divergences.
SETTINGS
SIGNAL SENSITIVITY
You can set the indicator sensitivity to one of five levels.
Very low (60):
Low (55):
Medium (50): (this is the default value)
High (45):
Very high (40):
You can also set a custom sensitivity by choosing "Custom" and filling the "Custom sensitivity" field.
SIGNAL APPARENCE
Show signal strength: replace the "Bear" and "Bull" label with the signal strength.
Show indicator names: add the indicator names to the label to know exactly what got detected.
OB is for "overbought", OS is for "oversold", OB+ is for "strongly overbought" and OS+ for "strongly oversold".
DIVERGENCES
Show divergences: add all the detected divergences to the graph. The more divergences are in the same zone, the brighter the colors are. Please note TradingView limits to 500 the number of lines you can display at anytime, so divergences will only be shown for the most recent bars.
BACKGROUNDS
You can show signal, divergence, overbought and oversold strength as a background color.
Show signal background:
Show divergence background:
The more divergences are detected in the same bar, the brighter the color is.
Please note the divergence background only shows confirmed divergences. It requires two bars for a divergence to be confirmed.
Show overbought and oversold background:
The more overbought and oversold conditions are detected in the same bar, the brighter the color is.
You can also combined all of the backgrounds for even more eye pain.
ALERTS
This indicator offers multiple alerts.
New trend reversal signal: a new trend reversal signal has been detected. Bar is not yet closed, signal may still be invalidated and disappear. It's the earliest alert you can get but you'll also get many false positives.
New bearish trend reversal signal: identical, but with bearish signals only.
New bullish trend reversal signal: identical, but with bullish signals only.
Confirmed trend reversal signal: a trend reversal signal has been confirmed. The signal bar is closed but the signal may still be invalidated by the current bar. You'll get far less false positives.
Confirmed bearish trend reversal signal: identical, but with bearish signals only.
Confirmed bullish trend reversal signal: identical, but with bullish signals only.
Final trend reversal signal: a trend reversal signal has been confirmed and is now final. The signal bar and the following one are closed. The signal can't change anymore but it will likely be too late to act on some signals, especially bearish ones. Crashes can be brutal whereas bullish trend reversals usually take more time to unfold.
Final bearish trend reversal signal: identical, but with bearish signals only.
Final bullish trend reversal signal: identical, but with bullish signals only.
I hope you'll enjoy this indicator and I hope it will be as useful to you as it is to me.
Feel free to comment if you experience a bug or if an important feature is missing for you.
If you like this indicator, please note it has been designed to be used it with my R.S.I. with divergences indicator and my M.A.C.D. with divergences indicator .

TraderLion Reversal BarsTraderLion Reversal Bars highlights key reversal bars for your technical analysis in a visual manner.
The script highlights Oops Up, Kicker, Three Bar Break, Upside Reversal, Power of 3, Outside Bullish/Bearish Days.
Default Settings: 3 Bar Break, Oops Up, Kicker
Oops Up - Price opens below prior day’s close and closes above. Concept by Larry Williams
Kicker - When the prior day closes down and the current day gaps above the entirety of yesterday’s action signaling a clear momentum change.
Three Bar Break - Price breaks above prior 3 closes and closes above on above-average volume.
Upside Reversal - Today’s price undercuts the prior day’s low but closes the day on a >= 50% closing range
Power of 3 - Power of 3 shows the strength and demand of stock to get through the 3 widely followed moving averages (10, 21, 50 daily moving averages)
Outside Bullish/Bearish Day - Price closes above/below the prior day’s high/low.
Each condition can be Alerted by right click a bar on the charts.
Suggestions? Comment below. Cheers!

Volatitity Bands (STARC) on RSI for reversal warning [beta]Origin : The Indicator uses STARC volatilty bands created by Manning Stoller, based on ATR.
He perfered them to Bollinger because extreme price action never exceeds them.
Her former scholar and now TA Superstar Constance Brown applied them on RSI for getting
very relavant trend reversals. (She only used them in times when "overbought or not" becomes a severe question.
What it does: It delivers a reversal signal after rsi exceeded the bands and - as the bands resume the trend - the rsi fails to test the band once more. This is the moment of a reversal warning.
How to work wit h:
- Take the index of your interest and choose a time horizon one or two scales higher than your usual working horizon .(i.e if you work on Daily choose weekly).
-Scale the upper and the lower band via settings, so that the rsi only in rare cases exceeds or touches the bands. This is to tweak the reversal threshold. (For weekly SPX i am fine with 2.2 and 2.1)
- Find the arrows that mark possible reversals.
- Ready
Note: I called this a beta because i publish it with nearly no practical experience with it , just checked the formal correctness of the code. (Published so fast because it was written during the coronavirus days, for which to handle it might be helpful. )So feedback very welcome.
I took the formula in slight modification from the book "Technical Analysis for the Trading Professional", 2nd edition, by Constance Brown.
"Fun" Note: As you see the script would have warned before the corona selling - if you had used it.
I didn't because bull flags and all predicted nice weather...
Greets and again feedback welcome
yoxxx

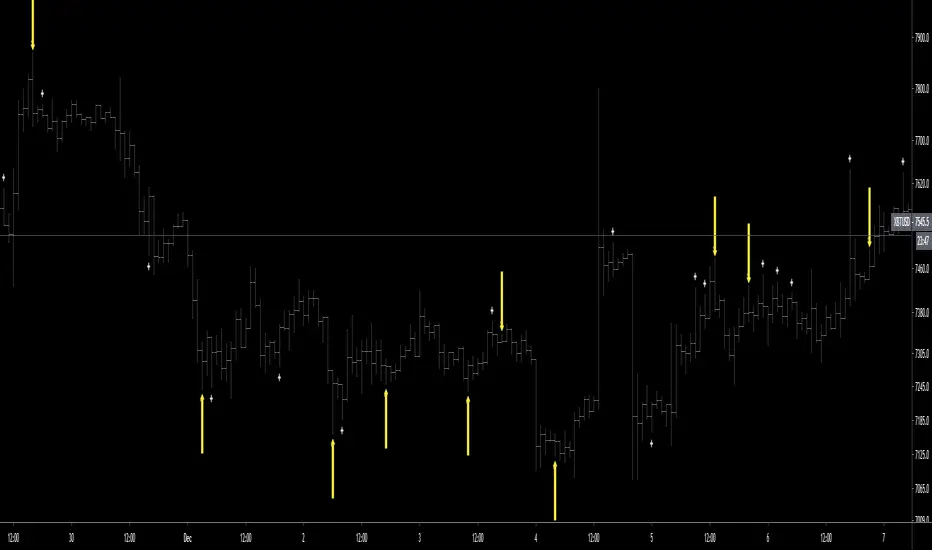
ChaosSN Reversal SignalsI calculated various metrics to measure exhaustion and mean diversion to plot arrows for a likely reversal point.
Use the input window to tailor the sensitivity of the arrows based on the amount of volatility your chart is experiencing (lower = more sensistive). The most common inputs for me are 8, 13, 21.
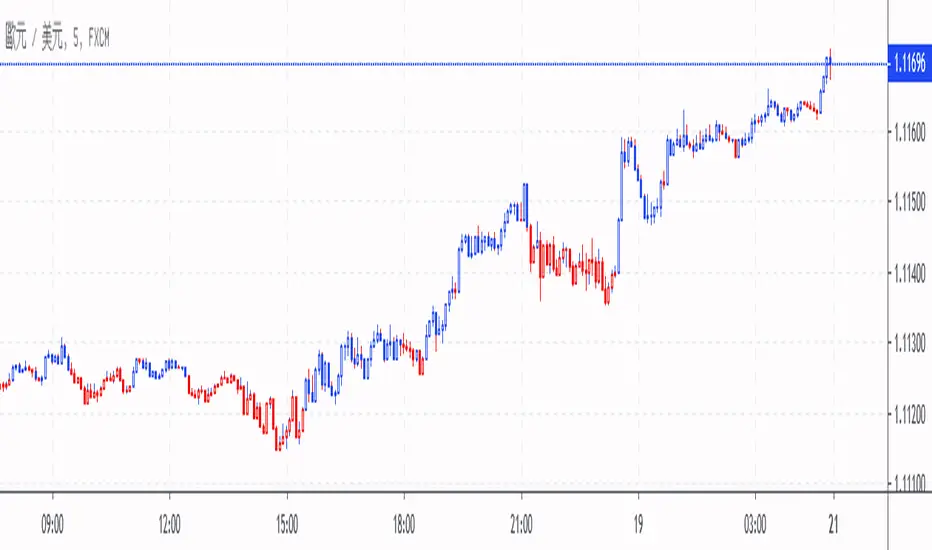
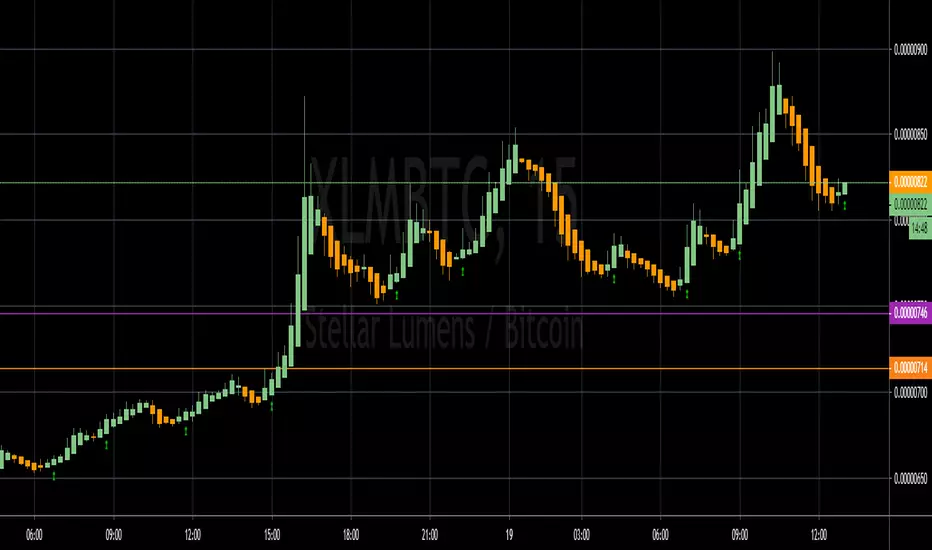
[LunaOwl] 反轉模式 (Bollinger %B Reversals)This is a tool using the Bollinger %B and Arnaud Legoux Moving Average (ALMA), it is a reliable tool for trading price action reversals.
腳本使用布林%B和ALMA,是一個可靠的逐棒分析反轉工具。
1. 英鎊兌美元 GBP / USD, 5 min
2. 美元兌日圓 USD / JPY, 5 min
3. 美元兌離岸人民幣 USD / CNH, 5 min
4. 日本 Sosei 生物製藥株式會社 Sosei Group Corporation, 5 min
5. 比特幣永續 Bitcoin for BitMEX, 5 min
6. 瑞波幣兌比特幣 XRP / BTC, Poloniex, 1 hour
7. 比特幣主導比率 Bitcoin Dominance Index, 4 hour

Trend Reversal Alert Hybrid [T.R.A.H]This is extention of a hybrid of AlPos-Trend-Highlighter with Peaks and Bottoms Detector from All Time Fibo Channel .
It is a visualizer of Reversal Points and Trend Lines for the series of a T-R.A.S strategies that are available in my scripts.
* Note : I ended up frustrated, I must say, because when I run my strategy it works perfect, but when I add this visualizer and turn it into strategy for some reason that is beyond of my understanding of pinescript, results are different. I tried everything I could, but in the end decided to make two separately working scripts that one is an indicator and the other one is a strategy. And it's working that way WTH!?!?!? for some reason in SPX lime and aqua lines showed displaced from candles, but when you use it on crypto seems working perfect. Might be a difference in data.. Anyway, please test and comment.
Linda Raschke 5 SMA Reversal [LuciTech]How This Indicator Works:
-5 SMA Tracking: Calculates a 5-period simple moving average and plots it on the chart.
-Extension Counter: Counts consecutive bars where price closes above or below the 5 SMA.
-BUY Signals (Green Up Arrow): Triggers when price closes BELOW the 5 SMA after 7+ consecutive closes ABOVE it—indicates a reversal opportunity into dynamic support.
-SELL Signals (Red Down Arrow): Triggers when price closes ABOVE the 5 SMA after 7+ consecutive closes BELOW it—indicates a reversal bounce setup.
-No Repainting: Signals only plot on confirmed bar closes; no repainting issues.
Linda Raschke's Core Principles:
-Extended Run = Imbalance: When price stays above/below the 5 SMA for 7+ bars, it's a one-sided market; mean reversion is likely.
-First Cross = Trigger: The first close back across the SMA after an extension is the reversal signal, not every touch.
-No Setup? No Trade: Without a prior extension or "three-bar balance" filter, a 5 SMA tag is noise. The model requires the prior momentum condition.
-Uptrend Buys: In uptrends, buy dips to the SMA (dynamic support) as long as the weekly/monthly trend is intact.
-Downtrend Fades: In downtrends, treat first rallies above the SMA as bounce fades into lower lows (especially after 14+ bars below).

Candlestick Reversal and Trend Signals [AlgoAlpha]🚀 Unleash your charting capabilities with the Candlestick Reversal and Trend Signals indicator by AlgoAlpha, your go-to tool for spotting pivotal market movements! This script enhances your trading experience by identifying key candlestick patterns and trend changes, perfect for traders aiming for precision in their technical analysis.
🛠 Key Features:
- 🔄 Multi-Timeframe Analysis : Leverages a timeframe multiplier to analyze levels on higher timeframes, enhancing the depth and applicability of insights.
- 🧩 Diverse Pattern Detection : Capable of detecting a wide array of patterns including Bull/Bear Engulfings, Dojis, Haramis, Piercing Lines, Dark Cloud Covers, and Morning/Evening Stars, each contributing to a robust trading strategy.
- 🔍 Dynamic Trend Filters : Utilizes three exponential moving averages (EMAs) and volume filters to decisively confirm trend directions and strength, providing a clearer picture of market dynamics.
- ⚙️ Customizable Settings : Features adjustable settings for filter period, signal thresholds, and appearance, allowing for a tailored analysis experience to fit individual trading styles.
- 📉 Swing Levels Identification : Marks significant high and low swing points on the chart, highlighting potential pivot points and trend reversals for strategic trading decisions.
📈 Quick Guide to Using the Candlestick Reversal and Trend Signals Indicator
1. 🛠 Add the Indicator : Add the indicator to your favorites. Adjust the settings to match your analysis needs.
2. 📊 Analysis : Keep an eye out for the specific symbols plotted on your chart that indicate various candlestick patterns. Use these signals to enhance your market analysis.
3. 🔔 Set Alerts : Enable alerts for the patterns you are most interested in to get notified of potential trading opportunities without needing to monitor the charts constantly.
Embark on your enhanced trading journey with this powerful tool! 🚀✨ Happy trading!
🧐 How It Works:
The Candlestick Reversal and Trend Signals indicator operates by integrating several candlestick patterns and trend analysis features to assist in making informed trading decisions. Initially, it gathers user-defined settings like the period for filtering, signal thresholds, and the desired patterns to detect. It analyzes candlestick formations such as Bull/Bear Engulfings, Dojis, Haramis, and more, by comparing the current candlestick's attributes (such as body length and direction) with previous data to identify potential market reversals or confirmations. The indicator enhances its accuracy through additional filters like volume ratios and exponential moving averages (EMAs) that help validate the strength and direction of trends. By marking these patterns and trends visually on the chart, it provides clear signals that aid traders in identifying significant market movements efficiently. The script is then complemented with the 3 EMA indicator for trend detection and swing levels for added confluence.

TheStrat Reversal IndicatorThis indicator shows TheStrat 2-2 and 2-1-2 reversal setups.
2-2 Setups: Identifies specific 2-2 reversal setups. Long 2-2 reversals are shown when there is a 2d-2d-2d green candle sequence. Short 2-2 reversals are shown when there is a 2u-2u-2u red candle sequence. Setups are marked with "2-2" and a green up triangle for long setups or a red down triangle for short setups.
2-1-2 Setups: Identifies any 2-1-2 reversal setup. Setups are marked with "2-1-2" and a green up triangle for long setups or a red down triangle for short setups.
Both setups will then show a flag indicator on the next live candle if they actually trigger.
An alert can be set that will trigger on any live setup. This alert will trigger as soon as the setup candle shows, and will not wait till that setup candle closes. This is to allow you to watch the setup complete live and then watch the trigger condition live as well. Alerts must be set for each time frame you wish to alert on.
All candles are marked with labels underneath to identify the candle type.
When there is a live setup forming there is also a R-multiple calculation shown to the right of the current candle. This R-multiple is calculated from the setup candle's high or low to the 1st target previous candle.
This indicator works on any time frame.
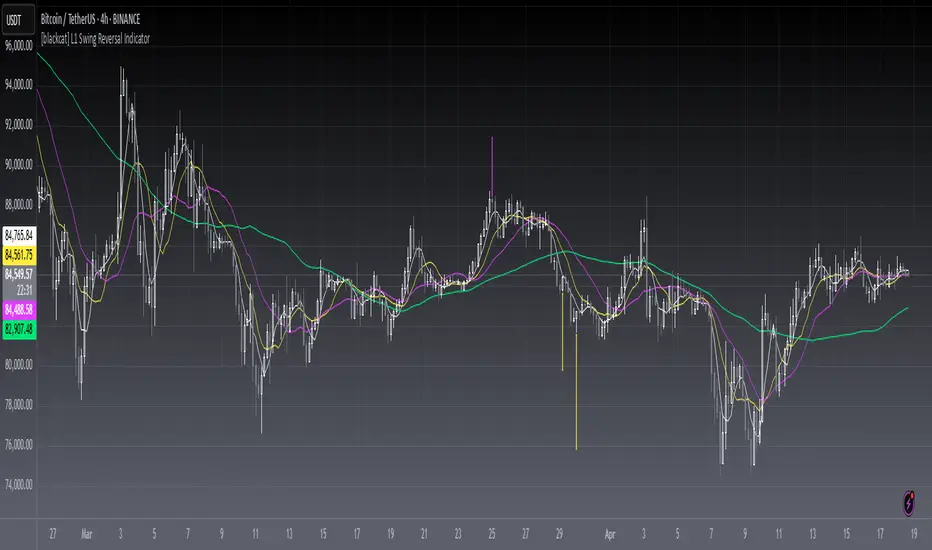
[blackcat] L1 Swing Reversal IndicatorLevel: 1
Background
Many asked me about swing reversal indicators. There are many but less of them can guarantee high win rate. Because market is complex, the reversals can be nested together, which means sub level reversals will be contained in higher level waves. This can be well explained by Elloit wave theory.
Function
Here it is a simple moving average based swing reversal indicator as an example for many others to improve it. Although it simple, it could be very powerful to dedicated trading pairs in specific time frame. One can adjust N1~N4 as SMA peiords from short to long to customized this indicator or even by trying different moving average types to enhance its accuracy.
Key Signal
N1~N4 --> SMA look back periods
OB --> Overbought Threshold
OS --> Oversold Threshold
Pros and Cons
Simpe but powerful. More feedbacks are appreciated.
Remarks
Easy to be customized or integrated to your trading system.
Readme
In real life, I am a prolific inventor. I have successfully applied for more than 60 international and regional patents in the past 12 years. But in the past two years or so, I have tried to transfer my creativity to the development of trading strategies. Tradingview is the ideal platform for me. I am selecting and contributing some of the hundreds of scripts to publish in Tradingview community. Welcome everyone to interact with me to discuss these interesting pine scripts.
The scripts posted are categorized into 5 levels according to my efforts or manhours put into these works.
Level 1 : interesting script snippets or distinctive improvement from classic indicators or strategy. Level 1 scripts can usually appear in more complex indicators as a function module or element.
Level 2 : composite indicator/strategy. By selecting or combining several independent or dependent functions or sub indicators in proper way, the composite script exhibits a resonance phenomenon which can filter out noise or fake trading signal to enhance trading confidence level.
Level 3 : comprehensive indicator/strategy. They are simple trading systems based on my strategies. They are commonly containing several or all of entry signal, close signal, stop loss, take profit, re-entry, risk management, and position sizing techniques. Even some interesting fundamental and mass psychological aspects are incorporated.
Level 4 : script snippets or functions that do not disclose source code. Interesting element that can reveal market laws and work as raw material for indicators and strategies. If you find Level 1~2 scripts are helpful, Level 4 is a private version that took me far more efforts to develop.
Level 5 : indicator/strategy that do not disclose source code. private version of Level 3 script with my accumulated script processing skills or a large number of custom functions. I had a private function library built in past two years. Level 5 scripts use many of them to achieve private trading strategy.

Heikin Ashi 1h Reversal Strategy [Mr_Orange]This my first published script, so if there are tips or questions, please let me know.
The goal of the script is to recognise a reversal pattern from bearish to bullish sentiment on a 1 hour chart. I want my trade entries to be "mechanically chosen" and not emotionally.
I have seen Heikin Ashi chart reversal scripts, as well as scripts to identify patterns on Stoch RSI , what I was looking for was a Heikin Ashi Reversal Candlestick Pattern which uses the Stochastic RSI as a confirmation for a reversal from bearish to bullish sentiment. I've yet to find one of those, so I decided to study pine scripts and make one myself that works the way I want, and because I've written it myself, I understand how it works. It is purely designed for the 1h chart and Heikin Ashi candles, please do not use it with regular candles. Other timeframes I have not studied, but in my experience, the smaller the timeframes, the trickier it gets, the higer, the more reliable.
At the moment I only included a Buy alert. I have not yet decided on a Sell signal/alert.
Thanks for checking it out!
If you think it is worth something:
- BTC: 1NrG3Sy2VW8u4wWHucj1CQjKQ6hXYwbSyX
Rob Booker Reversal TabsA simple reversal pattern indicator that uses MACD and Stochastics.
Created by Rob Booker and programmed by Andrew Palladino.

Liquidity Trap Reversal Pro (Radar v2)Liquidity Trap Reversal Pro (Radar v2) is a non-repainting indicator designed to detect hidden liquidity traps at key swing highs and lows. It combines wick analysis, volume spike detection, and optional trend and exhaustion filters to identify high-probability reversal setups.
🔷 Features:
Non-Repainting: Pivots confirmed after lookback period, no future leaking.
Volume Spike Detection: Filters traps that occur during major liquidity events.
EMA Trend Filter (Optional): Focus on traps aligned with the prevailing trend.
Higher Timeframe Trend Filter (Optional): Confirm traps using a higher timeframe EMA bias.
Exhaustion Guard (Optional): Prevents traps after overextended moves based on ATR stretch.
Clean Visuals: Distinct plots for raw trap points vs confirmed traps.
Alerts Included: Set alerts for confirmed high/low liquidity traps.
📚 How to Use:
Watch for Trap Signals:
A Trap High signal suggests a potential bearish reversal.
A Trap Low signal suggests a potential bullish reversal.
Use Confirmed Signals for Best Entries:
Confirmed traps fire only after price moves opposite to the trap direction, adding reliability.
Use Trend Filters to Improve Accuracy:
In an uptrend (price above EMA), prefer Trap Lows (buy setups).
In a downtrend (price below EMA), prefer Trap Highs (sell setups).
Use the Exhaustion Guard to Avoid Bad Trades:
This filter blocks signals when price has moved too far from trend, helping avoid late entries.
Recommended Settings:
Best used on 15-minute, 1-hour, or 4-hour charts.
Trend filter ON for trending markets.
Exhaustion guard ON for volatile or stretched markets.
📈 Important Notes:
This script does not repaint once a pivot is confirmed.
Alerts trigger only on confirmed trap signals.
Always combine signals with sound risk management and trading strategy.
Disclaimer:
This script is for educational purposes only. It is not investment advice or a guarantee of results. Always do your own research before trading.

Bollinger Bands Reversal Strategy Analyzer█ OVERVIEW
The Bollinger Bands Reversal Overlay is a versatile trading tool designed to help traders identify potential reversal opportunities using Bollinger Bands. It provides visual signals, performance metrics, and a detailed table to analyze the effectiveness of reversal-based strategies over a user-defined lookback period.
█ KEY FEATURES
Bollinger Bands Calculation
The indicator calculates the standard Bollinger Bands, consisting of:
A middle band (basis) as the Simple Moving Average (SMA) of the closing price.
An upper band as the basis plus a multiple of the standard deviation.
A lower band as the basis minus a multiple of the standard deviation.
Users can customize the length of the Bollinger Bands and the multiplier for the standard deviation.
Reversal Signals
The indicator identifies potential reversal signals based on the interaction between the price and the Bollinger Bands.
Two entry strategies are available:
Revert Cross: Waits for the price to close back above the lower band (for longs) or below the upper band (for shorts) after crossing it.
Cross Threshold: Triggers a signal as soon as the price crosses the lower band (for longs) or the upper band (for shorts).
Trade Direction
Users can select a trade bias:
Long: Focuses on bullish reversal signals.
Short: Focuses on bearish reversal signals.
Performance Metrics
The indicator calculates and displays the performance of trades over a user-defined lookback period ( barLookback ).
Metrics include:
Win Rate: The percentage of trades that were profitable.
Mean Return: The average return across all trades.
Median Return: The median return across all trades.
These metrics are calculated for each bar in the lookback period, providing insights into the strategy's performance over time.
Visual Signals
The indicator plots buy and sell signals on the chart:
Buy Signals: Displayed as green triangles below the price bars.
Sell Signals: Displayed as red triangles above the price bars.
Performance Table
A customizable table is displayed on the chart, showing the performance metrics for each bar in the lookback period.
The table includes:
Win Rate: Highlighted with gradient colors (green for high win rates, red for low win rates).
Mean Return: Colored based on profitability (green for positive returns, red for negative returns).
Median Return: Colored similarly to the mean return.
Time Filtering
Users can define a specific time window for the indicator to analyze trades, ensuring that performance metrics are calculated only for the desired period.
Customizable Display
The table's font size can be adjusted to suit the user's preference, with options for "Auto," "Small," "Normal," and "Large."
█ PURPOSE
The Bollinger Bands Reversal Overlay is designed to:
Help traders identify high-probability reversal opportunities using Bollinger Bands.
Provide actionable insights into the performance of reversal-based strategies.
Enable users to backtest and optimize their trading strategies by analyzing historical performance metrics.
█ IDEAL USERS
Swing Traders: Looking for reversal opportunities within a trend.
Mean Reversion Traders: Interested in trading price reversals to the mean.
Strategy Developers: Seeking to backtest and refine Bollinger Bands-based strategies.
Performance Analysts: Wanting to evaluate the effectiveness of reversal signals over time.

Nen Star Harmonic Pattern [TradingFinder] NenStar Reversal Auto🔵 Introduction
The Nen-Star Harmonic Pattern is an advanced reversal pattern in technical analysis, designed to identify market trend changes and predict key price reversal points. This pattern is defined by a combination of Fibonacci ratios and critical concepts such as Potential Reversal Zones (PRZ), market structure, and corrective waves.
The key points of this pattern include X, A, B, C, and D, and it appears in both bullish and bearish forms. In its bullish form, the pattern resembles the letter M, while in its bearish form, it takes the shape of W. The critical Fibonacci ratios for this pattern are 0.382 to 0.786 for the XA wave, 1.13 to 1.414 for the AB wave, and 1.272 to 2.618 for the BC wave.
The Nen-Star Harmonic Pattern is one of the most precise tools for identifying market reversals and executing reversal trades. Traders can use it to pinpoint optimal entry and exit points and benefit from high risk-to-reward ratios.
By emphasizing Fibonacci retracement levels, XABCD waves, the formation of bullish and bearish patterns, and precise trade entry points, this pattern has become a practical tool in advanced technical analysis.
Bullish Nen-Star Pattern :
Bearish Nen-Star Pattern :
🔵 How to Use
The Nen-Star Harmonic Pattern indicator allows traders to automatically identify the bullish and bearish structures of this pattern and locate optimal entry and exit points. By accurately analyzing Fibonacci ratios and determining points X, A, B, C, and D, the indicator highlights Potential Reversal Zones (PRZ) on the chart. Traders can rely on the generated signals to manage their trades with greater precision.
🟣 Bullish Nen-Star Pattern
The bullish Nen-Star pattern begins with a price increase from point X to point A, followed by a retracement to point B, which lies between 0.382 and 0.786 of the XA wave.
After this retracement, the price moves to point C, located between 1.13 and 1.414 of the AB wave. The final movement is a price decline to point D, which is between 1.272 and 2.618 of the BC wave and 1.13 to 1.272 of the XA wave.
Point D : Serves as the key Potential Reversal Zone (PRZ).
Entry : A buy trade is initiated at point D, signaling the end of the corrective movement and the beginning of a price increase.
Price Targets :
61.8% retracement of the CD wave
Point A
Point C
1.272 and 1.618 extensions of the CD wave if resistance at point C is broken
Stop Loss : Placed slightly below point D.
🟣 Bearish Nen-Star Pattern
The bearish Nen-Star pattern starts with a price decrease from point X to point A, followed by a retracement to point B, which lies between 0.382 and 0.786 of the XA wave.
After this retracement, the price moves to point C, located between 1.13 and 1.414 of the AB wave. The final movement is a price increase to point D, which is between 1.272 and 2.618 of the BC wave and 1.13 to 1.272 of the XA wave.
Point D : Serves as the key Potential Reversal Zone (PRZ).
Entry : A sell trade is initiated at point D, signaling the end of the corrective movement and the beginning of a price decline.
Price Targets :
61.8% retracement of the CD wave
Point A
Point C
1.272 and 1.618 extensions of the CD wave if support at point C is broken
Stop Loss : Placed slightly above point D.
🔵 Setting
🟣 Logical Setting
ZigZag Pivot Period : You can adjust the period so that the harmonic patterns are adjusted according to the pivot period you want. This factor is the most important parameter in pattern recognition.
Show Valid Forma t: If this parameter is on "On" mode, only patterns will be displayed that they have exact format and no noise can be seen in them. If "Off" is, the patterns displayed that maybe are noisy and do not exactly correspond to the original pattern.
Show Formation Last Pivot Confirm : if Turned on, you can see this ability of patterns when their last pivot is formed. If this feature is off, it will see the patterns as soon as they are formed. The advantage of this option being clear is less formation of fielded patterns, and it is accompanied by the latest pattern seeing and a sharp reduction in reward to risk.
Period of Formation Last Pivot : Using this parameter you can determine that the last pivot is based on Pivot period.
🟣 Genaral Setting
Show : Enter "On" to display the template and "Off" to not display the template.
Color : Enter the desired color to draw the pattern in this parameter.
LineWidth : You can enter the number 1 or numbers higher than one to adjust the thickness of the drawing lines. This number must be an integer and increases with increasing thickness.
LabelSize : You can adjust the size of the labels by using the "size.auto", "size.tiny", "size.smal", "size.normal", "size.large" or "size.huge" entries.
🟣 Alert Setting
Alert : On / Off
Message Frequency : This string parameter defines the announcement frequency. Choices include: "All" (activates the alert every time the function is called), "Once Per Bar" (activates the alert only on the first call within the bar), and "Once Per Bar Close" (the alert is activated only by a call at the last script execution of the real-time bar upon closing). The default setting is "Once per Bar".
Show Alert Time by Time Zone : The date, hour, and minute you receive in alert messages can be based on any time zone you choose. For example, if you want New York time, you should enter "UTC-4". This input is set to the time zone "UTC" by default.
🔵 Conclusion
The Nen-Star Harmonic Pattern is a highly effective analytical tool in global financial markets, playing a crucial role in identifying reversal points and market trend changes. By leveraging Fibonacci principles and price structure, this pattern enables precise analysis across various assets, including stocks, cryptocurrencies, forex, and commodities.
Traders operating in global markets can use this pattern to identify high risk-to-reward trading opportunities. Its clear entry and exit points, defined Potential Reversal Zones (PRZ), and accurate price targets make it an excellent tool for risk management and profitability enhancement.
In the global context, the Nen-Star pattern is widely used by professional analysts in both advanced and emerging markets due to its versatility in analyzing long-term and short-term charts. Beyond trend prediction, it enhances trading strategies and optimizes investment decisions.
Combining this pattern with complementary tools such as volume analysis, technical indicators, and macroeconomic conditions can provide traders with deeper market insights, helping them capitalize on global opportunities.

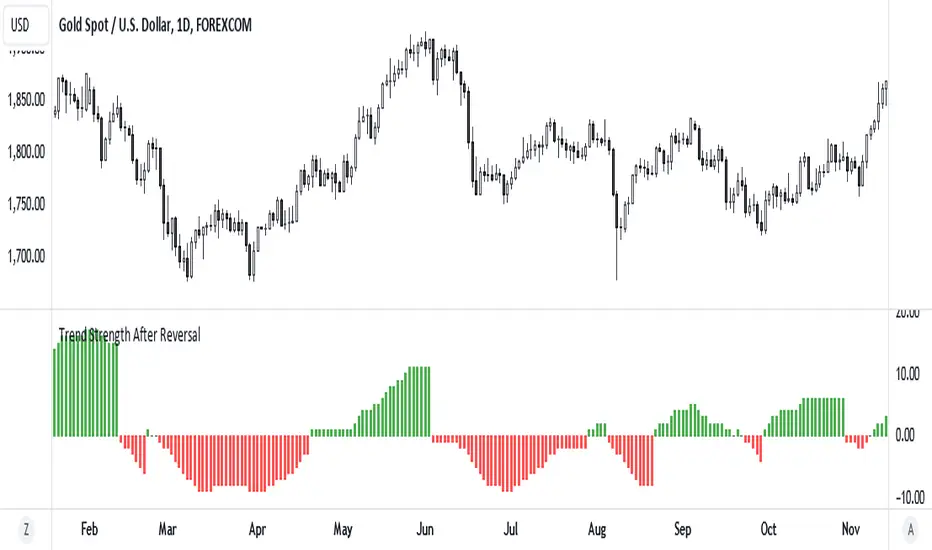
Trend Strength After Reversal
This indicator measures trend strength after the reversal.
It can catch early reversal based on engulfing candlestick pattern or just the regular reversal.
Every reversal have to be confirmed by a close above reversal pattern.
Trend strength is measured by counting subsequent closing confirming the reversal
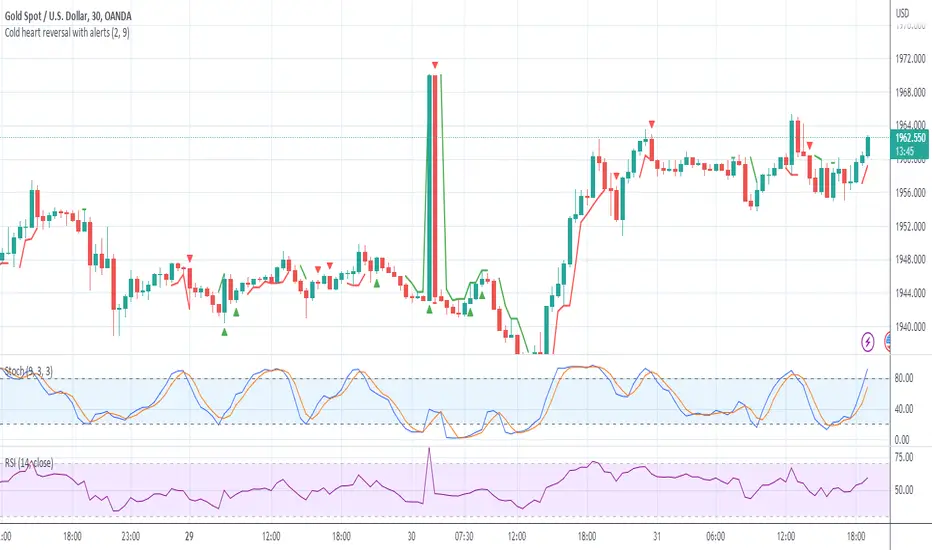
Cold heart reversal with alertsThis will help you find reversal point pinpoint to its candle actually crossed the lowest or highest in the overbought and oversold zone (stochastic 9,3,3)
Various input parameters are defined . These inputs allow the user to customize the lookback period which is the number of candle before the low or high, Stochastic length.
User can also define their own high and low values that will plot on the chart.
It will be super convenient for traders who want confirmed price closed that is actually its significant point.
I used barstate confirmed in this code so you don't have to worry about repaint
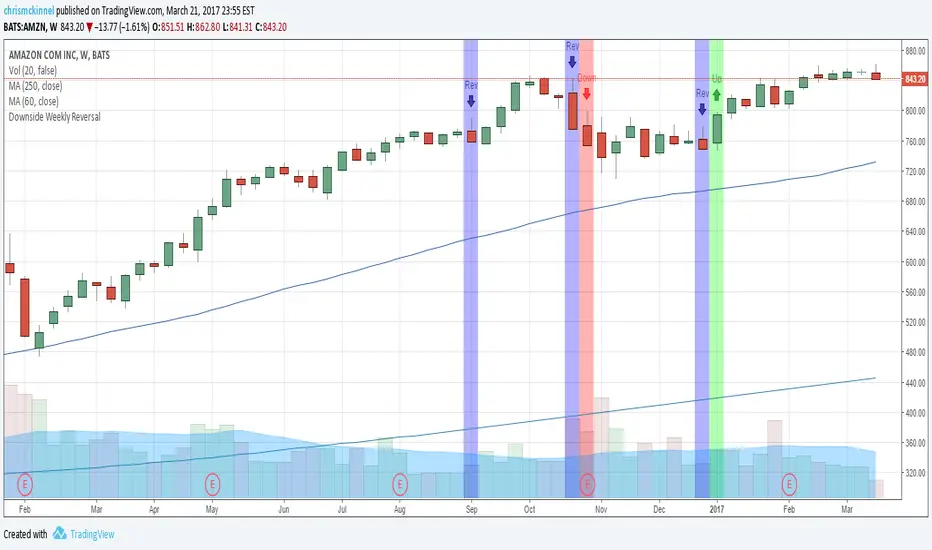
Downside Weekly ReversalBased on Thomas Bulkowski's top ranking small pattern: the Downside Weekly Reversal pattern.
Add this indicator to your weekly charts.
Blue bars represent weekly reversals and green bars following blue bars indicate an upside breakout. These are to be traded in a Bull market.
Red bars following blue bars indicate a downside breakout. These are to be traded in a Bear market.
More details: thepatternsite.com