Reversal iJung v2Reversal iJung v2 User Guide
1. Concept
Reversal iJung v2 is a trend-filtered reversal entry tool with:
Trend filter using EMA 20/50/200 (+ EMA cluster)
Candle pattern confirmation (Engulfing / Pin bar)
“Body over EMA20” logic for valid signals
Retrace-based Pending Entry (Limit style)
Auto Lot, RR-based exits, dashboard, and webhook alerts to Telegram
Objective: pick high-quality reversals in line with the major trend, enter with better RR via retrace, and manage risk clearly.
2. Core Components
2.1 EMA Trend Filter & Cluster
EMA20 / EMA50 / EMA200 define:
Bull trend: 20 > 50 > 200
Bear trend: 20 < 50 < 200
useTrendFilter:
On: only trade in trend direction
Off: ignore trend
EMA Cluster Mode
"Off": no cluster filter
"2 EMA (Fast/Mid)": EMA20 & EMA50 must stay within Max EMA Distance (x ATR)
"3 EMA (Fast/Mid/Slow)": EMA20/50/200 all clustered
This helps avoid messy conditions where EMAs are too wide or choppy.
2.2 MACD Weakness Filter
Long: accept only if selling pressure weakens:
macdLine < 0 and macdHist > macdHist
Short: accept only if buying pressure weakens:
macdLine > 0 and macdHist < macdHist
useMacdFilter = On/Off
2.3 Entry Logic & Retrace Mode
Patterns
Bull/Bear Engulfing
Bull/Bear Pin bar (with adjustable body/wick percentages)
Optional: “Any candle that closes over EMA20” as a signal
Body over EMA20
Long: candle body crosses EMA20 and closes above it
Short: body crosses EMA20 and closes below it
Entry Mode
"Close": entry at bar close
"Retrace":
Long: use close → low distance
Short: use high → close distance
EntryRetrace % controls how deep to place Limit entry
SL = swing low/high ± slBufferPts * mintick
TP1 / TP2 set by RR (1:rr1, 1:rr2)
2.4 Exit Logic
Normal exits:
Hit TP1, TP2, or SL
Track RR1 / RR2 statistics and total RR
EMA Exit:
Long exit when price closes below EMA20 with a bearish candle
Short exit when price closes above EMA20 with a bullish candle
Reason code: LONG_EMA_EXIT / SHORT_EMA_EXIT
2.5 Pending & Expiry
Only one side active at a time (no hedge).
minBarsBetweenSignals: lockout between signals to avoid spam.
pendingExpireBars: if price hasn’t touched entry within X bars, cancel pending and send *_PENDING_EXPIRED alert.
2.6 Auto Lot
Estimate lot size from:
Account Balance
Risk % per trade
Value per point per 1 lot
Then:
Lot ≈ (Balance × Risk%) / (|Entry – SL| × valuePerPointPerLot)
A label Lot≈... is shown near the entry line.
2.7 Dashboard
Modes: Normal, Compact, Mini
Mini mode shows:
Trend / Lot / Entry / SL / TP1 / TP2 / R1/R2 win%
Position options:
Top Right, Top Left, Bottom Right, Bottom Left
3. Alerts & Webhook
The script uses alert() with a JSON payload when useWebhook is enabled.
Key reasons:
ENTRY_SIGNAL → new pending (for placing Limit orders)
ENTRY_FILLED → order filled
LONG_SL, SHORT_SL, LONG_TP2, SHORT_TP2
LONG_EMA_EXIT, SHORT_EMA_EXIT
LONG_PENDING_EXPIRED, SHORT_PENDING_EXPIRED
Your Google Apps Script parses this JSON, builds a nice human-readable message, and forwards it to Telegram.
4. Telegram Flow (Short English Summary)
Create Telegram bot via BotFather → get BOT_TOKEN.
Get CHAT_ID of your group/channel.
Create Google Apps Script project, paste the provided code, set token + chat id.
Deploy as Web App (Anyone).
Use that Web App URL as Webhook URL in TradingView alert.
In TradingView:
Condition: Reversal iJung v2 → Any alert() function call
Leave message empty (the script generates JSON)
Enable Webhook + paste URL
Now you’ll receive:
Yellow (ENTRY_SIGNAL): to pre-place Limit orders
Green/Red (ENTRY_FILLED): when position is live
Exit / Cancel / EMA Exit notifications with full price details
在腳本中搜尋"reversal"

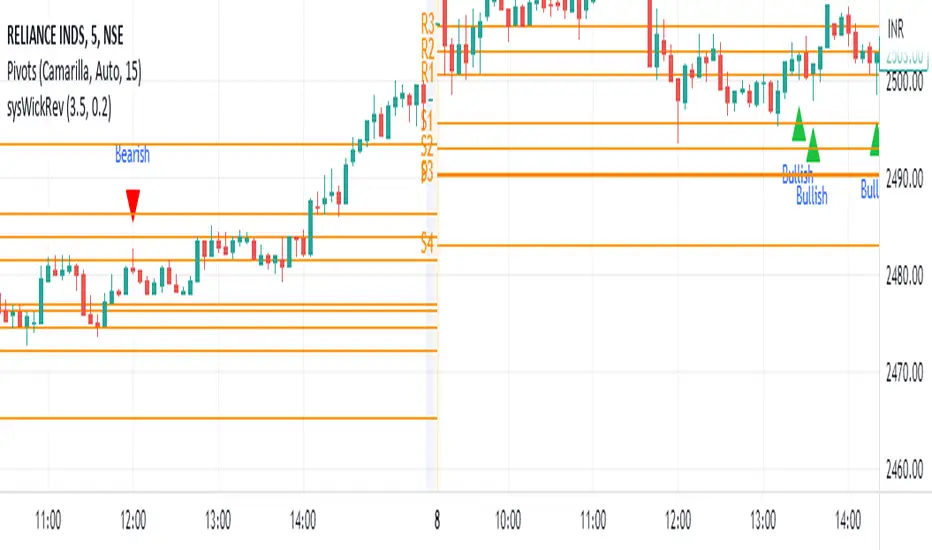
Wick Reversal Indicator - Aligned with "Secrets of a Pivot Boss"The Wick Reversal Indicator is a powerful technical tool developed in accordance with the pseudocode outlined in the book "Secrets of a Pivot Boss" by Franklin O. Ochoa, Jr. This indicator assists traders in identifying potential market reversal points with enhanced precision.
By closely following the principles discussed in the book, the Wick Reversal Indicator evaluates key factors such as candlestick body size, wick length, and the relationship between close and open prices. It provides clear bullish and bearish reversal signals, visualized through triangular markers on the price chart.
Traders can fine-tune the sensitivity of the indicator by adjusting the Wick Multiplier and Body Percentage parameters to match their trading preferences and timeframes. This customization feature ensures adaptability to different market conditions and trading strategies.
With the Wick Reversal Indicator, traders gain an automated and objective tool for identifying potential market reversals, backed by the time-tested methodology presented in "Secrets of a Pivot Boss." It serves as a valuable addition to traders' analysis, aiding in informed decision-making and enhancing trading outcomes.
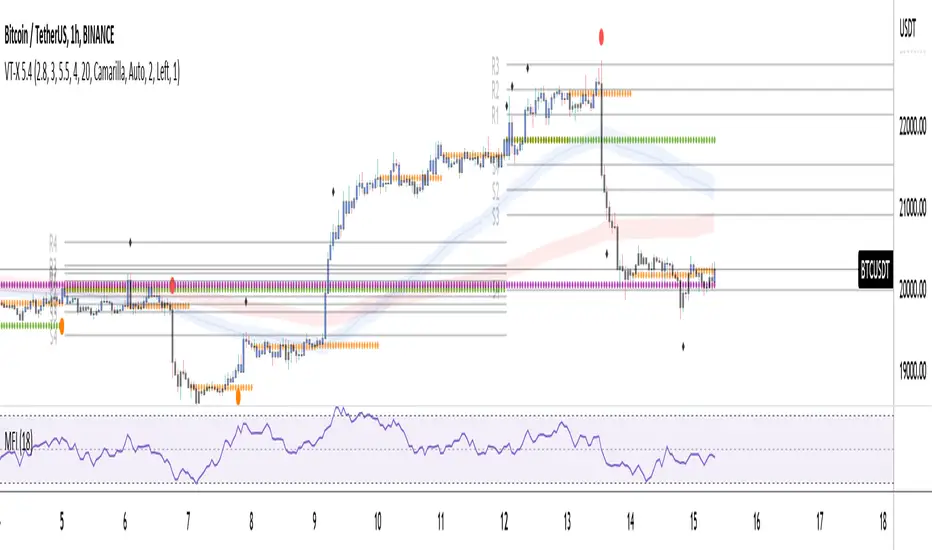
Volume and Trend reversal scalping scriptThe Vtrend X script allows for both trend based and scalping trading entries, it gives you all the trend and reversal information at hand that is necessary. It works best in a trending market.
The fundamental part of the script, is the volume weighted bands in blue and red, which help determine the trend and dynamic support and resistance . The blue band is a shorter length than the red band.
When the blue band dips below the red band, this tells us there is a downtrend. And when the blue band is trending above the red band, this is bullish uptrend price action. You will be able to note price whatever the timeframe really respects these bands, and you can use that to your advantage flicking through the high and low timeframes on where price will go next, combined with your own support and resistance levels.
Combined with the candle colors, which change whether they close above or below the main trend colored line (shown below), help identify a change in price action and trend. This allows for low timeframe plays also.
The uptrend and downtrend cicle signals are shown in a few different colors. Green and red are with the trend and have met all conditions. Orange and purple are against the trend calculations, and Olive circles risky trades against all the filters used to calculate signals.
The reversal signals, are the diamond plots in black, These also represent take profit areas as well.
Another key feature is the Daily / Weekly / Monthly and Yearly open levels displayed as colored dots. A lot of the plays i take use the Daily opens as key levels to take a trade off.
The indicator is designed to give you key information, but be quite customisable as well to suit your exact trading style.
Recommended timeframes i use for this script; Weekly (for key liquidity areas), Trading on the Daily, 6h, 4h, 2h, 1h and 25 minutes.
Backtested Settings and Pairs;
Pair - Timeframe - Signals Inputs - Reversal Inputs - ATR Multiplier - MA Filter
BTCUSD - 1 hr - 3 - 2.8 - 5.5 - NA
ETHUSD - 1 hr - 4 - 2.8 - 5.5 - NA
USDCAD - 1 hr - 4 - 2.8 - 5.5 - NA
GBPUSD - 1 hr - 4 - 2.8 - 5.5 - NA
US30 - 1 hr - 4 - 2.8 - 5.5 - NA
BTCUSD - 4 hr - 2.5 - 2.5 - 3.5 - NA
BTCUSD - 25 mins - 5 - 2.5 - 5.5 - NA
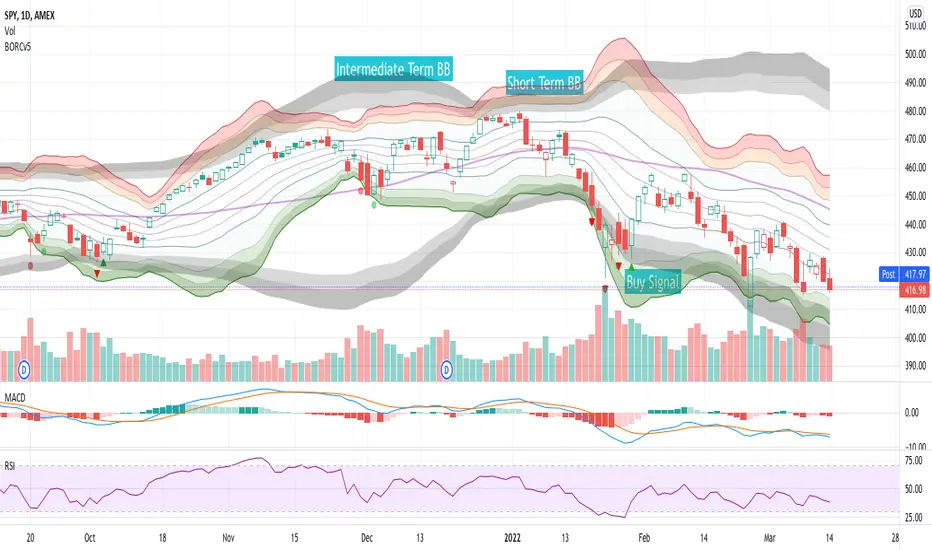
BORCv5: Breakout Reversal, Standard Deviation & Bollinger Bands
The BORCv5 (Breakout Reversal Confirmation) script can improve your trading by visualizing the standard deviation lines & bollinger bands on your chart, along with breakout reversal early warning and confirmation signals which can be interpreted as buy/sell signals.
- BORCv5 utilizes multi-period Bollinger Bands & custom signals to paint a clear picture of price movement.
- BORCv5 works on everything: Futures, Equities, Indices, Crypto, and on any time interval.
The purple line represents the simple moving average (SMA) for the period (default: 20). You can use the EMA instead if you prefer via settings.
The Bollinger bands & trend lines tell you if the stock is trading "high" or "low" relative to its recent price action.
- The inner green/orange/red bands represent short term Bollinger Bands: 1 Standard Deviation (SD), 2SD, 3SD and 4SD
- The grey bands represent intermediate term Bollinger Bands.
The width of the bands changes due to volatility. Narrow Bollinger Bands represent low volatility, where price is relatively flat or trending slowly in one direction. Wide open Bollinger Bands signify either high volatility OR trending powerfully in one direction. If the Bands are pointing downwards it is a bearish trend and if the Bands are pointing upwards it is a bullish trend.
It is important to get the right amount of data (or context) for Bollinger Bands: Too small of a period for basis (5,8,10) and you won't have enough data (or context). Too high of a period and you will have too much data (or context). The right amount of data (or context) is also important because you want to follow averages that algos & other traders follow and you want the Bollinger length to give you enough data to see various standard deviations. Too low of a Bollinger length means the bands deform too easy & too high of a Bollinger length means they are too flat, making the data hard to interpret. We like 20 periods as a compromise between not enough & too much data but you can adjust this value in the script settings.
Breakout Reversal Confirmation Signals:
Pay attention to the triangles: they represent the price movement action of the larger period Bollinger Band that will filter out most of the false breakouts.
Triangles pop up when the price breaches the 2.9 standard deviation, meaning we're in an extreme range leading to a continuation or reversal.
Red Triangle:
- Pointing Down => Bearish Breakout has occurred, watch for a Bullish Reversal
- Pointing Up => Bullish Breakout has occurred, watch for a Bearish Reversal
Green Triangle:
- Pointing Down => Bearish Reversal is confirmed, price has a high chance to move Bearish
- Pointing Up => Bullish Reversal is confirmed, price has a high chance to move Bullish
Red Circle:
- Weak Bearish / Bullish Breakout
Green Circle:
- Weak Bearish / Bullish Reversal Confirmed
For more information, see the BORC PDF guide and examples !
PS: This script was originally published by reaganmcf and has been upgraded to Pine v5.
Combo Strategies 123 Reversal and Absolute Price Oscillator This is combo strategies for get
a cumulative signal. Result signal will return 1 if two strategies
is long, -1 if all strategies is short and 0 if signals of strategies is not equal.
First strategy
This System was created from the Book "How I Tripled My Money In The
Futures Market" by Ulf Jensen, Page 183. This is reverse type of strategies.
The strategy buys at market, if close price is higher than the previous close
during 2 days and the meaning of 9-days Stochastic Slow Oscillator is lower than 50.
The strategy sells at market, if close price is lower than the previous close price
during 2 days and the meaning of 9-days Stochastic Fast Oscillator is higher than 50.
Secon strategy
The Absolute Price Oscillator displays the difference between two exponential
moving averages of a security's price and is expressed as an absolute value.
How this indicator works
APO crossing above zero is considered bullish, while crossing below zero is bearish.
A positive indicator value indicates an upward movement, while negative readings
signal a downward trend.
Divergences form when a new high or low in price is not confirmed by the Absolute Price
Oscillator (APO). A bullish divergence forms when price make a lower low, but the APO
forms a higher low. This indicates less downward momentum that could foreshadow a bullish
reversal. A bearish divergence forms when price makes a higher high, but the APO forms a
lower high. This shows less upward momentum that could foreshadow a bearish reversal.
WARNING:
- This script to change bars colors.

Reversal Radar
**Reversal Radar - Multi-Indicator Confirmation System**
This script combines five proven technical analysis methods into a unified reversal signal, reducing false signals through multi-indicator confirmation.
**INDICATORS USED:**
1. ADX/Directional Movement System
Determines trend direction via +DI and -DI comparison. Signal only during downtrend condition (DI- > DI+). Filters out sideways markets.
2. Custom Linear Regression Momentum
Proprietary momentum calculation based on linear regression. Measures price deviation from Keltner Channel midline. Signal on negative but rising momentum (beginning trend reversal).
3. Williams VIX Fix (WVF)
Identifies panic-selling phases. Calculates relative distance to recent high. Signal when exceeding Bollinger Bands or historical percentiles.
4. RSI Oversold Filter
Default RSI < 35 (adjustable 30-40). Filters only oversold zones for reversal setups.
5. MACD Confirmation
Signal only when MACD below zero line and below signal line. Confirms ongoing weakness before potential reversal.
**FUNCTIONALITY:**
The system generates a BUY signal only when ALL activated filters are simultaneously met. Each indicator can be individually enabled/disabled. Flexible parameter adjustment for different markets/timeframes. Reduces false signals through multi-confirmation.
**APPLICATION:**
Suitable for swing trading on higher timeframes (4H, Daily), reversal strategies in oversold markets, and combination with additional confirmation indicators.
Setup: Activate desired filters, adjust parameters to market/timeframe, check BUY signal as entry opportunity. Additional confirmation through volume/support recommended.
**INNOVATION:**
The Custom Linear Regression Momentum is a proprietary development combining Keltner Channel logic with linear regression for more precise momentum detection than standard oscillators.
**DISCLAIMER:**
This tool serves as technical analysis support. No signal should be traded without additional confirmation and risk management.

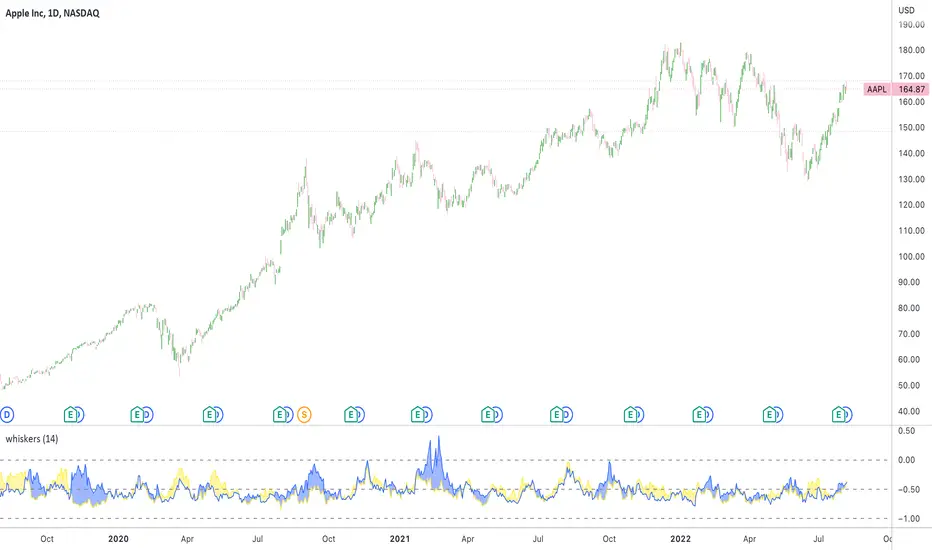
Whisker Reversal Oscillator [SpiritualHealer117]The Whisker Reversal Oscillator can be used to spot strength or weakness in trends. It is designed for stocks, commodities and forex trading, and is intended to be calculated from the high, close, low, and open over a given length.
Features:
The Whisker Reversal Oscillator shows the average length of the top and bottom whiskers on candlesticks over a defined length. It plots the percentage difference between the whiskers and the length of the body, with the yellow line representing the average length of the top whisker, and the bottom line indicating the average length of the bottom whisker.
Interpreting the signals:
The Whisker Reversal Oscillator is interpreted in the same way as a candlestick reversal pattern, where it being bullish or bearish depends on the trend. In a bull trend, if the yellow line passes above the blue line, it means the top whiskers are longer on average than the bottom whiskers, which may show that bulls were too weak to hold a rally, and signal a reversal. On the other hand, in a bear trend, if the yellow line is above the blue line, it indicates that the bulls were able to push the price up, which would be bullish. If the blue line crosses over the yellow line in an uptrend, it's often a bearish sign, but if it happens in a downtrend, its a bullish sign.
Generally speaking, a cross in the lines is indicative of a potential reversal, and when the lines cross over 1, it means that the whiskers were bigger than the candlestick bodies over your selected length, indicating that a big swing will come.
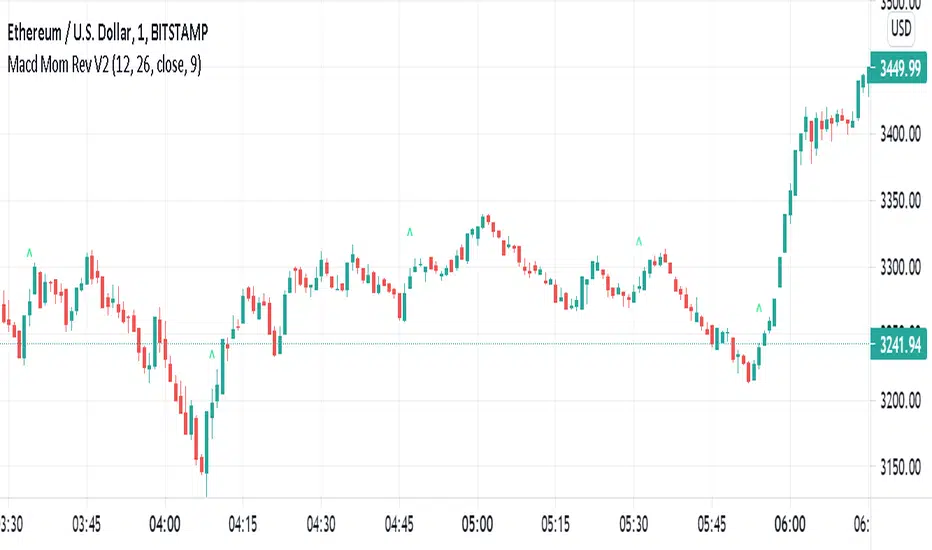
Simple Macd Momentum Reversal IndicatorThis Simple indicator uses the MACD history to check trend reversals. It primarily check if the histogram has moved up from a downtrend above a certain margin. If it has, it places a green B on the chart. If you were to use/improve this indicator, please use it with other indicators to confirm your position. This is NOT an indicator that can be well used alone.
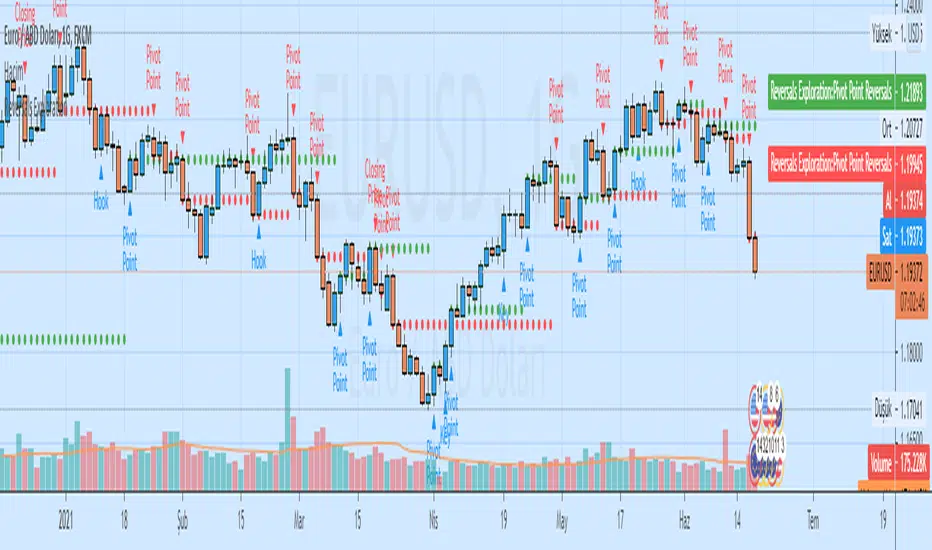
Auto Analysis Short-term Reversals ExplorationAuto Analysis Short-term Reversals Exploration
Based on a study by Larry Lovrencic
Closing Price Reversals Automatic Analysis
Hook Reversals Automatic Analysis
Island Reversals Automatic Analysis
Key Reversals Automatic Analysis
Open/Close Reversals Automatic Analysis
Pivot Point Reversals Automatic Analysis
TheStratHelper-Short Reversalsbased on the teachings of Rob Smith
1= Inside Candle
2= Break on one side
3= Englufing Candle/Outside Candle
Identifies short setups like 212, 312, 122 and 22
My potential entry is marked with a green line and a label that tells you the price as well. I typically enter 1 or 2 cents belowthe marked entry.
My potential target (magnitude) is marked with yellow lines and a label that tells you the price as well.
212, 312 and 122 has entry and magnitudes marked. If there are multiple magnitudes, those are marked with yellow lines which has the price written right above them. The program looks at potentially 4 or 5 magnitudes.
No magnitudes marked for a reversal 22.
Most of the colors can be customized
PM me for more info on how to access this indicator

TheStratHelper-Long Reversalsbased on the teachings of Rob Smith
1= Inside Candle
2= Break on one side
3= Englufing Candle/Outside Candle
Identifies long setups like 212, 312, 122 and 22
My potential entry is marked with a green line and a label that tells you the price as well. I typically enter 1 or 2 cents above the marked entry.
My potential target (magnitude) is marked with yellow lines and a label that tells you the price as well.
212, 312 and 122 has entry and magnitudes marked. If there are multiple magnitudes, those are marked with yellow lines which has the price written right above them. The program looks at potentially 4 or 5 magnitudes.
No magnitudes marked for a reversal 22.
Most of the colors can be customized
PM me for more info on how to access this indicator

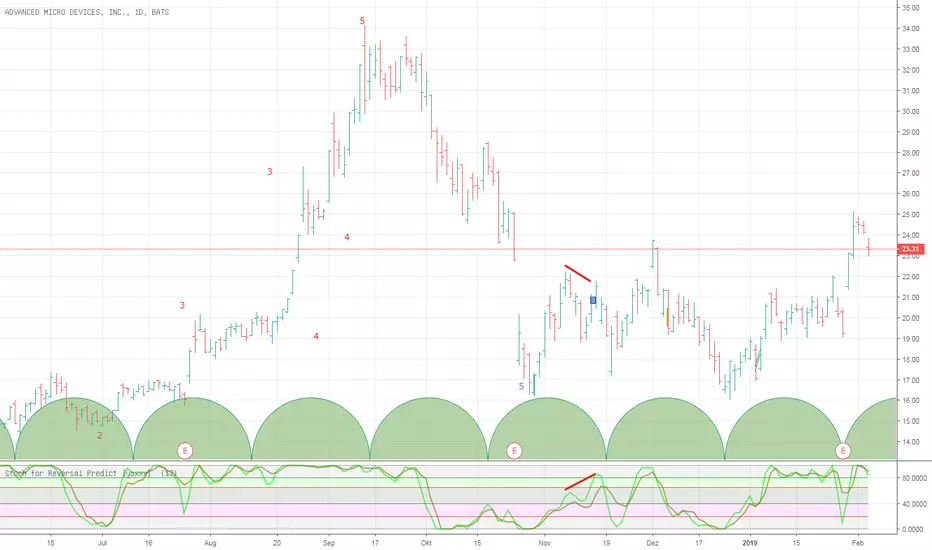
Stochastic for Reversal Predict [yoxxx] Usable for all markets, all time frames. (The bull bear sup/res lines are specific for stocks, but differ just a little to other instruments.)
This script is more likely a method support than a study - and your exit from the default stochastic club:
Most people use Stoch for ins and outs by 20 rsp 80 (a default behavior MM know well to deal with). C.G. Lane, the inventor of this indicator,
however used it to find divergences with quote (price / close) to predict reversals. Constance Brown refined this method by laying
a fix time cycle underneath the chart that is in rhythm with specific highs or lows of a stock or an index.
The length of one cycle divided by 2 equals the proper value for %D specified for that stock /index. The script offers an input for this specific value.
C. Brown stresses that good signals are only given within the bull or bear ranges (20-65 for bear markets, 40-80 for bull markets).
For your convenience, I laid these areas underneath the graphs. You can automate the divergence research (relative to quote)
by using my script "Bull Bear Divergence Indicator". Feedback welcome. Have fun and success.
Bar Trends & Reversals Emiliano MesaThe most advanced code made by me yet! Simple but extremely useful, based on "Reading Price Charts Bar by Bar" - Al Brooks. This indicator will highlight when the market is trending (green). Highlight reversal bars(red) and also bull/bear traps (yellow). I was not sure if to give away this indicator for free, but here it is.
Hopefully you guys enjoy it!
Interested in your own indicator? Email me here for business inquires : emilianomesauribe2000@live.com
(starting price 100$)
I DO NO TAKE RESPONSIBILITY FOR LOSSES. USE INDICATOR UNDER YOUR OWN MEANS
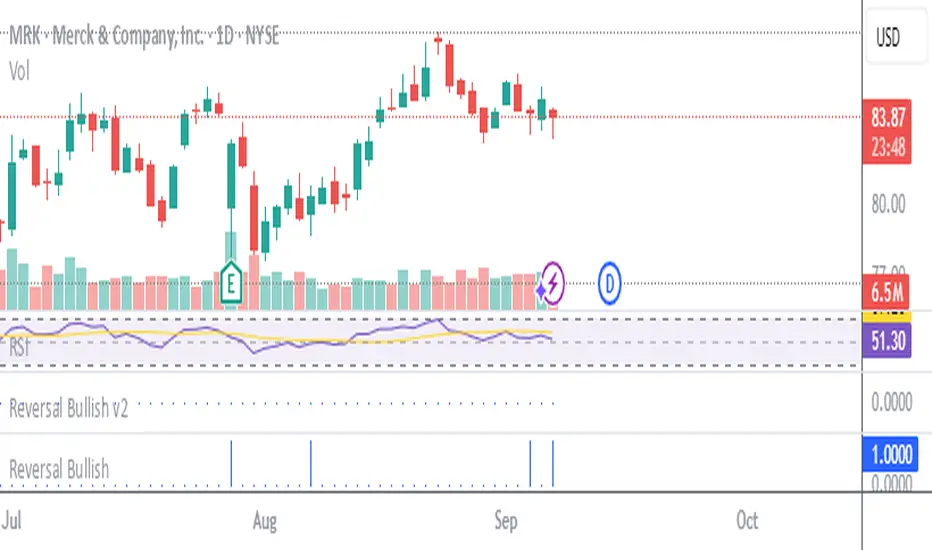
Stockbee Reversal Bullish v2Custom indicator for identifying stocks that meet the Stockbee's Reversal Bullish New criteria. This can be used as a standalone indicator or use it to screen for stocks in Pine Screener.

Stockbee Reversal BullishCustom indicator for identifying stocks that meet the Stockbee's Reversal Bullish criteria. This can be used as a standalone indicator or use it to screen for stocks in Pine Screener.
Combo Strategy 123 Reversal & Fisher Transform Indicator This is combo strategies for get a cumulative signal.
First strategy
This System was created from the Book "How I Tripled My Money In The
Futures Market" by Ulf Jensen, Page 183. This is reverse type of strategies.
The strategy buys at market, if close price is higher than the previous close
during 2 days and the meaning of 9-days Stochastic Slow Oscillator is lower than 50.
The strategy sells at market, if close price is lower than the previous close price
during 2 days and the meaning of 9-days Stochastic Fast Oscillator is higher than 50.
Second strategy
Market prices do not have a Gaussian probability density function
as many traders think. Their probability curve is not bell-shaped.
But trader can create a nearly Gaussian PDF for prices by normalizing
them or creating a normalized indicator such as the relative strength
index and applying the Fisher transform. Such a transformed output
creates the peak swings as relatively rare events.
Fisher transform formula is: y = 0.5 * ln ((1+x)/(1-x))
The sharp turning points of these peak swings clearly and unambiguously
identify price reversals in a timely manner.
WARNING:
- For purpose educate only
- This script to change bars colors.
My VWAP Reversal + Pivot Points StandardThis indicator, with the addition of a standard VWAP indicator to the 5m chart, helps the operator when using a closing candle Price to initiate a VWAP Reversal strategy.
The strategy involves Price gapping up, look for a Close below the 1st 5m candle Low; else look for a Close above the 1st 5m candle High. On a break of VWAP, take the trade in the opposite direction of the gap, hence the VWAP Reversal. Not my own strat, credit to T3 Newsbeat, publicly posted on YouTube.
The Pivot Points Standard in the Pine 4 user manual, was the base source code, and leaving it here will allow me to remove the PP indicator I was using.

Combo Strategies 123 Reversal and Accelerator Oscillator (AC) This is combo strategies for get
a cumulative signal. Result signal will return 1 if two strategies
is long, -1 if all strategies is short and 0 if signals of strategies is not equal.
First strategy
This System was created from the Book "How I Tripled My Money In The
Futures Market" by Ulf Jensen, Page 183. This is reverse type of strategies.
The strategy buys at market, if close price is higher than the previous close
during 2 days and the meaning of 9-days Stochastic Slow Oscillator is lower than 50.
The strategy sells at market, if close price is lower than the previous close price
during 2 days and the meaning of 9-days Stochastic Fast Oscillator is higher than 50.
Second strategy
The Accelerator Oscillator has been developed by Bill Williams
as the development of the Awesome Oscillator. It represents the
difference between the Awesome Oscillator and the 5-period moving
average, and as such it shows the speed of change of the Awesome
Oscillator, which can be useful to find trend reversals before the
Awesome Oscillator does.
WARNING:
- This script to change bars colors.
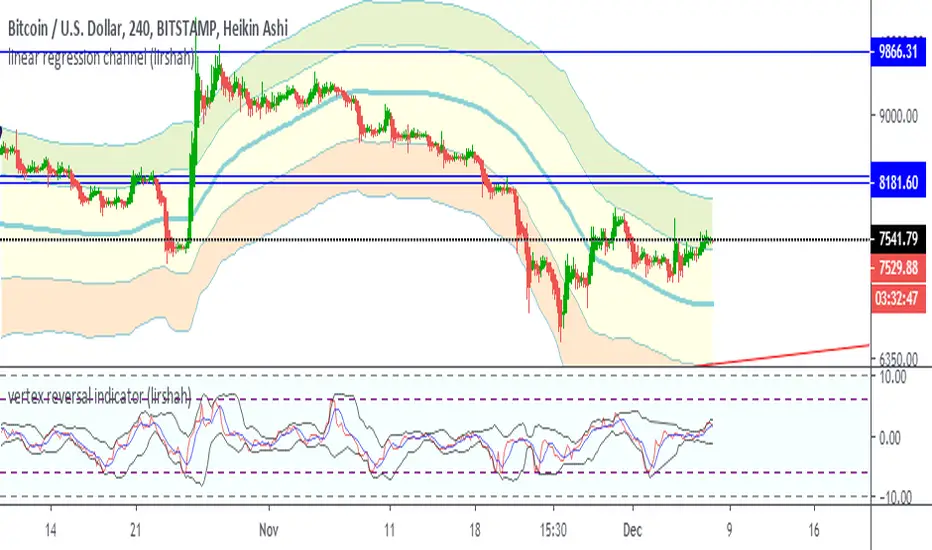
vertex reversal indicator (lirshah)Vertex reversal Indicator is a combined oscillator that combines of several indicators : Momentum, Moving Averages and Bollinger Bands , which makes it possible to accurately predict the trend reversal.
the calculation of this indicator has been written based on the current bar interval so it dose not repaint on any time frame.
the indicator has shown good performance on different markets and can be reliable.
Reversal Radar (ConfluenceJP)Reversals Bullish to help see the trend coming when it is difficult to see. Nothing Guaranteed just another tool to help.
Reversal Pro v2 Reversal Pro v2 + Kernel Trend Line
© HighlanderOne – 2025
The ultimate confluence of institutional liquidity grabs + adaptive trend filtering.
Core Strategy – V-Reversal (Liquidity Sweep + Reclaim)
This indicator detects when price makes an aggressive move that sweeps nearly all recent lows (or highs) in the last 20 candles — a classic smart-money stop-hunt.
Once the sweep candle is identified, it waits for price to reclaim above the sweep low (bullish) or below the sweep high (bearish) within the next few bars.
That reclaim is the exact moment the real directional move begins.
Key improvements over classic versions:
• Uses ≥ (lookback – 2) instead of strict equality → catches more real sweeps without adding noise
• Optional true non-repainting mode (signal appears only on the close of the confirmation bar)
• Extremely clean, high-probability reversal signals (usually 2–6 per week on 1h–4h)
Smoothed Kernel Regression Trend Line (exactly like the legendary KTrend)
A secondary rational-quadratic kernel regression is plotted on top with a Gaussian lag filter.
The line changes colour based on short-term vs long-term kernel relationship:
• Teal/Green → Uptrend confirmed
• Maroon/Red → Downtrend confirmed
How to trade it (my exact rules – the way I actually use it every day)
Entry Rules
Long: Green V appears + Kernel line is green or turns green within 1–2 bars
Short: Red V appears + Kernel line is red or turns red within 1–2 bars
Trade Management – Stay in the trade using the Kernel line
• Trail your stop under the Kernel line (for longs) or above it (for shorts)
• Never exit just because of a new opposite V — wait for the Kernel line to actually change colour
• If the Kernel line stays your colour for 10–20+ bars, let the trade run — these become the massive 5:1 – 15:1 winners
• Only exit early if the Kernel line flips colour — that is your objective “trend over” signal
Best timeframes
• 15m & 1h → scalping / day trading
• 4h & Daily → swing trading monsters
Best markets
Works insanely well on: BTC/USD, ETH/USD, NAS100, SPX500, Gold, EURUSD, GBPUSD, USDJPY
This is not just another reversal indicator.
It’s institutional order-flow detection + adaptive trend filtering in one clean script.
High win-rate entries.
Objective trend-based exits.
Zero repainting (when enabled).
Pure price action.
Trade it exactly as described and you will never need another reversal system again.
Enjoy the edge.
– HighlanderOne

Reversal Entries [akshaykiriti1443]Reversal Entries : An In-Depth Guide
This indicator is designed to identify high-probability trend reversal points. Its primary goal is to pinpoint moments where the price attempts to break a key level, fails, and then snaps back with force. These "fakeouts" or "liquidity grabs" are often powerful signals that the market is about to reverse course.
The indicator provides two clear signals:
* 🟢 **A Bullish "Bounce Point"**: A potential buy signal after price dips below support and recovers.
* 🔴 **A Bearish "Rejection Point"**: A potential sell signal after price spikes above resistance and is pushed back down.
---
## The Core Logic: What Makes a Signal?
The indicator doesn't just look at one factor. Instead, it requires **three key conditions** to be met simultaneously before it generates a signal. This multi-layered approach helps filter out noise and identify only the most promising setups.
### 1. The Price Action "Fakeout" 🕵️♂️
This is the foundation of the signal. The indicator first identifies a short-term support or resistance level.
* **Support:** The lowest price over the `Lookback` period.
* **Resistance:** The highest price over the `Lookback` period.
It then waits for a specific pattern:
* For a **Bullish Bounce**, the current candle's low must dip **below** the support level, but its closing price must be **above** that same support level. This shows that sellers tried to push the price down but buyers stepped in with overwhelming force.
* For a **Bearish Rejection**, the current candle's high must poke **above** the resistance level, but its closing price must be **below** that same resistance level. This shows that buyers tried to break out, but sellers took control and slammed the price back down.
### 2. Volume Confirmation 🔊
A true reversal is almost always accompanied by a surge in trading activity. The indicator confirms the price action by checking for a **volume spike**.
It calculates the recent average volume and only accepts the signal if the volume on the reversal candle is significantly higher than that average (the default is 1.5 times higher). This confirms that there is real conviction and money behind the move, making it much more reliable.
### 3. Recovery Strength & Probability Score 💯
This is the indicator's "secret sauce." It doesn't just see a reversal; it measures *how strong* that reversal is.
* **Measuring the Recovery:** It uses the Average True Range (ATR) to measure the size of the price's recovery. For a bullish bounce, it measures the distance from the candle's low to its close. For a bearish rejection, it measures the distance from the high to the close. A long wick in the direction of the reversal signifies a powerful rejection of lower or higher prices.
* **Calculating a Probability Score:** The indicator takes the volume spike confirmation and the recovery strength and feeds them into a mathematical formula (a sigmoid function) to generate a "probability score" between 0 and 1. Think of this as a confidence score.
* **Applying the Threshold:** A signal is only plotted on your chart if this confidence score is above the `Probability Threshold` (default is 0.7, or 70%). This is the final filter that ensures only high-conviction setups are shown.
---
## How to Use the Indicator in Your Trading
This indicator provides entry signals, but it should be used as part of a complete trading plan.
### Understanding the Signals
* **Green `+` (Bounce Point):** When you see this signal below a candle, it's a potential **BUY entry**. It suggests that the downward momentum has been rejected and the price may be ready to move higher.
* **Red `-` (Rejection Point):** When you see this signal above a candle, it's a potential **SELL entry**. It suggests that the upward momentum has failed and the price may be ready to fall.
### Example Trading Strategy
1. **Entry:** Enter a trade when a signal appears. For a green `+`, place a buy order. For a red `-`, place a sell order.
2. **Stop Loss:** A logical stop loss is crucial.
* For a **buy trade**, place your stop loss just below the low of the signal candle. If the price breaks this low, the reversal idea is invalidated.
* For a **sell trade**, place your stop loss just above the high of the signal candle. If the price breaks this high, the setup has failed.
3. **Take Profit:** Your take profit should be based on your own strategy. A common approach is to target the next significant support or resistance level or use a fixed risk-to-reward ratio (e.g., 1:1.5 or 1:2).
**Important:** Always consider the overall market context. These signals tend to be more powerful when they align with the broader trend or occur at major, higher-timeframe support and resistance zones.
---
## Customizing the Settings
You can fine-tune the indicator's sensitivity in the settings menu to match your trading style and the asset you are trading.
* **`Support/Resistance Lookback`**: Controls how far back the indicator looks to find support and resistance. A **smaller number** makes it more sensitive to very recent price action. A **larger number** will focus on more significant, longer-term levels.
* **`Volume Spike Multiplier`**: Defines what counts as a "spike." Increasing this value (e.g., to 2.0) will demand a much larger volume surge, leading to fewer but potentially more reliable signals.
* **`ATR for Recovery`**: This sets the period for the ATR calculation, which is used to measure the recovery strength. It's generally best to leave this at its default unless you are an advanced user.
* **`Probability Threshold`**: This is the most important sensitivity setting.
* **Increase it** (e.g., to 0.85) for fewer, very high-quality signals.
* **Decrease it** (e.g., to 0.60) to see more potential setups, though some may be less reliable.

Mayfair Reversal Change✅ Mayfair Reversal Change — By EastWave Capital
Description:
The Mayfair Reversal Change indicator is a tool designed to help traders identify potential market turning points using Stochastic Oscillator behavior and filtered price action logic. It acts as a reversal signal filter and is particularly effective when the market is overextended (overbought/oversold) and about to revert from exhaustion zones.
🔍 How It Works:
This script monitors the Stochastic %K and %D crossovers and adds a custom logic layer to filter only high-quality reversal points:
Stochastic Filter Conditions:
Uses smoothed stochastic settings:
%K smoothing = 3
%D smoothing = 3
Only shows signals after %K crosses back below 80 (for Sell) or above 20 (for Buy)
This prevents signals from appearing too early during an active overbought or oversold phase.
Directional Confirmation Logic:
Bullish signal is printed only when %K re-enters below 20 after a confirmed stochastic crossover.
Bearish signal appears only when %K re-enters above 80.
This reduces false signals that occur during continued trending moves.
Toggle Switch:
A user-toggle input is included to enable or disable the reversal filter logic.
This gives flexibility for traders who want to test signals with or without the stochastic condition.
📈 How to Use:
Timeframes: Recommended for 5M, 15M, and 30M
Markets: Compatible with any market — FX, Gold, Indices, Crypto
Entry Approach:
Wait for signal after price has reached a potential extreme area.
Confirm with chart structure, support/resistance, or SMC zone.
Enter on confirmation, placing stop loss beyond the swing high/low.
Combine with trendline breaks or price imbalances (FVG) for extra confluence.
Can be used in combination with the Mayfair FX Scalper script for dual-layer confirmation.
⚠️ Important Notes:
Signals are visual only and should be confirmed with proper strategy.
This indicator does not execute or manage trades automatically.
Designed to assist with reversal setups but should not be used in isolation.
Always manage risk, use SL/TP, and avoid over-leveraging.
