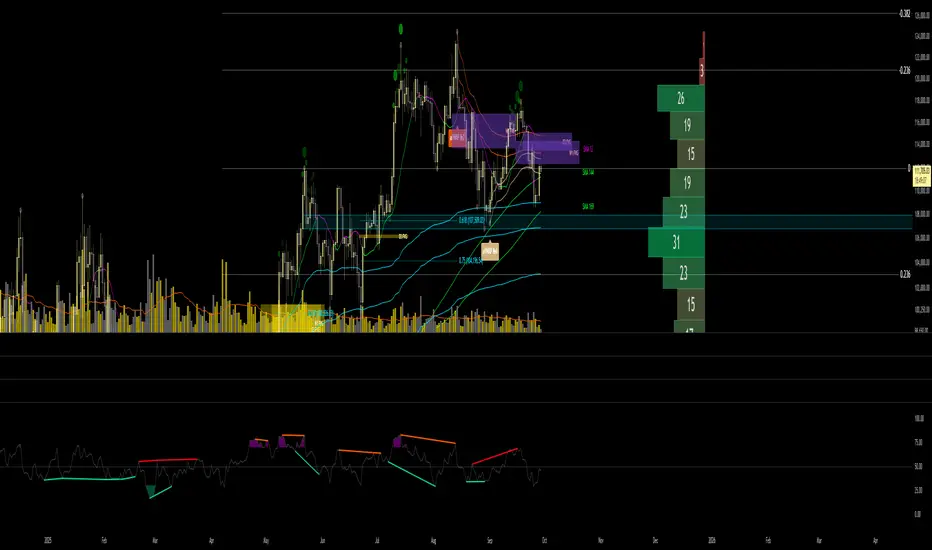
Momentum Matrix (BTC-COIN)The Momentum Matrix (BTC-COIN) indicator analyzes the momentum relationship between Coinbase stock ( NASDAQ:COIN ) and Bitcoin ( CRYPTOCAP:BTC ). By combining RSI, correlation, and dominance metrics, it identifies bullish and bearish macro trends to align trades with market momentum.
How It Works
Price Inputs: Pulls weekly price data for CRYPTOCAP:BTC and NASDAQ:COIN for macro analysis.
Metrics Calculated:
• RSI Divergence: Measures momentum differences between CRYPTOCAP:BTC and $COIN.
• Price Ratio: Tracks the $COIN/ CRYPTOCAP:BTC relationship relative to its long-term average (SMA).
• Correlation: Analyzes price co-movement between CRYPTOCAP:BTC and $COIN.
• Dominance Impact: Incorporates CRYPTOCAP:BTC dominance for broader crypto trends.
Composite Momentum Score: Combines these metrics into a smoothed macro momentum value.
Thresholds for Trend Detection: Upper and lower thresholds dynamically adapt to market conditions.
Signals and Visualization:
• Buy Signal: Momentum exceeds the upper threshold, indicating bullish trends.
• Sell Signal: Momentum falls below the lower threshold, indicating bearish trends.
• Background Colors: Green (bullish), Red (bearish).
Strengths
Integrates multiple metrics for robust macro analysis.
Dynamic thresholds adapt to market conditions.
Effective for identifying macro momentum shifts.
Limitations
Lag in high volatility due to smoothing.
Less effective in choppy, sideways markets.
Assumes CRYPTOCAP:BTC dominance drives NASDAQ:COIN momentum, which may not always hold true.
Improvements
Multi-Timeframe Analysis: Add daily or monthly data for precision.
Volume Filters: Include volume thresholds for signal validation.
Additional Metrics: Consider MACD or Stochastics for further confirmation.
Complementary Tools
Volume Indicators: OBV or cumulative delta for confirmation.
Trend-Following Systems: Pair with moving averages for timing.
Market Breadth Metrics: Combine with CRYPTOCAP:BTC dominance trends for context.
Pine Script®指標