PpSignaldouble rsi cross alertthis indicator is rsi open and rsi close in the same chart and qqe move average.
open is green rsi line and close is red, when close is above open and qqe ma is blue for examples is a good signal, and vice-versa.
have got oversold and overbought background alert too.
Consider rsi divergences and the trend before entering to the market
Buy when rsi is oversold and qqe ma is in blue color.
sell when the rsi is overbought red background and qqe is red.
在腳本中搜尋"rsi divergence"

Algorithm Builder - Multiple Trends+ (Plug & Play)Hello traders
I. SCRIPTS ACCESS AND TRIALS
1. For the trial request access, they have to be done through my website .
2. My website URL is in this script signature at the very bottom (you'll have to scroll down a bit and going past the long description) and in my profile status available here : Daveatt
Due to the new scripts publishing house rules, I won't mention the URL here directly. As I value my partnership with TradingView very much, I prefer showing you the way for finding them :)
3. You may also contact me directly for more information
II. Algorithm Builder - Multiple Trends
2.1 Forewords
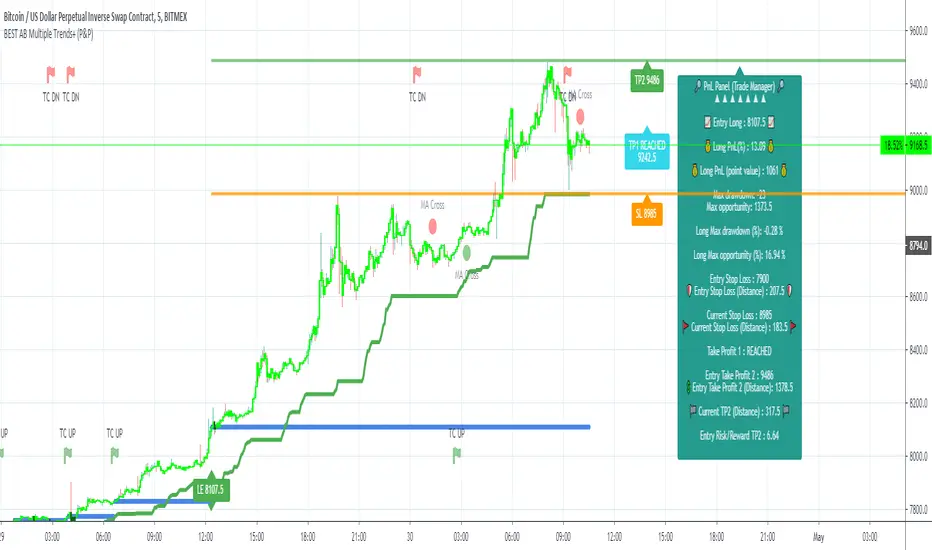
The Multiple Trends+ is the update of the Multiple Trends and includes a built-in Trade Manager and PnL/Risk-Reward Panel
This indicator is available only to our PREMIUM users. Our PREMIUM indicators offer more trading analysis capabilities and opportunities.
A few words of caution: the Algorithm Builders - Multiple Trends are more advanced and as such, would require slightly more time to be mastered.
They're not that much difficult, but we understand that designing a trading system with 2 trends might be slightly more complicated - however, there is nothing to be scared of :).
The time spent to learn how to use our PREMIUM tools might be rewarded handsomely.
2.2 Concept
The Algorithm Builder - Multiple Trends is made to detect the convergence of many unrelated indicators and give a BUY or SELL signal whenever all the selected sub-indicators are converging in the same direction.
This is an upgrade of the PRO package giving access to the Algorithm Builder - Single Trend - designed to show 1 unique entry per trend - whereas the Multiple Trends offers re-entries in the same direction of the trend if the indicator detects good convergences to accumulate more positions.
III. Plug & Play
Hope you're ready to be impressed. Because, what I'm about to introduce, is my best-seller feature - and available across many of my indicators.
In TradingView, there is a feature called "Indicator on Indicator" meaning you can use an external indicator as a data source for another indicator.
I'm using that feature to connect any external indicator to our Algorithm Builder Multiple Trends+ Plug & Play (hence the plug and play name).
Let's assume we have an RSI divergence indicator - which is not part of the Algorithm Builder - but noticed that the convergence of an RSI divergence and a MACD gives strong signals.
I mentioned an RSI divergence, but you may connect any oscillator (MACD, On balance volume, stochastic RSI, True Strenght index, and many more..) or non-oscillator (divergence, trendline break, higher highs/lower lows, candlesticks pattern, price action, harmonic patterns, ...) indicators.
THE SKY IS (or more likely your imagination) is the limit :)
Fear no more. The Plug&Play technology allows you to connect it and use it in the convergence/confluence calculations.
Hence, whenever the MACD and RSI divergence will be in the same direction every time you'll get a convergence.
PS: Whereas it's only the first time only because this is a Single trend edition.
To connect your external indicator to ours, we're using a native TradingView feature, which is not available for all users.
It depends on your TradingView subscription plan ( More info here )
If you intend to use our Algorithm Plug&Play indicator, and/or our Backtest Plug&Play suites, then you must upgrade your TradingView account to enjoy those features.
We value our relationship with our customers seriously, and that's why we're warning upfront you that a compatible TradingView account type is required - at least PRO+ or PREMIUM to add more than 1 Plug&Play indicator per account.
We go in-depth on our website why the Plug&Play is an untapped opportunity for many traders out there - URL available on my profile status and signature
IV. Multiple Trends versus Single Trend
4.1 Multiple Trends benefits
A friend asked us recently Why using the Multiple Trends if we can use the Single Trend in a smaller timeframe, and get more entries that way?
We thought this was an excellent question, but the answer is obvious.
Using a Single Trend on a smaller timeframe to solely getting more entries will reduce the security of the given trades.
We designed the Algorithm Builders to take a trade in an identified trend but reducing the timeframe too much will mostly increase your risk - and might lead to capital loss.
By the way, this is a universal rule valid also for a big majority of indicators.
We're absolutely not saying that the Single Trend won't work on small timeframes because actually it really does. But, if you find out a great configuration for your Single Trend, and want to get more signals without increasing your risk - then the Multiple Trends would be a very viable option.
4.2 Main signal versus secondary signals
For the main and secondary trends, the color green symbolizes any identified "BUY" trend. And the color red symbolizes any identified "SELL" trend.
-The MAIN trend symbol is unique and symbolized by a triangle.
- The SECONDARY (could also be called re-entries) trends are multiple and symbolized by a diamond.
In the Algorithm Builder indicator settings, they're identified with the Additional keyword.
4.3 How the convergences are calculated
Extremely important: The diamonds (or re-entries) are displayed, as long as a triangle (or main/primary signal) is displayed.
For a trend change (buy to sell or sell to buy), the system waits for ALL selected re-entries sub-indicators , to give a convergence/confluence in the opposite direction.
For example, let's assume a BUY/green convergence based on 3 indicators. One or Two of them going turning red, won't be enough for a trend change.
But, if all of them turn red, then we'll see a red triangle - signaling the beginning of a new downtrend.
4.4 Why multiple entries?
Here are a few use cases :
1. The main use case why we made those Multiple Trends indicators: A trader got invalidated or stopped out on a trade, but wants a system to let hin/her jump back in with a minimum of security. (security depending on the configuration of the Algorithm Builder as a whole).
This is very frustrating to get in a trade, being stopped out, and finally, see the trade going in the expected direction.
Even more frustrating to jump back in at the end of a trend, and get stopped out again - we all agree on this.
2. You want to add more positions on your main trade as your Algo Builder identified a solid trend - this is a nice way to possibly maximize your gains.
Once again, we don't/won't guarantee any performance result (not because we don't believe in our tools, but for legal reason), all depends on the time spent reading our documentation and playing with the Algo Builder - as explained on our Tutorials.
More info available on our website. URL available in this script signature and on my profile status.
V. Why the Algorithm Builder Multiple Trends+ may help you
I worked with many traders during my career, and their feedback about trading is often pretty similar.
They all tried a lot of complicated indicators, losing their capital, and finally getting back to the basics (even to the basic indicators if I might say)
The art is finding a good combination of indicators and setting strict money/risk management rules.
Easy in concept, but more than 90+% of traders lose money on the markets... which teach us that trading is not only about drawing trendlines, or using cool indicators but finding ways to ease our psychology while trading.
5.1 The Algorithm Builder trading framework
The sub-indicators (full list on our website) weren't chosen randomly. They're based on a trading method we've developed over the last 6 years - while working with traders and other trading quants.
The Algo Builders are made to detect a convergence - and as such, will give a signal once a trend has been identified.
They're not made to detect reversal but have been designed to give a signal when all sub-indicators are either ALL bullish (green) or ALL bearish (red).
We provide a framework based on indicators we selected because they:
1. make sense to be used altogether
2. work on asset classes like INDEX, CRYPTO, STOCK OPTIONS, FOREX, COMMODITIES
3. it may expand your knowledge about what detecting a convergence with pre-selected indicator really means
5.2 Supports and Resistances
The indicator displays the main algorithmic supports and resistances according to our trading method.
I think they're relevant for all asset classes, but you're absolutely free to use any different supports/resistances logic if you want to.
I'm not against it because I know that pivots, Fibonacci levels, etc. may work very well also.
5.3 Choose your favorite risk management algorithm
1/ Pre-defined Algo S/R method using:
- a supertrend of the stop-loss
- the nearest algorithmic resistances for the take profit levels.
2/ Define your own Stop-loss and Take-profits level in real-time
Stop-Loss Management
For what's following, let's assume that 2 is the stop-loss value you inserted in the indicator, and the Algorithm Builder gives a BUY signal.
This is NOT a recommendation at all, only an example to explain how this feature works.
- %Trailing: The Stop-Loss starts 2% away from the entry price - and will move up (because we're on a BUY trade as per our example) every time your trade will gain 2% profit
- Percentage: The Stop-Loss stays static 2% away from the entry price. There is no trailing here
- TP Trailing: This is a very awesome feature. The stop-loss is set 2% away when the trades start.
When the TP1 is hit, the stop-loss will be moved to the Entry price (also called breakeven).
When the TP2 is hit, the SL is moved to the previous TP1 position
- Fixed: Set the Stop-Loss at a fixed position (value should be in currency/units)
Take Profits Management
You can manage up to 2 take profit levels defined as a percentage or price value.
The expected input is in percentage value (for instance, setting the % target of TP1 to 2% will set the TP1 level 2% away from the entry price
5.4 Built-in Trade Manager
This is very likely the most loved utility script that we shared on TradingView.
It's included in your Algorithm Builder - Single Trend+, and will certainly help you immensely to analyze your charts and your trades.
We made sure that all the graphical elements on the chart will be updated in real-time whenever our user change anything on the indicator configuration.
You'll also be able to change the Trade Manager labels positions as you wish :)
5.5 Built-in Risk-to-Reward Panel
The good stuff doesn't stop here.
You'll notice that this sometimes green (when in a LONG), sometimes red (when in a SHORT) panel at the right of your chart.
It displays for the selected trading algorithmic (see 2.3.2 above), a ton of useful real-time analytics.
- Entry Price: the price when the Algorithm Builder will give a signal.
- The Trade PnL in percentage.
- Entry Stop Loss: Distance (in currency/units) between the selected stop-loss algorithm (percent, trailing, TP trailing, etc.) and the entry price.
- Entry TP1: Distance (in currency/units) between the entry price and the first take profit
- Entry TP2: Distance (in currency/units) between the entry price and the second take profit
- Risk/Reward TP1: Using the Stop-loss distance at entry, and Take Profit 1 at entry to compute the risk-to-reward ratio.
- Risk/Reward TP2: Using the Stop-loss distance at entry, and Take Profit 2 at entry to compute the risk-to-reward ratio.
For more details, please check the guides section of my website. Links are in my signature and profile status.
5.6 Built-in PnL real-time calculations
YES!!!! you read it correctly
The panel displays the risk-to-reward ratios but also the PnL (Profit and Loss in percentage value) of the current and last trade
5.7 Hard Exits
Our trading method is known for the hard exits, also called invalidation.
The Single Trend+ includes a hard exit based on a MACD - settings are flexible and you may update them.
Having a stop-loss protecting your trade is a best practice - Protecting your stop-loss also from getting hit is incredible.
We prefer invalidate a few positions, even if sometimes we don't want to. Rather than the market hard exiting on us, and leaving with our hard-working money.
5.8 Alerts
Alerts are enabled for:
- BUY/SELL MAIN triangles signals
- BUY/SELL SECONDARY diamond signals
- Trade Manager alerts (Stop Loss, Take Profit 1, Take Profit 2)
- Hard Exits
VI. Pain points that we're trying to solve with our Algorithm Builders
Issue #1 There are many informations / indicators / strategies / backtests / noise. Finding the right ones is not a simple task.
Solution #1 A reliable system that removes the external noise is much needed in trading to stay "in the game".
Issue #2 Trading could be quite stressful - The majority doesn't lose in trading because technical analysis is hard, but because managing our psychology is one of the hardest things a human can do.
Solution #2 Some ways to reduce the "trading stress" could be: getting better quality signals and trading like a "machine". Forgetting about Twitter and trusting the system you designed.
Issue #3 Trading without strict rules and only based on what we feel, or what we think the market should do is the fastest way to kiss our money goodbye.
Only 1 indicator generally is not enough. Traders generally use a combination of several indicators but they're monitoring them individually.
It's normal then to feel exhausted at the end of the day ^^ (to say the least)... and exhaustion leads to mistakes which leads to..... (I'm sure you got it) ... capital loss.
Solution #3 As a trader, I needed a trading framework and a method. I offer our trading method but they're plenty others out there. We cannot claim obviously it's the best ever ....but let's say we're using those exact same
scripts ourselves for our trading. And this what we've been recommending our clients to trade with for the past years. Also, having a tool detecting the convergence of several indicators and giving 1 unique signal
for BUY/SELL position will save you a lot of time/energy, and perhaps might help you out getting better trading performance.
VII. Resolving a complex puzzle and having fun in the process
Trading has to stay a passion and not (only be) a source of intense stress.
The most successful traders I know are "trading geeks" - literally always looking for optimizing, searching for the best possible entries, setups, indicators, tools, etc.
For them, it's not even about the money anymore, but only about beating their previous performance.
Why are they doing this? Because it's fun
Might appears as a bold statement, but I guarantee that looking for setups is fun.
One of our users even told us, that it's like playing with "Legos" and we couldn't possibly agree more.
VIII. Designing a system that "makes sense"
Another bold statement now. Brace yourselves ladies and gentlemen
The Algorithm Builders allow to design trading systems quickly. What could takes days/weeks/months to find out... might be now within your reach in less than a few hours.
With a bit of practice, less than an hour might be enough per asset/timeframe to find a system that makes sense to you and adapted to your trading capital and psychology.
Assuming our users read our guides and are fully committed to learning a new way of trading - then we do guarantee you'll be able to design kick-ass trading systems that make sense.
"Making sense" doesn't mean at all it's guaranteed to win, it means you're the one defining the convergence of indicators, using your Algorithm Builder, and observe that most of the time - whenever there is a BUY signal, the candlesticks are going upwards - whenever there is a SELL signal, it's going downwards.
This is a necessary step to make real progress from a trading analyst perspective - and hopefully could lead to profits.
VIII. Algorithm Builder versus the main trader enemy(=psychology)
This indicator has the goal to help solving one of the MAIN issues encountered by traders.
Most of traders realize, they can't perform with only 1 indicator (or 1 price pattern or 1 price action) and need a combination of multiple indicators before getting in a trade.
Far from being a magic pill, if it could at least reduce the stress you have while trading, then we'll consider we made a great job - it's a technical "useless noise remover", and needs to be followed strictly.
Such trust in a trading system can only be built by testing your Algorithm Builder configuration on either:
1. a demo account
2. or a live account with small bids. And then, increasing progressively the bids if your capital increases progressively.
Though, you should still use your common sense. (for instance: if we get a BUY signal right on a big timeframe resistance we're hitting for the first time).
I'm aware this is a new way of trading but for many, and while we cannot foresee the future, neither predict performance, we believe it might save you a lot of time to find good signals.
My maximum level of happiness will be reached the day when our users will contact me and showing me setups being mine.
I'm sure that even I can learn from my users and, we can all learn from each other Algorithm Builder configuration
IX. What is a wrong or bad configuration?
Simply put. If you see that most of your signals react such as described below:
1. a buy triangle/diamond predicts, most of the time an upwards move
2. a sell triangle/diamond predicts, most of the time a downwards move
3. you estimated yourself the stop-loss needed to give enough room for your trades.
4. take profits based on algorithmic support and resistances or your own take profit method.
So what's a good Algorithm Builder configuration? A configuration you're happy with and makes sense.
A better Algorithm Builder setup is one used in demo or a live account w/ small bids for a few weeks, and you're consistent in your trading performance.
If you have any doubt or question, please hit me up directly or ask in the comments section of this script.
I'll never claim I have the best trading methodology or the best indicators. You only will be the judge, and I'll appreciate all the questions and feedback you're sending my way.
They help me a ton to develop indicators based on all the requests I received.
Kind regards,
Dave
Algorithm Builder - Single Trend+ (Plug&Play)Hello traders
I. SCRIPTS ACCESS AND TRIALS
1. For the trial request access, they have to be done through my website .
2. My website URL is in this script signature at the very bottom (you'll have to scroll down a bit and going past the long description) and in my profile status available here : Daveatt
Due to the new scripts publishing house rules, I won't mention the URL here directly. As I value my partnership with TradingView very much, I prefer showing you the way for finding them :)
3. You may also contact me directly for more information
II. Algorithm Builder - Single Trend+ Plug&Play
2.1 Concept
That script is an upgrade of the Single Trend:
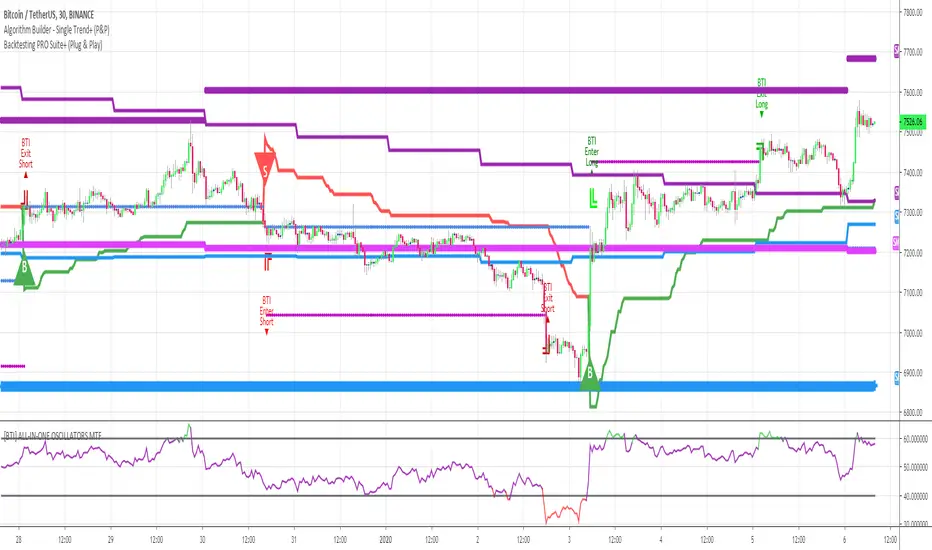
The Algorithm Builder - Single Trend+ (Plug & Play) is made to detect the convergence of many unrelated indicators, and give a BUY or SELL signal whenever all the selected sub-indicators are converging in the same direction.
The Single Trend+ (Plug & Play) gives one single entry per identified trend - unlike the Multiple Trends editions (also available on my scripts page) which may give more than 1 entry per trend.
The traders select the sub-indicators they want, and see in real-time the BUY and SELL triangles being updated.
III. Plug & Play
Hope you're ready to be impressed. Because, what I'm about to introduce, is my best-seller feature - and available across many of my indicators.
In TradingView, there is a feature called "Indicator on Indicator" meaning you can use an external indicator as a data source for another indicator.
I'm using that feature to connect any external indicator to our Algorithm Builder Single Trend+ Plug & Play (hence the plug and play name).
Let's assume you have your RSI divergence indicator - which is not part of the Algorithm Builder - but noticed that the convergence of an RSI divergence and a MACD gives strong signals.
I mentioned an RSI divergence, but you may connect any oscillator (MACD, On balance volume, stochastic RSI, True Strenght index, and many more..) or non-oscillator (divergence, trendline break, higher highs/lower lows, candlesticks pattern, price action, harmonic patterns, ...) indicators.
Any indicator that displays visual signals are eligible for this feature .... in other words.... all possible indicators. You're welcome :)
THE SKY IS (or more likely your imagination) is the limit :)
Fear no more. The Plug&Play technology allows you to connect it and use it in the convergence/confluence calculations.
Hence, whenever the MACD and RSI divergence will be in the same direction for the first time, you'll get a signal. For the first time only because this is a Single trend edition - you may enter multiple times using our Algorithm Builders - Multiple Trends editions.
To connect your external indicator to ours, we're using a native TradingView feature, which is not available for all users.
It depends on your TradingView subscription plan ( More info here )
If you intend to use our Algorithm Plug&Play indicator, and/or our Backtest Plug&Play suites, then you must upgrade your TradingView account to enjoy those features.
We value our relationship with our customers seriously, and that's why we're warning you that a compatible TradingView account type is required - at least PRO+ or PREMIUM to add more than 1 Plug&Play indicator per account.
We go in-depth on our website why the Plug&Play is an untapped opportunity for many traders out there - URL available on my profile status and signature
IV. Why the Algorithm Builder Single Trend+ (Plug&Play) may help you
I worked with many traders during my career, and their feedback about trading is often pretty similar.
They all tried a lot of complicated indicators, losing their capital, and finally getting back to the basics (even to the basic indicators if I might say)
The art is finding a good combination of indicators and setting strict money/risk management rules.
Easy in concept, but more than 90+% of traders lose money on the markets... which teach us that trading is not only about drawing trendlines, or using cool indicators but finding ways to ease our psychology while trading.
4.1 The Algorithm Builder trading framework
The sub-indicators (full list on our website) weren't chosen randomly. They're based on a trading method we've developed over the last 6 years - while working with traders and other trading quants.
The Algo Builders are made to detect a convergence - and as such, will give a signal once a trend has been identified.
They're not made to detect reversal but have been designed to give a signal when all sub-indicators are either ALL bullish (green) or ALL bearish (red).
We provide a framework based on indicators we selected because they:
1. make sense to be used altogether
2. work on asset classes like INDEX, CRYPTO, STOCK OPTIONS, FOREX, COMMODITIES
3. it may expand your knowledge about what detecting a convergence with pre-selected indicator really means
4.2 Supports and Resistances
The indicator displays the main algorithmic supports and resistances according to our trading method.
I think they're relevant for all asset classes, but you're absolutely free to use any different supports/resistances logic if you want to.
I'm not against it because I know that pivots, Fibonacci levels, etc. may work very well also.
4.3 Choose your favorite risk management algorithm
1/ Pre-defined Algo S/R method using:
- a supertrend of the stop-loss
- the nearest algorithmic resistances for the take profit levels.
2/ Define your own Stop-loss and Take-profits level in real-time
Stop-Loss Management
For what's following, let's assume that 2 is the stop-loss value you inserted in the indicator, and the Algorithm Builder gives a BUY signal.
This is NOT a recommendation at all, only an example to explain how this feature works.
- %Trailing: The Stop-Loss starts 2% away from the entry price - and will move up (because we're on a BUY trade as per our example) every time your trade will gain 2% profit
- Percentage: The Stop-Loss stays static 2% away from the entry price. There is no trailing here
- TP Trailing: This is a very awesome feature. The stop-loss is set 2% away when the trades start.
When the TP1 is hit, the stop-loss will be moved to the Entry price (also called breakeven).
When the TP2 is hit, the SL is moved to the previous TP1 position
- Fixed: Set the Stop-Loss at a fixed position (value should be in currency/units)
Take Profits Management
You can manage up to 2 take profit levels defined as a percentage or price value.
The expected input is in percentage value (for instance, setting the % target of TP1 to 2% will set the TP1 level 2% away from the entry price
4.4 Built-in Trade Manager
This is very likely the most loved utility script that we shared on TradingView.
It's included in your Algorithm Builder - Single Trend+, and will certainly help you immensely to analyze your charts and your trades.
We made sure that all the graphical elements on the chart will be updated in real-time whenever our user change anything on the indicator configuration.
You'll also be able to change the Trade Manager labels positions as you wish :)
4.5 Built-in Risk-to-Reward Panel
The good stuff doesn't stop here.
You'll notice that this sometimes green (when in a LONG), sometimes red (when in a SHORT) panel at the right of your chart.
It displays for the selected trading algorithmic (see 2.3.2 above), a ton of useful real-time analytics.
- Entry Price: the price when the Algorithm Builder will give a signal.
- The Trade PnL in percentage.
- Entry Stop Loss: Distance (in currency/units) between the selected stop-loss algorithm (percent, trailing, TP trailing, etc.) and the entry price.
- Entry TP1: Distance (in currency/units) between the entry price and the first take profit
- Entry TP2: Distance (in currency/units) between the entry price and the second take profit
- Risk/Reward TP1: Using the Stop-loss distance at entry, and Take Profit 1 at entry to compute the risk-to-reward ratio.
- Risk/Reward TP2: Using the Stop-loss distance at entry, and Take Profit 2 at entry to compute the risk-to-reward ratio.
For more details, please check the guides section of my website. Links are in my signature and profile status.
4.6Hard Exits
Our trading method is known for the hard exits, also called invalidation.
The Single Trend+ includes a hard exit based on a MACD - settings are flexible and you may update them.
Having a stop-loss protecting your trade is a best practice - Protecting your stop-loss also from getting hit is incredible.
We prefer invalidate a few positions, even if sometimes we don't want to. Rather than the market hard exiting on us, and leaving with our hard-working money.
4.7 Alerts
Alerts are enabled for:
- BUY/SELL triangles signals
- Trade Manager (SL, TP1, TP2)
- Hard Exits
V. Pain points that we're trying to solve with our Algorithm Builders
Issue #1 There are many informations / indicators / strategies / backtests / noise. Finding the right ones is not a simple task.
Solution #1 A reliable system that removes the external noise is much needed in trading to stay "in the game".
Issue #2 Trading could be quite stressful - The majority doesn't lose in trading because technical analysis is hard, but because managing our psychology is one of the hardest things a human can do.
Solution #2 Some ways to reduce the "trading stress" could be: getting better quality signals and trading like a "machine". Forgetting about Twitter and trusting the system you designed.
Issue #3 Trading without strict rules and only based on what we feel, or what we think the market should do is the fastest way to kiss our money goodbye.
Only 1 indicator generally is not enough. Traders generally use a combination of several indicators but they're monitoring them individually.
It's normal then to feel exhausted at the end of the day ^^ (to say the least)... and exhaustion leads to mistakes which leads to..... (I'm sure you got it) ... capital loss.
Solution #3 As a trader, I needed a trading framework and a method. I offer our trading method but they're plenty others out there. We cannot claim obviously it's the best ever ....but let's say we're using those exact same
scripts ourselves for our trading. And this what we've been recommending our clients to trade with for the past years. Also, having a tool detecting the convergence of several indicators and giving 1 unique signal
for BUY/SELL position will save you a lot of time/energy, and perhaps might help you out getting better trading performance.
VI. Resolving a complex puzzle and having fun in the process
Trading has to stay a passion and not (only be) a source of intense stress.
The most successful traders I know are "trading geeks" - literally always looking for optimizing, searching for the best possible entries, setups, indicators, tools, etc.
For them, it's not even about the money anymore, but only about beating their previous performance.
Why are they doing this? Because it's fun
Might appears as a bold statement, but I guarantee that looking for setups is fun.
One of our users even told us, that it's like playing with "Legos" and we couldn't possibly agree more.
VII. Designing a system that "makes sense"
Another bold statement now. Brace yourselves ladies and gentlemen
The Algorithm Builders allow to design trading systems quickly. What could takes days/weeks/months to find out... might be now within your reach in less than a few hours.
With a bit of practice, less than an hour might be enough per asset/timeframe to find a system that makes sense to you and adapted to your trading capital and psychology.
Assuming our users read our guides and are fully committed to learning a new way of trading - then we do guarantee you'll be able to design kick-ass trading systems that make sense.
"Making sense" doesn't mean at all it's guaranteed to win, it means you're the one defining the convergence of indicators, using your Algorithm Builder, and observe that most of the time - whenever there is a BUY signal, the candlesticks are going upwards - whenever there is a SELL signal, it's going downwards.
This is a necessary step to make real progress from a trading analyst perspective - and hopefully could lead to profits.
VII. Algorithm Builder versus the main trader enemy(=psychology)
This indicator has the goal to help solving one of the MAIN issues encountered by traders.
Most of traders realize, they can't perform with only 1 indicator (or 1 price pattern or 1 price action) and need a combination of multiple indicators before getting in a trade.
Far from being a magic pill, if it could at least reduce the stress you have while trading, then we'll consider we made a great job - it's a technical "useless noise remover", and needs to be followed strictly.
Such trust in a trading system can only be built by testing your Algorithm Builder configuration on either:
1. a demo account
2. or a live account with small bids. And then, increasing progressively the bids if your capital increases progressively.
Though, you should still use your common sense. (for instance: if we get a BUY signal right on a big timeframe resistance we're hitting for the first time).
I'm aware this is a new way of trading but for many, and while we cannot foresee the future, neither predict performance, we believe it might save you a lot of time to find good signals.
My maximum level of happiness will be reached the day when our users will contact me and showing me setups being mine.
I'm sure that even I can learn from my users and, we can all learn from each other Algorithm Builder configuration
VIII. What is a wrong or bad configuration?
Simply put. If you see that most of your signals react such as described below:
1. a buy triangle predicts, most of the time an upwards move
2. a sell triangle predicts, most of the time a downwards move
3. you estimated yourself the stop-loss needed to give enough room for your trades.
4. take profits based on algorithmic support and resistances or your own take profit method.
So what's a good Algorithm Builder configuration? A configuration you're happy with and makes sense.
A better Algorithm Builder setup is one used in demo or a live account w/ small bids for a few weeks, and you're consistent in your trading performance.
If you have any doubt or question, please hit me up directly or ask in the comments section of this script.
I'll never claim I have the best trading methodology or the best indicators. You only will be the judge, and I'll appreciate all the questions and feedback you're sending my way.
They help me a ton to develop indicators based on all the requests I received.
Kind regards,
Dave
Dips & Rips — OVERLAY (Triangles on Price Only, size fixed)This script calculates extreme dips (blue triangle) or rips (yellow triangle) as likely reversal points, with confirmation long (green triangles) and short (red triangles) triggers occurring on subsequent RSI divergences.

BBMA Strategy - EXT CSD CSM MHV RE CodesBINANCE:BTCUSD
Below is a detailed guide for using and interpreting the "BBMA Strategy - Enhanced EXT CSD CSM with Subplot" indicator. This guide is designed to be added to the description of the indicator when publishing it on TradingView. It provides clear instructions for users on how to apply the indicator, interpret its signals, and understand its features, including the multi-timeframe analysis and subplot table.
BBMA Strategy - Enhanced EXT CSD CSM with Subplot: User Guide
Overview
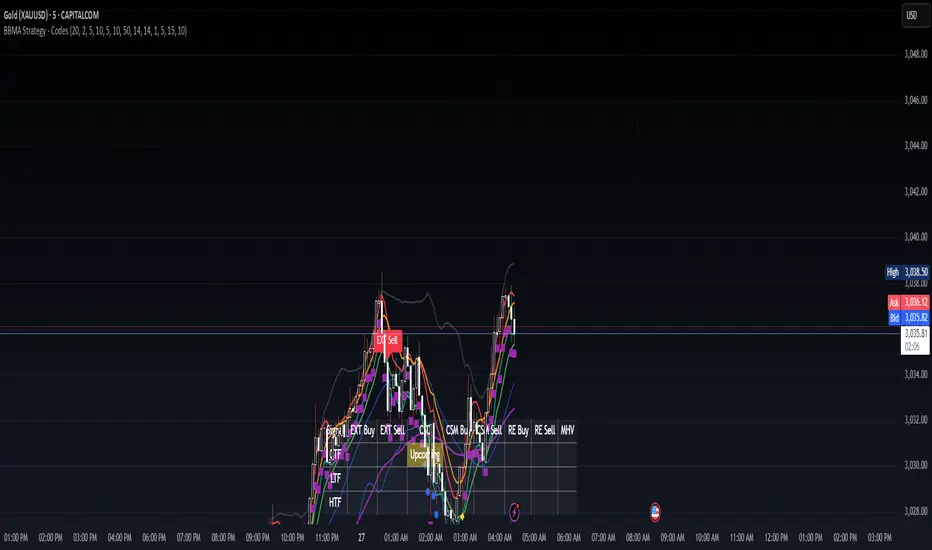
The "BBMA Strategy - Enhanced EXT CSD CSM with Subplot" is a comprehensive trading indicator built on the Bollinger Bands Moving Average (BBMA) framework. It combines multiple technical analysis tools—Bollinger Bands, Moving Averages (MAHI and MALO), EMA, ATR, volume analysis, RSI, MACD, market structure, and candlestick patterns—to identify high-probability trading setups. The indicator supports five key BBMA setups: EXT (Extreme), CSD (Consolidation), CSM (Continuation Setup Movement), RE (Re-Entry), and MHV (Market High Volatility).
This enhanced version includes:
Multi-Timeframe (MTF) Analysis: Confirms signals across a Lower Timeframe (LTF) and Higher Timeframe (HTF) for stronger trade validation.
Subplot Table: Displays signal status ("Active" or "Upcoming") and MTF confirmations in a clear table format.
Market Structure and Volume Filters: Incorporates Break of Structure (BOS), RSI divergence, and volume conditions to filter out low-probability trades.
Customizable Settings: Adjust Bollinger Bands, MA periods, timeframes, and more to suit your trading style.
This indicator is suitable for traders of all levels and can be used across various markets (e.g., forex, crypto, stocks) and timeframes (1M to 1D).
How to Use the Indicator
1. Add the Indicator to Your Chart
Open TradingView and load the chart of your chosen asset (e.g., BTCUSD, EURUSD, XAUUSD).
Go to the Pine Editor, paste the indicator code, and click "Add to Chart."
The indicator will overlay on your chart, displaying Bollinger Bands, Moving Averages, EMA, and signal labels. A subplot table will appear at the bottom of the chart.
2. Configure the Settings
The indicator provides customizable inputs to tailor it to your trading preferences. Access the settings by clicking the gear icon next to the indicator name on your chart:
Bollinger Bands Settings:
BB Period: Default is 20. Adjust the lookback period for Bollinger Bands.
BB Deviations: Default is 2. Adjust the standard deviation for the bands.
MAHI Settings (Moving Averages on High):
MAHI 5 Period: Default is 5. Period for the shorter MA on highs.
MAHI 10 Period: Default is 10. Period for the longer MA on highs.
MALO Settings (Moving Averages on Low):
MALO 5 Period: Default is 5. Period for the shorter MA on lows.
MALO 10 Period: Default is 10. Period for the longer MA on lows.
EMA Settings:
EMA Period: Default is 50. Adjust the period for the Exponential Moving Average.
ATR Settings:
ATR Period: Default is 14. Period for the Average True Range.
ATR SMA Period: Default is 14. Period for the ATR smoothing.
Timeframe Settings:
Minor HTF: Default is 1h. Select the minor higher timeframe for trend confirmation.
Major HTF: Default is 4h. Select the major higher timeframe for trend confirmation.
Lower TF for Confirmation: Default is 5m. Select the lower timeframe for signal confirmation.
Market Structure Settings:
Market Structure Lookback: Default is 10. Adjust the lookback period for swing highs/lows in market structure analysis.
3. Select Your Chart Timeframe
The indicator works on any timeframe from 1 minute (1M) to 1 day (1D).
For best results, align your chart timeframe (Current Timeframe, CTF) with the LTF and HTF settings:
Example: If CTF is 15m, set LTF to 5m and HTF to 1h or 4h.
This ensures proper multi-timeframe alignment for signal confirmation.
Indicator Components
Main Chart Elements
Bollinger Bands (BB): Plotted as three lines (upper, middle, lower) to identify volatility and potential reversal zones.
Upper Band: Blue line.
Middle Band: Black line (basis).
Lower Band: Blue line.
MAHI (Moving Averages on High): Two weighted moving averages on highs to detect trend direction.
MAHI 5: Green line.
MAHI 10: Lime line.
MALO (Moving Averages on Low): Two weighted moving averages on lows to confirm trend direction.
MALO 5: Red line.
MALO 10: Orange line.
EMA (50-period): Purple line to identify the overall trend.
Signal Labels: Appear on the chart when a setup is confirmed:
EXT Buy: Green upward arrow (reversal buy at BB lower band).
EXT Sell: Red downward arrow (reversal sell at BB upper band).
CSM Buy: Teal upward arrow (continuation buy above BB middle).
CSM Sell: Maroon downward arrow (continuation sell below BB middle).
RE Buy: Aqua upward arrow (re-entry buy between BB lower and middle).
RE Sell: Fuchsia downward arrow (re-entry sell between BB upper and middle).
MHV: Orange label (high volatility breakout after consolidation).
CSD: Yellow diamond (consolidation signal).
Subplot Table
Located at the bottom of the chart, the table summarizes signal status across three timeframes:
CTF (Current Timeframe): Shows "Active" (signal confirmed) or "Upcoming" (signal forming) for each setup.
LTF (Lower Timeframe): Displays a checkmark (✔) if the signal is confirmed on the LTF.
HTF (Higher Timeframe): Displays a checkmark (✔) if the signal is confirmed on the HTF.
Columns represent the five BBMA setups: EXT Buy, EXT Sell, CSD, CSM Buy, CSM Sell, RE Buy, RE Sell, and MHV.
Interpreting the Signals
1. EXT (Extreme) Setup
EXT Buy (Green Arrow):
Condition: Price touches or breaks below the BB lower band, closes above it, with high ATR volatility, strong volume, and additional confirmations (e.g., hammer candle, RSI oversold, MACD bullish, MAHI/MALO crossover, or bullish divergence).
Interpretation: A potential reversal buy signal. Look for confirmation in the subplot table (LTF and HTF rows).
Action: Consider a long position if LTF and HTF confirm (✔ in both rows). Use the BB middle or upper band as a target.
EXT Sell (Red Arrow):
Condition: Price touches or breaks above the BB upper band, closes below it, with high ATR volatility, strong volume, and additional confirmations (e.g., shooting star candle, RSI overbought, MACD bearish, MAHI/MALO crossunder, or bearish divergence).
Interpretation: A potential reversal sell signal.
Action: Consider a short position if LTF and HTF confirm. Use the BB middle or lower band as a target.
2. CSD (Consolidation) Setup
CSD (Yellow Diamond):
Condition: BB width is narrow (below its SMA), low ATR volatility, small candles, and no MAHI/MALO crossovers.
Interpretation: The market is consolidating, often preceding a breakout (e.g., MHV).
Action: Avoid trading during CSD unless preparing for an MHV breakout. Monitor the subplot for "Upcoming" MHV signals.
3. CSM (Continuation Setup Movement)
CSM Buy (Teal Arrow):
Condition: Price is above the BB middle, MAHI crossover, MALO crossover or MACD bullish, price above EMA 50, with additional confirmations (e.g., bullish engulfing or MACD bullish).
Interpretation: A continuation buy signal in an uptrend.
Action: Enter a long position if LTF and HTF confirm. Target the BB upper band or recent swing highs.
CSM Sell (Maroon Arrow):
Condition: Price is below the BB middle, MAHI crossunder, MALO crossunder or MACD bearish, price below EMA 50, with additional confirmations (e.g., bearish engulfing or MACD bearish).
Interpretation: A continuation sell signal in a downtrend.
Action: Enter a short position if LTF and HTF confirm. Target the BB lower band or recent swing lows.
4. RE (Re-Entry) Setup
RE Buy (Aqua Arrow):
Condition: Price is between the BB lower and middle bands, MAHI crossover, MALO crossover or MACD bullish, price above EMA 50, with additional confirmations (e.g., bullish engulfing or MACD bullish).
Interpretation: A re-entry buy signal after a pullback in an uptrend.
Action: Enter a long position if LTF and HTF confirm. Target the BB middle or upper band.
RE Sell (Fuchsia Arrow):
Condition: Price is between the BB upper and middle bands, MAHI crossunder, MALO crossunder or MACD bearish, price below EMA 50, with additional confirmations (e.g., bearish engulfing or MACD bearish).
Interpretation: A re-entry sell signal after a pullback in a downtrend.
Action: Enter a short position if LTF and HTF confirm. Target the BB middle or lower band.
5. MHV (Market High Volatility) Setup
MHV (Orange Label):
Condition: Follows a CSD signal, with expanding BB width, high ATR volatility, strong volume, and MAHI/MALO crossover or crossunder.
Interpretation: A breakout signal after consolidation, indicating high volatility and potential for a strong move.
Action: Trade in the direction of the breakout (e.g., buy if MAHI crossover, sell if MAHI crossunder). Confirm with LTF and HTF. Target significant levels like recent swing highs/lows.
6. Multi-Timeframe Confirmation
LTF Confirmation: A checkmark (✔) in the LTF row indicates the signal is also present on the lower timeframe (e.g., 5m). This adds confidence to the trade.
HTF Confirmation: A checkmark (✔) in the HTF row indicates alignment with the higher timeframe trend (e.g., 4h). This confirms the signal's strength.
Strongest Signals: Look for signals with both LTF and HTF confirmations (✔ in both rows). These have the highest probability of success.
7. Upcoming Signals
The CTF row in the subplot table may show "Upcoming" for a setup (e.g., EXT Buy: Upcoming). This indicates the setup is forming but not yet confirmed.
Action: Monitor these setups closely. They may turn "Active" on the next candle if conditions are met.
Trading Tips
Trend Alignment: Use the EMA 50 and market structure (is_uptrend) to ensure trades align with the overall trend. For example, prioritize CSM Buy signals in an uptrend.
Risk Management:
Set stop-losses below recent swing lows (for buys) or above recent swing highs (for sells).
Use the BB middle or opposite band as a target for most setups.
Avoid Overtrading: Focus on signals with LTF and HTF confirmations to filter out noise.
Timeframe Selection:
Scalping: Use 1m or 5m CTF with 1m LTF and 15m HTF.
Day Trading: Use 15m or 1h CTF with 5m LTF and 4h HTF.
Swing Trading: Use 4h or 1D CTF with 1h LTF and 1D HTF.
Backtesting: Test the indicator on historical data for your chosen asset and timeframe to understand its performance.
Alerts
The indicator includes built-in alerts for each setup:
EXT Buy/Sell: Triggers when an EXT signal is confirmed.
CSD: Triggers during consolidation.
CSM Buy/Sell: Triggers for continuation signals.
RE Buy/Sell: Triggers for re-entry signals.
MHV: Triggers for high volatility breakouts. To set up alerts:
Right-click on the chart and select "Add Alert."
Choose the condition (e.g., "BBMA EXT Buy").
Set your preferred notification method (e.g., email, SMS).
Limitations
Lagging Indicators: The indicator uses moving averages and other lagging tools, which may delay signals in fast-moving markets.
False Signals: Like all indicators, it can produce false signals, especially in choppy markets. Use LTF/HTF confirmations to filter trades.
Timeframe Dependency: Ensure your CTF, LTF, and HTF are properly aligned to avoid conflicting signals.
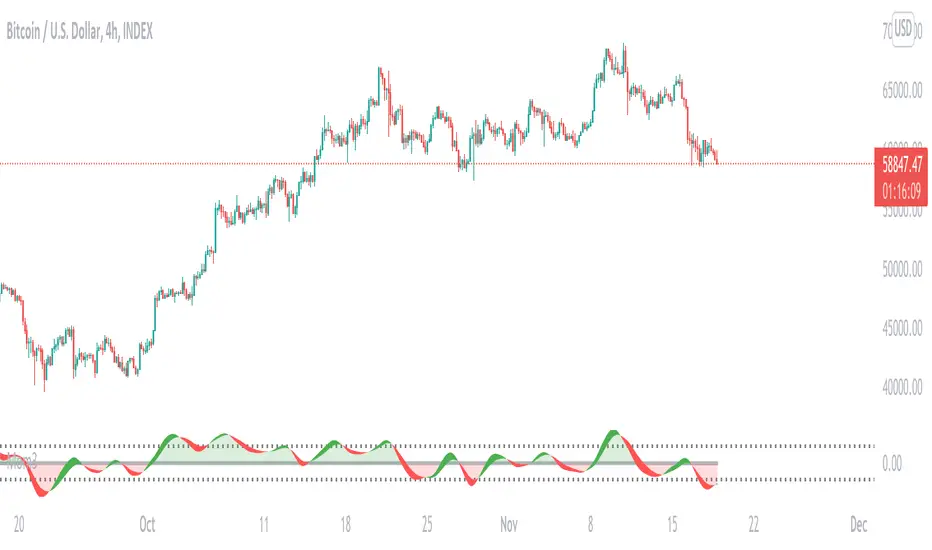
QQE Weighted Oscillator [LuxAlgo]The QQE (Quantitative Qualitative Estimation) Weighted Oscillator improves on its original version by weighting the RSI based on the indications given by the trailing stop, requiring more effort in order for a cross with the trailing stop to occur.
🔶 USAGE
The QQE Weighted Oscillator is comprised of a smoothed RSI oscillator and a trailing stop derived from this same RSI. The oscillator can be used to indicate whether the market is overbought/oversold as well as an early indication of trend reversals thanks to the leading nature of the RSI.
Using higher Factor values will return a longer-term trailing stop.
Like with a regular RSI divergence can be indicative of a reversal.
Further weighting will control how much "effort" is required for the trailing stop to cross the RSI. For example. For example, an RSI above the trailing stop will require a higher degree of negative price variations in order for a potential cross to occur when using higher weights.
This can cause higher weightings to return more cyclical and smoother results.
🔶 SETTINGS
Length: Length of the RSI oscillator.
Factor: Multiplicative factor used for the trailing stop calculation.
Smooth: Degree of smoothness of the RSI oscillator.
Weight: Degree of weighting used for the RSI calculation.

Divergence + EMAS' + VolumeHi,
This strategy takes in consideration multiple factors: includes RSI divergence, plus cross of EMAs and volume
STRATEGY:
you can change the EMAs input best use for daily charts
BUY: ALERT:
WHEN RSI divergence ABOVE 0 AND EMA 5 CROSS-OVER EMA 12
AND THE CANDLE NEED TO CLOSE ABOVE BOTH MOVING AVERAGE
And THE VOLUME BAR NEED TO BE HIGHER THAN THE PREVIOUS ONE
Then a buy signal will appear
SELL ALERT:
WHEN RSI divergence BELOW 0 AND MA 5 CROSS-UNDER EMA 12
AND THE CANDLE NEED TO CLOSE below BOTH MOVING AVERAGE
THE VOLUME BAR NEED TO BE HIGHER THAN THE PREVIOUS ONE
Then a sell signal will appear
Ema 200 FILTER. :::
When this box is activated, all trades under the EMA 200 will not appear on the chart,, when deactivated, trades will appear. On the chart.
that way u prevent wrong trades. obviously u will need to use support and resistance to find re entry point or the lowest point when under the 200 EMA.
No strategy is perfect but this one get close to it.
VOLUME: the volume box is turn off , only to display or not display in the chart, but is considered on the math within the strategy so by turning off you are only turning off the visual part
any questions feel free to ask, thanks!

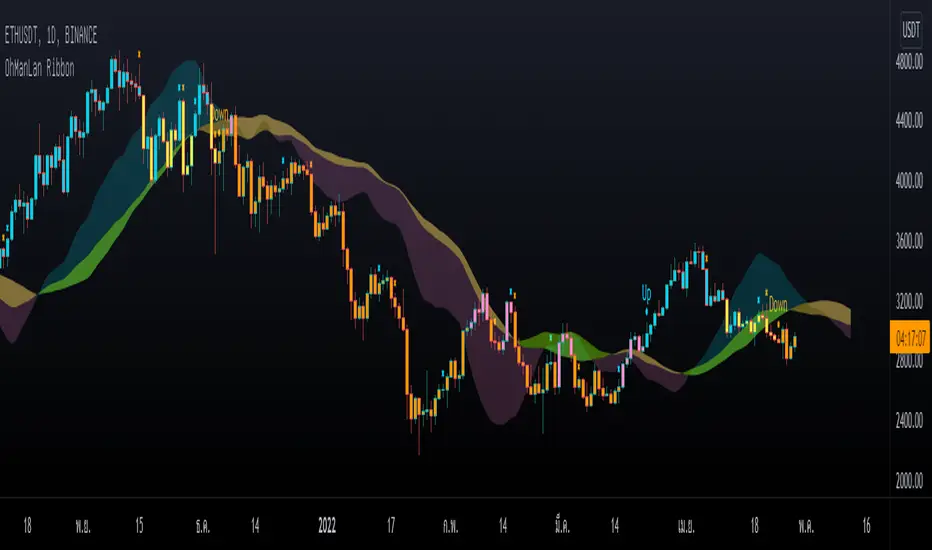
OhManLan RibbonWe focus on reducing the chance of loss. And trying to fix the Ribbon's main problem is signal lag. and more pseudo-signals when adjusting faster
What is OhManLan Ribbon?
1.) Up/Down signals that indicate a trend
2.) Partial Take-Profit signals that can be used as break-off signals
3.) OML Cloud that can be used as a support/resistance, as a stop loss or trailing stop, tells the strength of a trend and can also help reduce false up/down signals.
OhManLan Ribbon is an indicator that will make chart analysis easier for the crypto market.
### OML Colud
The cloud are a visual representation of support and resistance , And its color also represents the strength of the trend, Using the cloud here allows smoother components.
- How to use -
Buy when bar closes in Blue and Sell when bar closes in Orange, There are words to help you with reading the Up and Down signal, X is a Take-Profit signal. Sell partially when bar closes, Can be used with other indicators such as RSI (Divergence), Stochastic to confirm the accuracy.
---------------------------------------
เราให้ความสำคัญกับการลดโอกาสขาดทุน และพยายามแก้ไขปัญหาหลักของ Ribbon คือความล่าช้าของสัญญาณ และสัญญาณหลอกที่มากขึ้นเมื่อปรับค่าให้เร็วขึ้น
OhManLan Ribbon มีอะไรบ้าง?
1.) สัญญาณ Up/Down ที่บอกให้ทราบถึงแนวโน้ม
2.) สัญญาณ Partial Take-Profit ที่สามารถใช้เป็นสัญญาณแบ่งปิดทำกำไร
3.) OML Cloud ที่สามารถใช้เป็นแนวรับ-ต้าน, ใช้เป็นจุด Stop loss หรือ Trailing stop, บอกความแข็งแรงของเเนวโน้มและยังสามารถช่วยลดสัญญาณหลอกจาก Up/Down Signal ได้ด้วย
OhManLan Ribbon คือ Indicator ที่จะช่วยให้คุณวิเคราะห์กราฟได้ง่ายขึ้นสำหรับตลาดคริปโต
### วิธีการใช้งานเบื้องต้น
Up/Down Signals
- Up หมายถึง เทรนขาขึ้น สามารถเล่น Buy ได้
- Down หมายถึง เทรนขาลง สามารถเล่น Sell ได้
- Ribbon (Options): OML V4 ใช้ได้ทั่วไป, SaiDao ใช้สำหรับ Altcoins
*เตือน
- Up ไม่ได้หมายถึง แท่งเทียนสีฟ้า
- Down ไม่ได้หมายถึง แท่งเทียนสีส้ม
Up/Down สามารถขึ้นที่แท่งเทียนสีไหนก็ได้
*ทริคเสริม
แท่งเทียนสีชมพู สามารถ Buy บางส่วนได้หากมี RSI Divergence
แท่งเทียนสีเหลือง สามารถ Sell บางส่วนได้หากมี RSI Divergence
---------------------------------------
Partial Take-Profit Signals (X Signals)
- x สีส้ม หมายถึง แบ่งปิดทำกำไรสำหรับ Up Signal
- X สีฟ้า หมายถึง แบ่งปิดทำกำไรสำหรับ Down Signal
---------------------------------------
OML Cloud
- สามารถใช้เป็นแนวรับ-ต้าน, จุด Stop loss หรือ Trailing stop
- สามารถช่วยลดสัญญาณหลอก Up/Down
สีของ OML Cloud
-ฟ้า/เขียว หมายถึง เทรนขาขึ้นที่แข็งแรง
-ฟ้า/เหลือง หมายถึง เทรนขาขึ้นเริ่มอ่อนแรง
-ชมพู/เหลือง หมายถึง เทรนขาลงที่แข็งแรง
-ชมพู/เขียว หมายถึง เทรนขาลงเริ่มอ่อนแรง
---------------------------------------
### อย่าหาทำ
X อย่าพึ่งพา OhManLan Ribbon เพียงตัวเดียว
X อย่าซื้อขายตาม Up/Down Signal แล้วพูดว่ายอมขาดทุนไปเถอะเวลาได้ก็กินคำใหญ่ แบบนี้ไม่เอา การเทรดไม่ใช่ของเล่นจะมาทำเล่น ๆ พูดมักง่าย ๆ ไม่ได้แบบนี้ไม่เอา
X ถ้าไม่มีทักษะอื่นมาร่วมวิเคราะห์ ก็พยายามหลีกเลี่ยง Altcoin ไว้ก่อน
X หลีกเลี่ยงการเทรดบน Time frame ระยะกลางและระยะสั้น ***TF ที่เหมาะสมที่สุดคือ 1 Day (ระยะสั้น ได้แก่ 5-15-30 นาที, ระยะกลาง ได้แก่ 60-120 นาที)
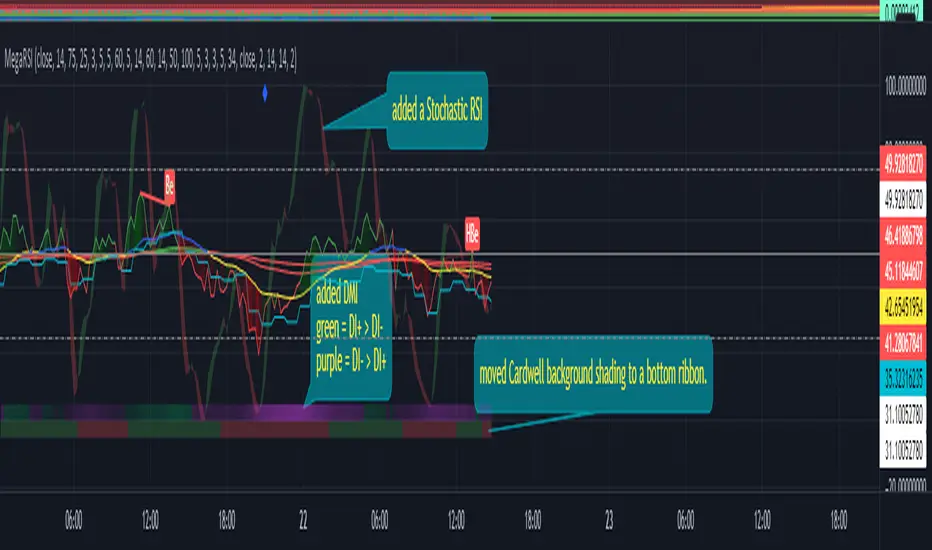
MegaRSIAre you looking for an RSI? I don't know if you can get any more information out of 1 RSI indicator than you can with MEGARSI!!!!! Includes RSI, RSI Divergence spotter, 2 RSI MAs, a smoothed RSI, a multi timeframe RSI and upper and lower diamond plots for potential trend reversals. It also includes background shading based on Andrew Cardwell's RSI ranges articles to help identify longer term trends and RSI patterns. See the included chart call outs for identification of individual parts.
Cyatophilum Accumulation StrategyAn indicator to backtest and automate accumulation/pyramiding custom strategies.
The goal of the strategy is to buy several times when the price is low and sell all when the position is in profit.
Configure your strategy using the entry options and entry filters, then set your Take Profit and StopLoss.
═════════════════════════════════════════════════════════════════════════
█ HOW IT WORKS
The strategy has pyramiding enabled, which means it can open several deals in a row.
It will keep buying until the Take Profit target is reached.
The indicator plots the Take Profit and Break Even line which are recalculated at each new deal.
The target corresponds to the average entry price plus a configurable percentage.
We can see the average entry price line drop lower at each Long Entry.
█ HOW TO USE
Choose a pair that you want to hold/invest in.
Pick a chart time frame that you like, according to how often you want the strategy to place orders. A benefit of this strategy is that it can work on low time frames as well as high time frames. Just keep in mind that the smaller the time frame, the bigger the impact of fees and slippage will be on the strategy results.
Configure your entry condition . You can combine several technical indicators to trigger an entry, such as Top & Bottom, Higher Lows and RSI divergences.
Example with double bottoms:
Filter your entry signal . Add filters to strengthen your entry signal.
Configure your profit target
Use the Take Profit feature to set a target in percentage of price. You can also make it trail.
There is a Trailing Stop Loss feature but the goal of the strategy is to never sell in loss, so it is turned off by default.
Check your backtest parameters
Make sure that the initial capital and order size make sense. Since it is a pyramiding strategy, the sum of all deals should not be bigger than the initial capital.
In this example: Initial capital is 10 k, max active deals is 10, so the max order size is 1 k.
If you use % equity as order size, please note that it will create compounding.
Check the fees, by default they are set to 0.1%.
I also recommend to set a slippage that corresponds to your exchange's spread.
Note: the pyramiding parameter has to be equal to the "Max Active deals" input.
█ FEATURES
• Entry settings
Configure wether to go long or short, or both.
Choose the Max Active deals : the maximum number of deals that you want to open at once.
The Minimum bar delay between deals parameter will help putting space between deals.
• Trend Filter
The trend filter will fitler off long deals when the trend is bearish, and short deals when it is bullish.
Choose a trend line from a list, or any external trend line you can find.
The Trend condition allows to choose wether the trend should switch from slope change or price cross.
• MTF Trend Filter
A secondary trend line, Multi Time Frame.
• Volume Filter
The volume filter will check the bar volume and prevent the entry if it is too low.
• Stop Loss and Take Profit
Configure your stop loss and take profit for long and short trades.
You can also make a trailing stoploss and a trailing take profit.
• Backtest Settings
Choose a backtest period, longs or shorts, wether to use limit orders or not.
An option to close open orders at the current bar if you have multiple open orders and are wondering what it would result to close them now.
Graphics
A Configuration panel with all the indicator settings, useful for sharing/saving a strategy.
A Backtest Results panel with additional information from the strategy tester.
█ ALERTS
The indicator is using the alert() calls: it only uses 1 alert slot to send order messages for each event. This means free TV plans can create 1 complete strategy.
To set your alert messages, open the indicator settings and scroll to the bottom of the "inputs" tab.
Create your alert after you set the messages in the indicator settings, and make sure "Any alert() function call" is set in the alert option.
█ LIMITATIONS
Things to keep in mind when using this strategy.
• No Stop loss
When trading without stop loss, your equity can drop without limit, and it can take a while until price recovers.
This is why when backtesting I recommend to keep an eye on the "Max # Days in trades" statistic which tells the maximum days a trade took to close in profit.
• Spot markets only
Obviously, trading without stop loss means no leverage.
█ BACKTEST RESULTS
The backtest settings used in this snapshot are the following:
Initial Capital: 10 000€
Order size: 1 000 €
Commission: 0.1€ per order
Slippage : 10 ticks
Please read the author instructions below for access and automation.

Momentum3A Momentum indicator based on RSI.
Usage:
1. RSI divergence and hidden divergence
2. RSI over-sell and over-bought
3. 1st order info: when rsi>0, background is green; when rsi<0, red
4. 2nd order info: when rsi increases, rsi line is green; when decreases, rsi is red.
TDI Traders Dynamic Index Alerts v1 - BonavestTo add this indicator to your charts:
Click the 'Add to Favorite Scripts' button down below this description.
This indicator places BUY and SELL tags on the chart using the Trader's Dynamic Index Indicator created by Dan Malone. This indicator is RSI based and is best used with ranging markets and will tend to create a trail of false signals (colored tags) when price is at it's extremes for a long period of time. Utlizing some other indicator such as a volume based one will assist in optimizing signals.
I have used this indicator with success for a few years, however I do not plan to support users of this indicator. It is offered as-is.
I use this indicator for:
Counter Trend Trading (colored tags)
Detecting Best Entries to Follow Trend (gray tags)
Trading Extreme Overbought/Oversold Price Areas (bright colored tags)
Detecting RSI Divergences (circles)
SETTINGS
Custom Timeframe - Default current chart timeframe. Custom selection only works when selecting a smaller timeframe than what is on the chart.
Lengthrsi - RSI Period
Lengthband - TDI Band Length
Lengthrsipl - TDI Price Line Length
Lengthtradesl - TDI Signal Line Length
There are 5 Built-In Notifications already created for you and are available by simply right clicking in the indicator area and selecting:
Condition: TDI Alerts v1
Then 1 of the 5 Alerts:
BUY Signal - All Green colored tags
SELL Signal - All Red colored tags
Gray BUY signal - All Gray BUY tags
Gray SELL signal - All Gray SELL tags
All Signals - All colored and gray tags
This adaptation was based off of the original code from the talented LazyBear.

Divergence OBV RSI[mado]Divergence screener for OBV RSI
Regular Bullish: "D" navy label
Hidden Bullish: "H" navy label
Regular Bearish: "D" red label
Hidden Bearish: "H" red label

Trade Manager/Pnl and Risk-Reward Panel (Plug&Play)Hello traders
The Trade Manager Standalone is finally back and with many more built-in features.
I. 💎 SCRIPTS ACCESS AND TRIALS 💎
1. No TRIAL is available for that script. Available only with one-time payment on my website .
2. My website URL is in this script signature at the very bottom (you'll have to scroll down a bit and going past the long description) and in my profile status available here : Daveatt
Due to the new scripts publishing house rules, I won't mention the URL here directly. As I value my partnership with TradingView very much, I prefer showing you the way for finding them :)
3. Many video tutorials explaining clearly how all our indicators work are available on your website > guides section.
4. You may also contact me directly for more information
II. 🔎 What is a Trade Manager?🔎
2.1 Concept
Standalone Trade Manager compatible with any indicator.
Once connected, whenever you'll update your Algorithm Builders or your indicator, the Trade Manager Stop-loss, take-profit levels, and analytics get updated automatically. #bold #statement #but #actually #true
2.2 How hard is it to update your indicator?
We'll send to our customers, a comprehensive and easy tutorial, to make any indicator compatible.
I guarantee you, it should take no more than 2 minutes per indicator. We made it easy, fun, and awesome. #bolder #statement
III. The amazing benefits of our🔌&🕹️ (Plug&Play) system
Hope you're ready to be impressed. Because, what I'm about to introduce, is my best-seller feature - and available across many of my indicators.
In TradingView, there is a feature called "Indicator on Indicator" meaning you can use an external indicator as a data source for another indicator.
I'm using that feature to connect any external indicator to our Trade Manager (Plug & Play) - hence the plug and play name. Please don't make it a plug and pray :) it's supposed to help you out, not to stress you even more
Let's assume you want to connect your RSI divergence to your Trade Manager.
I mentioned an RSI divergence but you may connect any oscillator (MACD, On balance volume, stochastic RSI, True Strenght index, and many more..) or non-oscillator (divergence, trendline break, higher highs/lower lows, candlesticks pattern, price action, harmonic patterns, ...) indicators.
THE SKY IS (or more likely your imagination) is the limit :)
Fear no more. The Plug&Play technology allows you to connect it and use it the backtest calculations.
This is not magic ✨, neither is sorcery, but certainly is way beyond the most awesome thing I've ever developed on TradingView (even across all brokers I know). #bold #statement #level #9000
TradingView is the best trading platform by far and I'm very grateful to offer my indicators on their website.
To connect your external indicator to ours, we're using a native TradingView feature, which is not available for all users.
It depends on your TradingView subscription plan ( More info here )
If you intend to use our Algorithm Plug&Play indicator, and/or our Backtest Plug&Play suites, then you must upgrade your TradingView account to enjoy those features.
We value our relationship with our customers seriously, and that's why we're warning you that a compatible TradingView account type is required - at least PRO+ or PREMIUM to add more than 1 Plug&Play indicator per account.
We go in-depth on our website why the Plug&Play is an untapped opportunity for many traders out there - URL available on my profile status and signature
IV. 🧰 Features 🧰
4.1 Stop-Loss Management
For what's following, let's assume that 2 is the stop-loss value you inserted in the indicator, and the Algorithm Builder gives a BUY signal.
This is NOT a recommendation at all, only an example to explain how this feature works.
- %Trailing: The Stop-Loss starts 2% away from the entry price - and will move up (because we're on a BUY trade as per our example) every time your trade will gain 2% profit
- Percentage: The Stop-Loss stays static 2% away from the entry price. There is no trailing here
- TP Trailing: This is a very awesome feature. The stop-loss is set 2% away when the trades start.
When the TP1 is hit, the stop-loss will be moved to the Entry price (also called breakeven).
When the TP2 is hit, the SL is moved to the previous TP1 position
- Fixed: Set the Stop-Loss at a fixed position (value should be in currency/units)
4.2 Take Profits Management
You can manage up to 2 take profit levels defined as a percentage or price value.
The expected input is in percentage value (for instance, setting the % target of TP1 to 2% will set the TP1 level 2% away from the entry price
4.3 Built-in Trade Manager
This is very likely the most loved utility script that we shared on TradingView.
It's included in your Algorithm Builder - Single Trend+, and will certainly help you immensely to analyze your charts and your trades.
We made sure that all the graphical elements on the chart will be updated in real-time whenever our user change anything on the indicator configuration.
You'll also be able to change the Trade Manager labels positions as you wish :)
4.4 Built-in Risk-to-Reward Panel
The good stuff doesn't stop here.
You'll notice that this sometimes green (when in a LONG), sometimes red (when in a SHORT) panel at the right of your chart.
It displays for the selected trading algorithmic (see 2.3.2 above), a ton of useful real-time analytics.
- Entry Price: the price when the Algorithm Builder will give a signal.
- The Trade PnL in percentage.
- Entry Stop Loss: Distance (in currency/units) between the selected stop-loss algorithm (percent, trailing, TP trailing, etc.) and the entry price.
- Entry TP1: Distance (in currency/units) between the entry price and the first take profit
- Entry TP2: Distance (in currency/units) between the entry price and the second take profit
- Risk/Reward TP1: Using the Stop-loss distance at entry, and Take Profit 1 at entry to compute the risk-to-reward ratio.
- Risk/Reward TP2: Using the Stop-loss distance at entry, and Take Profit 2 at entry to compute the risk-to-reward ratio.
For more details, please check the guides section of my website. Links are in my signature and profile status.
4.5 Built-in PnL real-time calculations
YES!!!! you read it correctly
The panel displays the risk-to-reward ratios but also the PnL (Profit and Loss in percentage value) of the current and last trade
V. 🔔 Alerts 🔔
We enabled the alerts on the:
1. Stop-Loss
2. Take Profit 1
3. Take Profit 2
VI. 🤖 Compatible with trading bots? 🤖
I'm very aware of all existing solutions out there allowing us to capture the TradingView alerts (Instabot, ProfitView, ...) and forwarding them to the brokers to automatize your trading.
You'll find a more detailed answer on our website.
If you have any doubt or question, please hit me up directly or ask in the comments section of this script.
I'll never claim I have the best trading methodology or the best indicators.
You only will judge and I'll appreciate all the questions and feedback you're sending my way.
They help me a ton to develop indicators based on all the requests I received.
Kind regards,
Dave

MACD and RSI divergence by Rexio v2Hi everyone!
I wrote this indicator for intraday trading and it cannot be use only by itself you need to at least draw some S/R lines to make it useful. It is based at MACD histogram and gives signal when it sees divergence on MACD/RSI/MACD's Histogram (or all at once - settings) when macd's histogram switchs trend. Im using it to playing with a trend most of the time looking for hidden divergence at higher time frame and after that looking for regular divergence at lower time frame.
Im not a computer programist nor professional trader so it is only for educational purposes only.

(bullyena) Stoch RSI + RSIFeatures:
RSI and Stoch RSI in one indicator
RSI divergence signals
Stoch RSI crosses signals
RSI exhaustion
RSI OS/OB colors
Alerts for:
RSI divergence
Stoch RSI crosses
Relative Strength Index Divergence MarkFeatures:
Bright & Dark theme option. Choose the type that you can see clearly.
Customizable RSI length parameters.
Mark all the RSI Divergence signals on your chart!
Highlight bar color for divergence signals.
Getting Started:
Replace your RSI indicator with this one.
You can add divergence alarms of any time frame!
Contributing:
You can report bugs or issues under this page.
Any advice would be helpful for improving this indicator's accuracy.
Application:
This is an invite only indicator.

AtraxaLooking for:
X - Momentum divergence
Y - RSI Divergence
Z - Stochastic oversold/overbought region
Filter some signals with cmf
Each overlap prints different combination example...
XY - Momentum + RSI
YZ - RSI + Stochastic
tvial/rsiSimple RSI indicator including:
- 40 & 60 support/resistance
- visual marker (orange bgcolor) on RSI length limit to spot actual RSI divergences
- simple layout

RSI BitfinexRSI applied to BTC longs/shorts ratio on Bitfinex. You can use the oscillator as you'd use RSI:
- Divergences
- Oversold/overbought signals
- R/S on the indicator
- Trend indication
- etc

Q-Stochastic RSI (0–100) — RSI Divergence Addedtesting divergence, and momentum detection with both RSI raw and stoch rsi, pivot point always shown on RAW RSI
Jitendra: MTF AIO Technical Indicators with Trend ▲▼Jitendra: MTF AIO Technical Indicators with Trend ▲▼
Why We Designed this Indicator
we build this indicator to Analysis Multi-timeframe Technical Data in dashboard to get Better and Quick Data in which Time Frame where it is in Momentum or in Swing,
By combining multiple technical indicators with trend direction arrows and displaying them in a customizable table.
It also optionally plots some indicators EMA, VWAP, Supertrend, Bollinger Bands on the chart.
Traders who want a compact technical summary across multiple timeframes without switching charts.
Quickly assess trend strength, momentum, divergence, volume pressure in one glance.
Combine with price action to make higher-confidence entries/exits.
How to Use This Indicator
In setting there are Two parts
First Part - for Plot Multi EMA, Bollinger Band, Supertrend 10,2 & 10, 3 factorial
Second Part- To get Data on Table for Quick Analysis
Chart Plots With Enable Disable Toggle in Setting
VWAP (optional)
4 EMAs (lengths configurable)
Bollinger Bands (optional)
Two separate Supertrend indicators with custom ATR period and multiplier
Indicators Data in Table
For each selected timeframe:
VWAP position (price above/below)
MACD value + trend arrow
MACD Histogram (optional)
RSI value + arrow (rising/falling)
ADX value + arrow (strength rising/falling)
+DI / -DI values + trend arrows
RSI Divergence detection (regular + hidden)
EMA levels (up/down relative to price)
EMA crossover (EMA1 vs EMA2 arrow)
Stochastic %K
Volume Matrix:
Raw volume
20 SMA volume
Volume % change from SMA
Multi-Timeframe Support
Current timeframe + up to 5 user-defined timeframes (e.g., 1H, 4H, Daily, Weekly, Monthly)
Customizable Toggles
Enable/disable any indicator
Choose which EMAs to show
Show/hide trend arrows
Choose which volume metrics to display
Choose table position (top_left, top_right, etc.)
Choose table text size
Trend Arrows & Colors
Green ▲ = bullish / rising trend
Red ▼ = bearish / falling trend
Gray – = neutral/no change
Background colors indicate overbought/oversold, trend strength, or volume surge.
Indicator Data Fetch PINE CODE Short Summary
request.security() → pulls data from the selected timeframe (tf).
Each indicator’s calculation can be wrapped inside request.security() so the values are computed on that timeframe.
//@version=5
// === 1. VWAP ===
vwap_htf = request.security(syminfo.tickerid, tf, ta.vwap)
// === 2. MACD ===
macd_src = request.security(syminfo.tickerid, tf, close)
macd_val = ta.ema(macd_src, 12) - ta.ema(macd_src, 26)
macd_sig = ta.ema(macd_val, 9)
macd_hist = macd_val - macd_sig
// === 3. RSI ===
rsi_htf = request.security(syminfo.tickerid, tf, ta.rsi(close, 14))
// === 4. ADX & DI ===
adx_htf = request.security(syminfo.tickerid, tf, ta.adx(14))
plusDI = request.security(syminfo.tickerid, tf, ta.plus_di(14))
minusDI = request.security(syminfo.tickerid, tf, ta.minus_di(14))
// === 5. Supertrend ===
= request.security(syminfo.tickerid, tf, ta.supertrend(3, 7))
// === 6. Bollinger Bands ===
basis = ta.sma(close, 20)
dev = ta.stdev(close, 20)
bb_up = request.security(syminfo.tickerid, tf, basis + dev * 2)
bb_low = request.security(syminfo.tickerid, tf, basis - dev * 2)
// === 7. Stochastic ===
k = ta.sma(ta.stoch(close, high, low, 14), 3)
d = ta.sma(k, 3)
stochK = request.security(syminfo.tickerid, tf, k)
stochD = request.security(syminfo.tickerid, tf, d)
// === 8. EMA ===
ema20 = request.security(syminfo.tickerid, tf, ta.ema(close, 20))
ema50 = request.security(syminfo.tickerid, tf, ta.ema(close, 50))
// === 9. Historical Volatility (HV) ===
logReturns = math.log(close / close )
hv = request.security(syminfo.tickerid, tf, ta.stdev(logReturns, 20) * math.sqrt(252))
plot(vwap_htf, "VWAP")
plot(macd_val, "MACD", color=color.blue)
plot(rsi_htf, "RSI", color=color.purple)
