在腳本中搜尋"rsi"

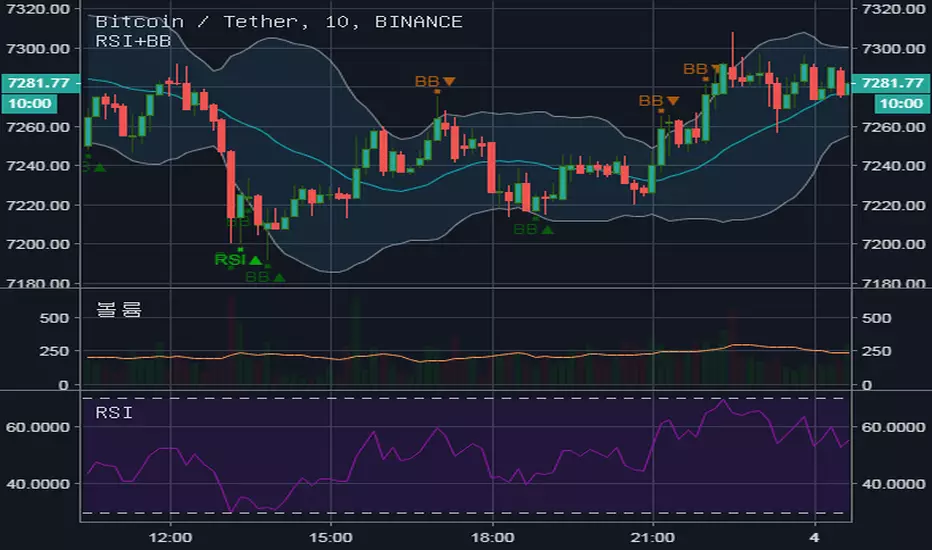
RSI and Bollinger Band simple signal ⓙRSI and Bollinger Band simple signal.
Please, use ten minutes time frame signal for buying.
Please, use shorter time frame signal for selling.
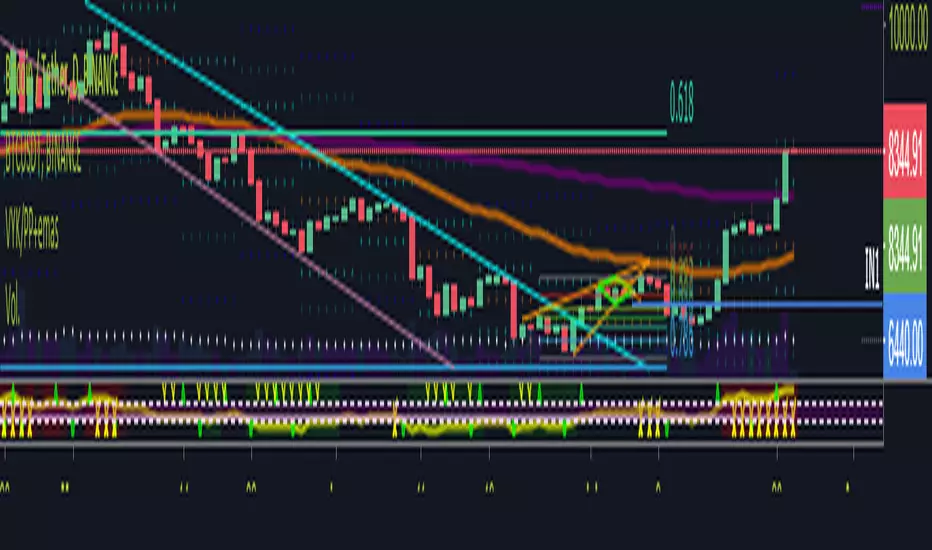
RSI+Bollinger Bands+ EMARSI on pivot points (you can chose the source) with Bollinger Bands and a EMA


RSI/Stocastic VykorowskyRsi and stochastic in one indicaroe, it shpw oversold/overbought areas and indicates with a triangle when sto cruces up or down. Also there's a tick when sto in oversold and an X when overbought.


RSI/Stochastic
RSI with values 60-40 Displays a check when it crosses below 40 and an X when it is above 60 (Team DM System) Stochastic displays purchase / sale zones.


RSI Currency Strength IndicatorRSI based currency strength indicator. Other indicators only give 7 currencies, leaving NZD. This one is an updated version which gives all 8 major currencies.


RSI with ChannelsRSI with support/resistance lines in increments of 5. I've found this to be another good indicator to tell where the momentum is going.
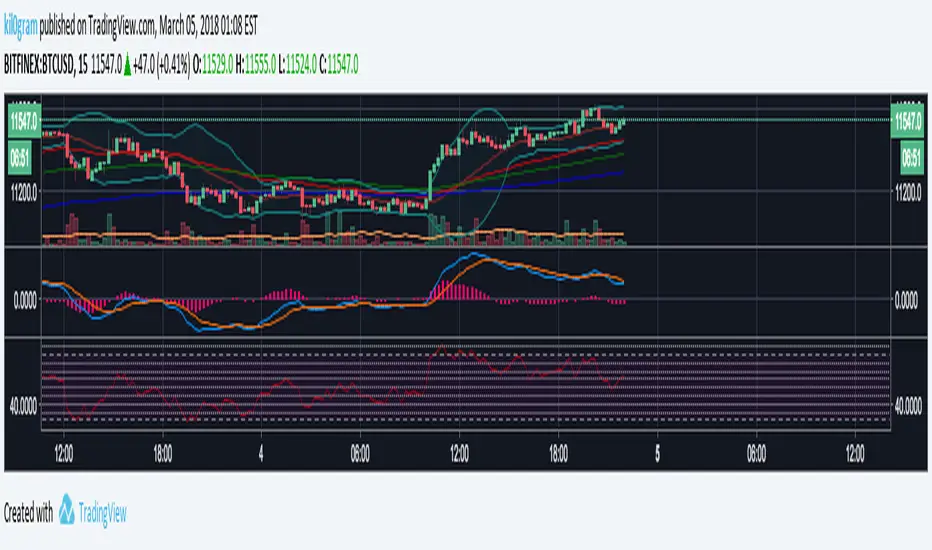

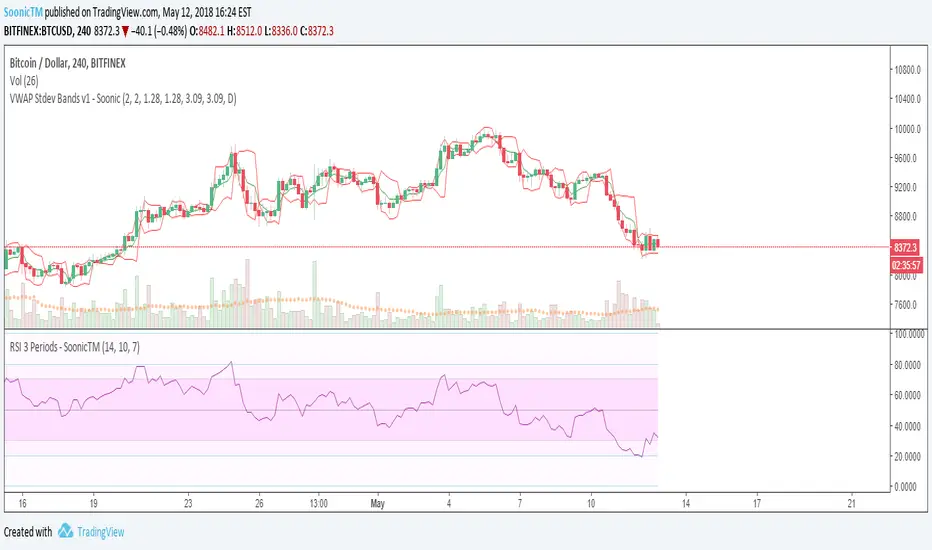
RSI with Bollinger Bands [Erionis]RSI + Bollinger Bands. Usefull to see possible reversal points. Use it accordingly.
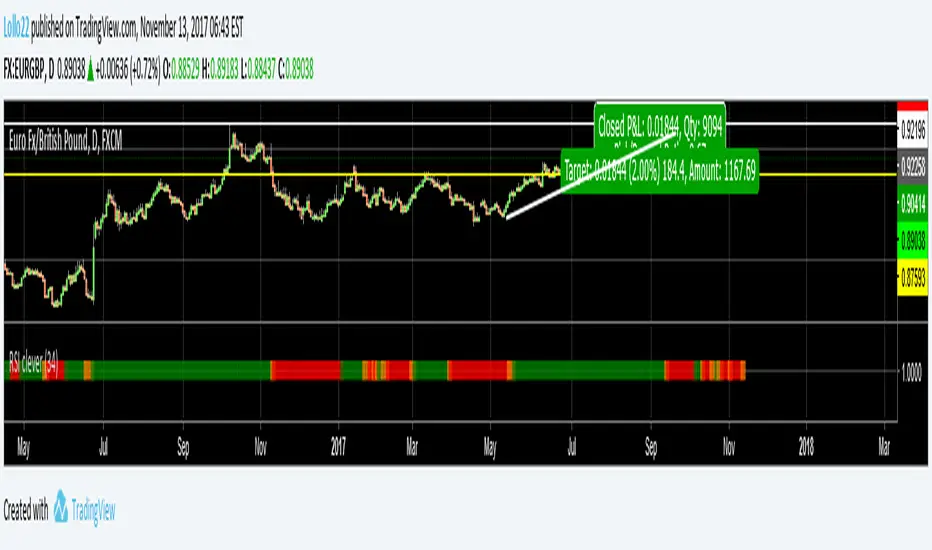
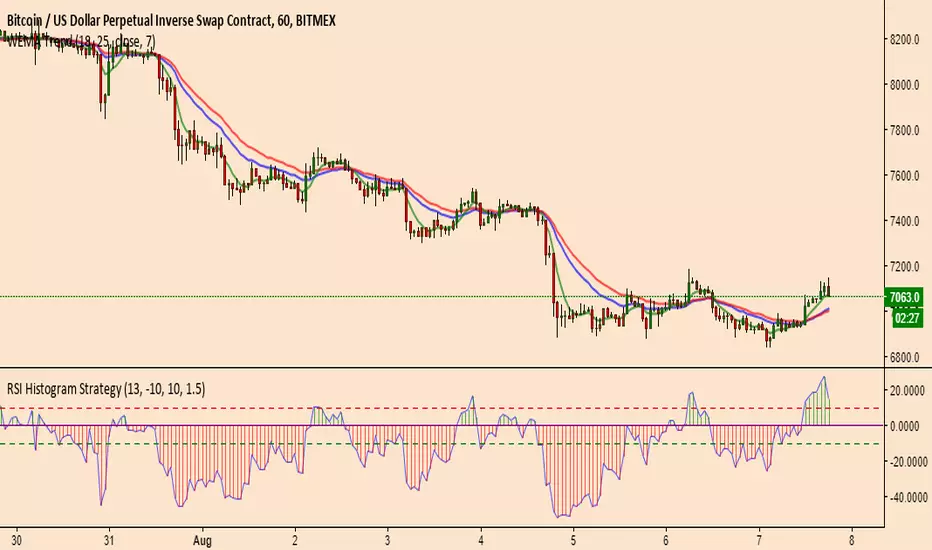
RSI CleverRSI Clever let's you trade in the direction of the market
You can add it to your entry rules as comfirmation of market direction
Green= long
Red= short
Orange= position shifting