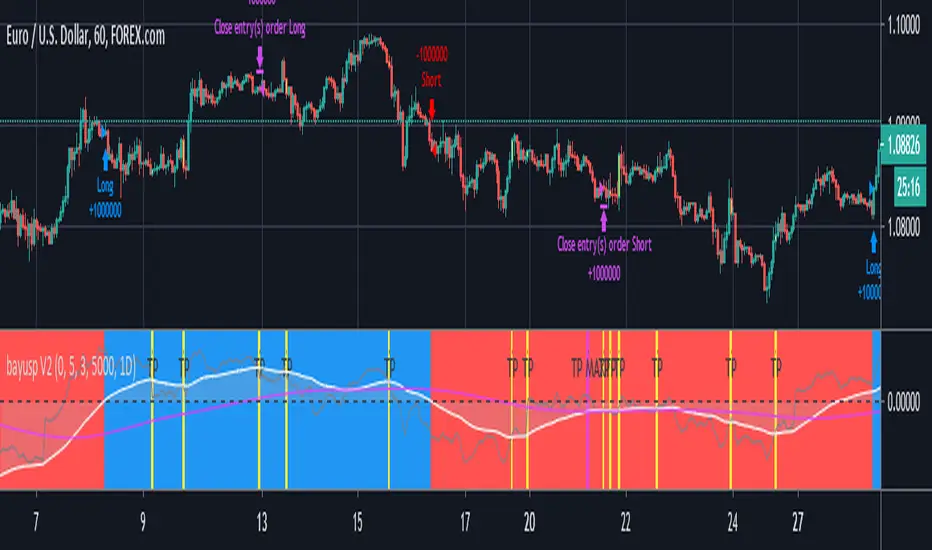
bayusp V2Using multi source like RSI , MACD , Stochastic , SMA , EMA and Huge Noural Network to Predicted Open Position.
在腳本中搜尋"rsi"
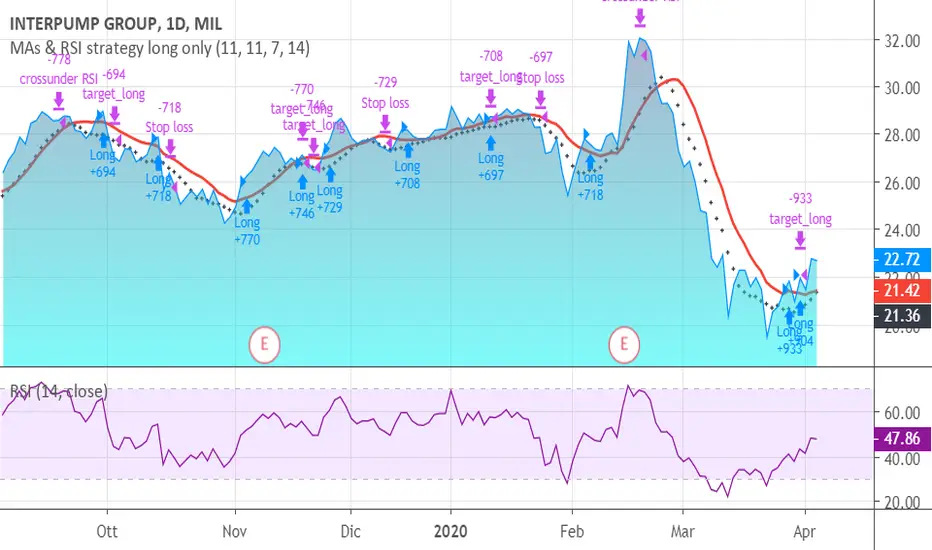
MAs & RSI strategy long onlyThis system originates from many articles by Enrico Malverti, Trading System, 2015.
Many trading systems are more stable if you use simple and not so innovative indicators, like exponential moving averages and Relative Strengthe index.
Differently by the original article:
- there is no ATR Filter, but we have introduced a Schaff Indicator. If you have multiple shares/commodities to choose, prefer what has a better value of Schaff;
- there is no fixed stop loss but a second moving average (fast), used as target. There are also Simple Mov Averages on lows (trailing stop loss for long) and a SMA on highs (trailing stop loss for short position).
Be careful, in the system only long case, because being short is not the reverse of being long (as stated in my blog)
SMA on highs are therefore only graphically put.
In this version, I’ve changed the “religious” use of EMAs (“sponsored by” Alexander Elder) to “ordinary” MAs: this because since simple moving averages measure all the factor in addition egual each one, this involve a sort of “offset” in the graph, while EMAs give a major “importance” to the last value (last close itself, you’re already considering): therefore this calculation may be counterproductive.
HOW TO OPERATE
BUY when prices crosses over SMAon long period (we suggest, however, sma long = Sma fast period = no. 11 for italian and european shares)
SELL when
prices go under SMA on lows (7 period), or under on SMA fast!
RSI crosses under level 70 or is higher than 75 (or 80, but in code there is 75)
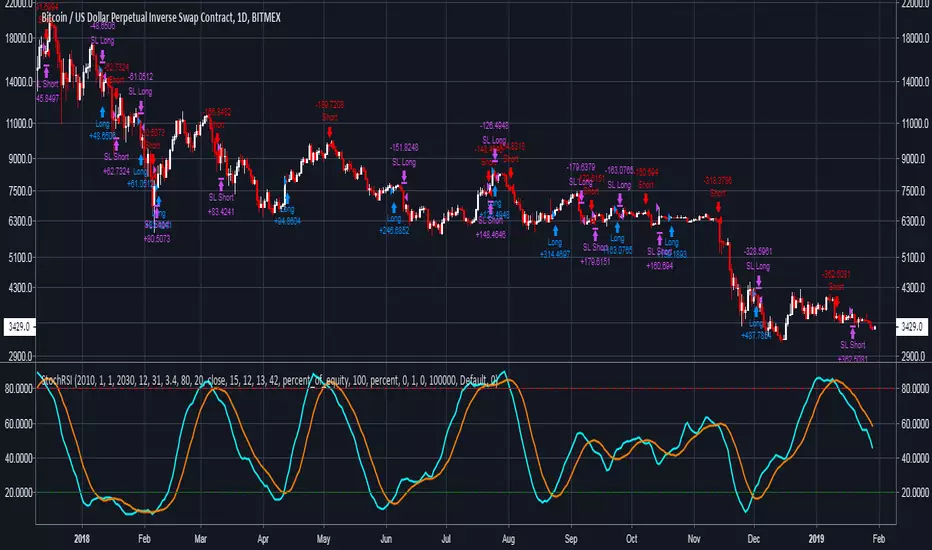
inwCoin Stochastic RSI + MACD Filter StrategyinwCoin Stochastic RSI Strategy with MACD as trend filter.
Parameters Setup
===============
* everything are self-explanatory.
Entry Logic
===========
Long/Cover Short Signal :
- If SmoothK > Bottom Line and SmoothD is crossing up Bottom Line = BUY SIGNAL
- In human word : Both lines cross up bottom line from below.
- If "Use MACD as trend filter" checked, long signal will trigger if MACD > 0
Short/Close Long Signal :
- If Smooth K < Top Line and SmoothD is crossing down Top Line = SELL SIGNAL
- In human word : Both lines cross down top line from top.
- If "Use MACD as trend filter" checked, short signal will trigger if MACD < 0
How to use in real trade
===============
1) Just add to the chart and see the backtest result. Make sure to adjust commission and slippage properly.
2) Recommended to using in Daily Timeframe.
Extra
=====
Short Entry Example ( 2018-2020 )

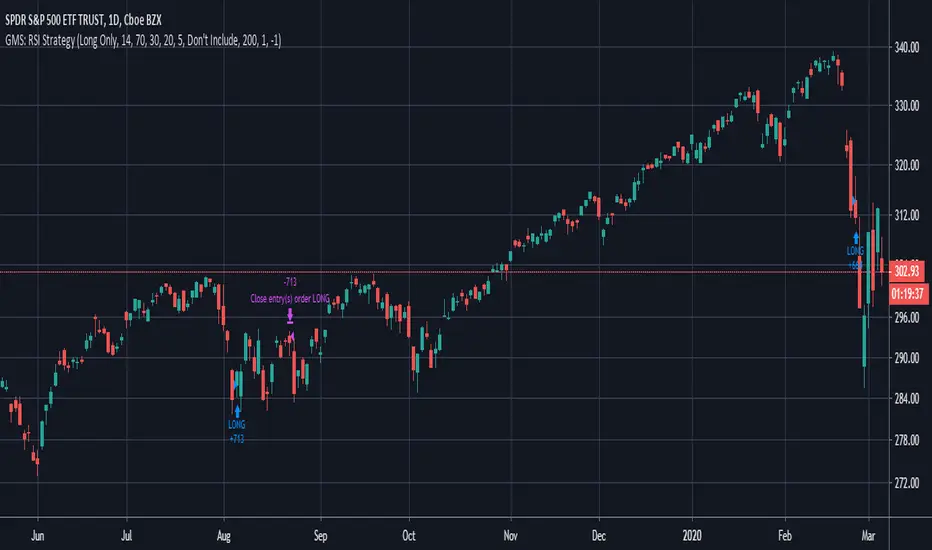
GMS: RSI StrategyThis is just a basic RSI strategy that it easy to use and quite comprehensive so you can quickly test out an idea based on RSI.
- I made it comprehensive in that you can select long, short, or both.
- There is a simple moving average trend filter. You can filter for trades above, below, or don't include it at all.
- The exit is based on a simple moving average.
The source code should be open if you want to see it or modify it for your own project. I hope it helps!
Andre
Global Market Signals
2 Emas and RSI simple system (Malverti) - long onlyThis system originates from many articles by Enrico Malverti on 2015, 09 : "i-trading-systems-parte-5".
Many trading systems are more stable if you use simple and not so innovative indicators, like exponential moving averages and Relative Strengthe index.
Differently by the original article:
- there is no ATR Filter, but we have introduced a Schaff Indicator. If you have multiple shares/commodities to choose, prefer what has a better value of Schaff;
- there is no fixed stop loss but a second moving average (fast), used as target. There are also Emas on lows (trailing stop loss for long) and a Emas on highs (trailing stop loss for short position).
Be careful, in the system only long case, because being short is not the reverse of being long (also indicators have a different behaviour - sauciusfinance altervista: see article: why-going-short-is-immoral-and-dangerous)
Emas oh highs are only graphically put.
BUY when prices crosses over Ema on long period (we suggest, however, Ema long = Ema fast period = no. 14)
SELL when
- prices go under Ema on lows (7 period), or under on Ema fast!
- RSI crosses under level 70 or is higher than 75 (or 80, but in code there is 75)

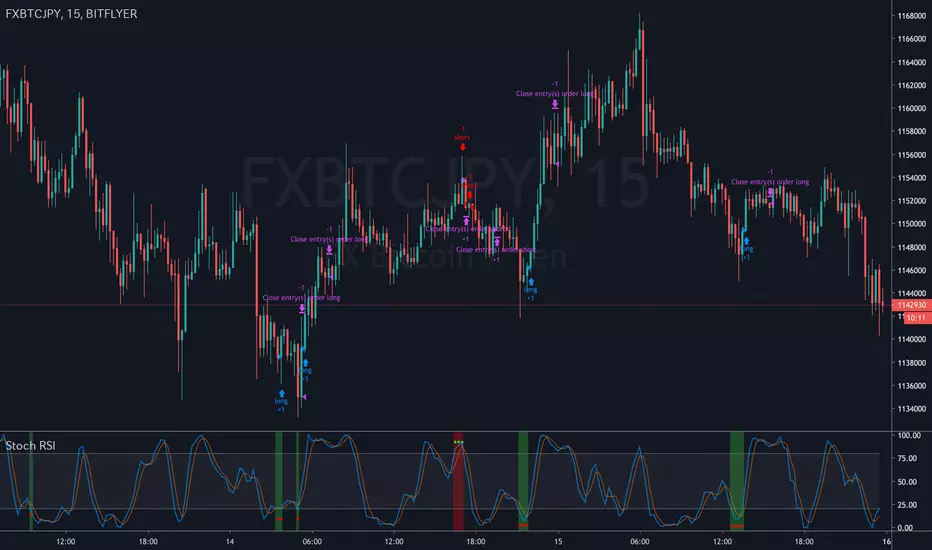
Noro's BottomSensivity v0.6 strategy + rsi + AlarmThe original indicator is Noro's BottomSensivity v0.6
I simply turned noro's bottom sensibility 6.0 indicator, which I consider a great tool to find market bottom, into a strategy.
I also added an additional RSI filter with inputs that can be set by the user for entry and exit from the market.
I have tried to insert an alarm so that I can be notified when this particular purchase condition is formed.
I also tried to insert an additional filter that would allow me to make further pyramid purchases only after a certain percentage of drawdown from the first entry so as to reduce the average purchase price but I was not able ... if someone could implement this I would appreciate it.
Well..this is the first time that I try to program / modify a strategy / indicator, there are certainly some gross errors (as in my English too), please forgive me, I will appreciate the corrections that more experienced users will want to make.
I wish you all a good day, pfjons


Multi RIS Length RSI Strategy calibrated to 20min timeframeI have been working on many itterations of this script, on multiple time frames, with multiple settings.
It's not exactly how I want it, but if used on the 20 min timeframe (I chose this one to publish, not because it's the most profitable, or percent profitable , but for multiple other reasons.
1) From my back testing, this seems to be the most stable (gives the greatest margin for error). By that I mean, I am not a bot, I am a human trader, so I actually have to sleep, and work, and can't always trade all the time when I when I get my signals. So I need some margin of error.
The 20min time frame gives me this, it's still decently profitable (52K), and allows me some margin of error for being human.
2) It not exactly how I want it, because you have to use it in conjunction with the strategy tester to see if it is in longs or shorts (open trades). You can't see that on the app, or even if you are logged in to TV on a browser on a smart phone. At least I cant, I can only see the strategy tester when I am logged in on my computer, which obviously I can not be all the time.
3) It's also not exactly how I want it because it doesn't tell you when it is switching from buying additional longs (or shorts), and closing them out, and reversing. You can figure this out from the strategy tester, but I would like my script to make it more clear in real time.
4) The alerts on the script only fire after the current bar is closed. So really to use this you need to be a non free member or TV, because then you can add the appropriate RSIs to your chart, and set up real time alerts on them that will fire in real time, as opposed to displaying on the chart after the bar closes (a lot can happen in 20 minutes). Which is sad, and not my intent, I want this to be useful to free members, I just don't know how to do that given they don't have custom time frames (like 20 min), and multiple real time alerts. I can't fix that, that's a limitation of TV.

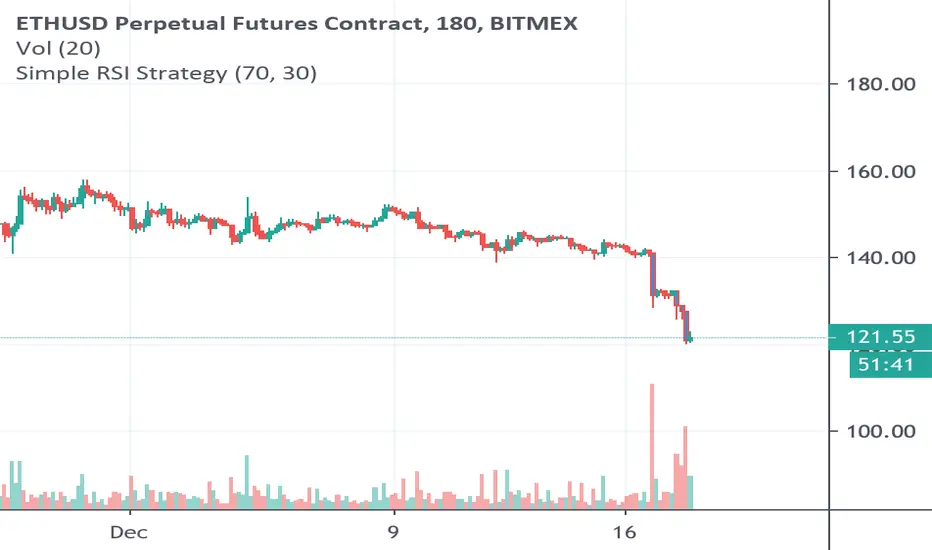
Simple RSI Strategy Buy/Sell at a certain levelSimple Strategy based on RSI, using overbought or oversold levels, defined by us, sell or buy an asset.
Backtest: ETHUSD (Bitmex) - 3h
BUY SELL Based on Average RSIThis Script generates buy sell signal based on RSI Average Calculation.
Best to use in one hour time frame.

[astropark] Super Stochastic RSI [strategy]Dear Followers,
today a new Scalper Tool , which works great on 3 minutes and 5 minutes timeframes !
I called it " Super Stochastic RSI ", as it is based on StochRSI and inherits some basic functionality from it.
If you check its settings, you will see that you can have 3 different buy-sell sources (first two are active by default):
STRONG BUY/SELL : buy when green area deeply falls into oversold zone and sell when red area gets into overbought zone (you can set and edit at which level oversold and overbought zones start);
K/D CROSSES : buy when k-line cross above d-line and sell viceversa (you can set and edit specific cross ranges for both buy and sell);
WEAK BUY/SELL : buy when green area at least go below 50 level and sell when red area at least goes above 50 level (you can edit both levels); these conditions are highlighted as background color and are very useful for taking (at least partial) profits in trades.
By default the script will be placed as oscillator on a specific pane below the chart, but
> you can disable the oscillator plot by enabling the "hide all plot" option
> and place it as overlay on chart by clicking on the black arrow at then end on the indicator name in chart and selecting "move to -> existing pane above"
This strategy can trigger till 10 buy or 10 sell signals in a row before reverting, so use a proper money management .
Strategy results are calculated on 20 trading days using 1000$ as initial capital and working at 10x leverage.
The user who wants to use this strategy, especially via an automated bot, must always set a stoploss at 3-5% from entry point or use a proper risk management strategy .
This is not the "Holy Grail", so use it with caution.
This script will let you backtest the strategy and find best settings for your preferred market.
The alarms script version of this indicator, which will let you set all notifications you may need in order to be alerted on each triggered signals, can be found here below:
This is a premium indicator , so send me a private message in order to get access to this script .

AlgoNinja RSI/MACDAlgoNinja buy/sell signal based on MADC/RSI/StochRSI data. BETA - Use at your own risk!

Sto2 Stochastic RSI for BitcoinStochastic RSI based oscillator with a Rate of Change function added to avoid sideways movements.
Designed around BTC/USD but may be useful elsewhere.
INSTRUCTIONS
Green = go long
Red = go short
White = No trade zone (sideways with not much volatility)


DB Rsi-Stoch-Macd StrategyA Long/Short strategy based on combined signals from MACD, Stochastics, ATR, RSI and VIX.
Developed with input from the BoldTimers Investment group.


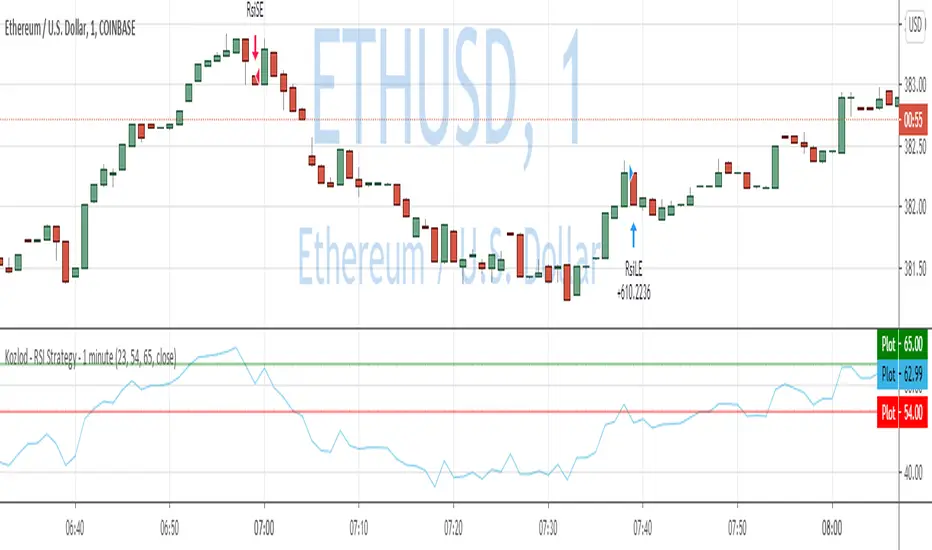
Kozlod - RSI Strategy - 1 minute - ETHUSDTrying to find simple strategies with optimal parameters which work well for certain symbols/timeframe.
Found that basic RSI strategy without any position management works pretty good for 1m chart for BTCUSDT.
It might not work very good on it's not but can give you a pretty good base for more complicated indicators.
Also, some position management as simple as static SL and PT can improve performance quite a lot.
And remember:
Past performance does not guarantee future results.
Stochastic RSI SrategyThis strategy is based on Stochastic RSI fast and slow line crossing and has the advantage of being adjustable with high degree of freedom.
This indicator provides the following three trading mechanisms:
1. Enter each time the K and D lines cross
2. Only enter when the K line and the D line cross outside the threshold, and reverse trade when the next time cross outside the threshold.
3. Only enter when the K line and the D line cross outside the threshold, and close the position at the next cross.
It also provides the following two functions to help u evaluate trading profit:
1. Select specific time test.
2. Stop loss setting.
P.S. If the 'Order’s limit was reached’ message appears, you can use the specific time test function to narrow the test range.
MOMENTUM INDICATOR / INVERS FISHER / RSI / MTF / STRAT// Strategy based on Momentum indicator and Inverse Fisher transform with Multi Time Frame function on Relative Strength Index (RSI)
// Greatest effect on 15M+ time frame
// Created and based on Binance chart
// Working with comission
// No repaints
