RSI+ChannelbandsThis Indicator displays a normal RSI with overbought/-sold lines which is calculated with donchian channels, pivot channel, bollinger bands and three horizontal lines.
You can averaged the channels, bands and h-lines in any combination or you can use just one of them for calculating the overbought/-sold lines.
The midline is colored in default settings in yellow for upptrending and blue for downtrending.
在腳本中搜尋"rsi"

RSI Divergence (based on an EMA)// Was just bored and thought I'd see what happens if RSI was just based on comparing the EMAs instead of confirmed highs / lows.
// Feel free to test and let me know if you find any useful settings (instrument, timeframe, ema).

RSI timeframe combinationThis indicator displays the RSI levels of two different timeframes defined by the user (default value are 5mins and 15mins) with the overbought (default 70) and oversold (default 30) levels.

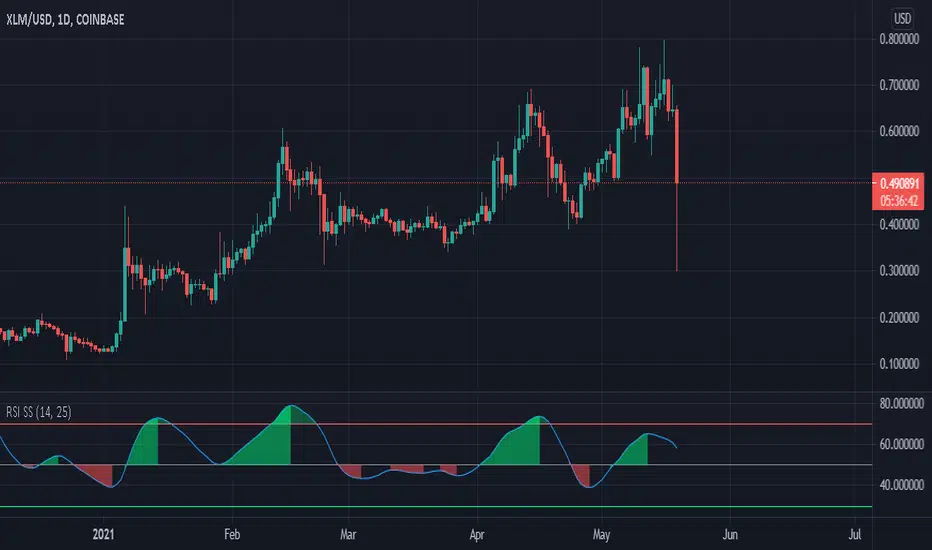
RSI Simple and Smoothmade this RSI for beginners who are annoyed by the jittery signals. Uses a HMA to smooth out the data. I made oversold line green and overbought line red where as the oscillator is green above 50 and red when below 50. This is done intentionally. This is to help remind the user that while there is a downtrend, there is a buy opportunity, and while there is a buy opportunity - there is a downtrend
On the other side, the red overbought line is to remind the user that while there is an uptrend, there is a sell opportunity, and while there is a sell opportunity - there is an uptrend :)
RSI-MFI-STOCH + AverageSimple script that shows you the RSI, MFI and STOCH. Additionally it gives you the average of all 3.

RSI with bands and multiple EMAs Combination of RSI and EMAs, useful in predicting momentum switches and defining overbought/oversold conditions on all time frames.

RSI w MA StrategyThis strategy is mostly for cryptocurrencies, it applies a moving average to an rsi and trades based on the crossings. It includes the indicator that it is made from.

RSI w/ MA, Bars and ArrowsThis is an RSI with an MA attached that delivers buy and sell signals when crossing and displays the difference as a histogram below.

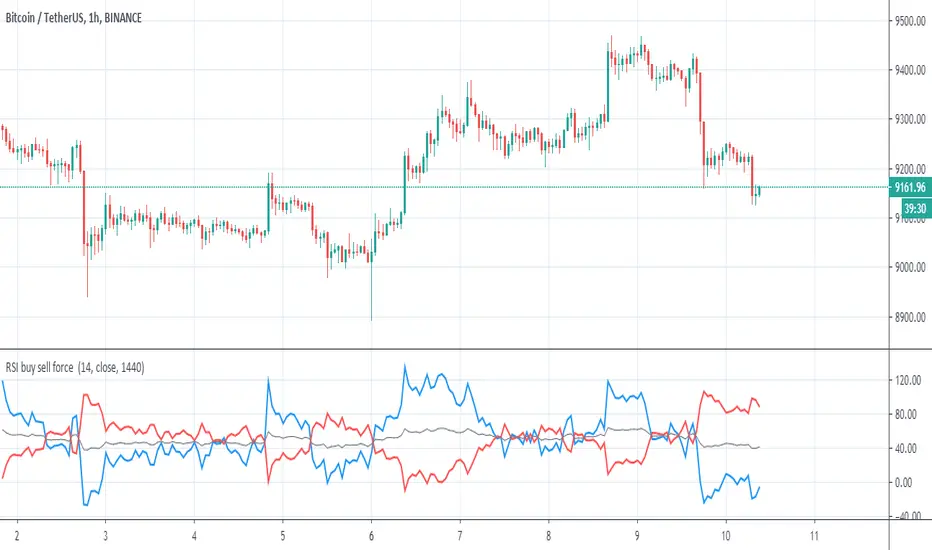
RSI buy sell force ver 1 Very simple script with no security MTF that show RSI buy and sell force
blue above red =bullish period
red above blue =bearish period
or you can try above 0 or bellow 0 as signal
if you want i will add signal after to this one


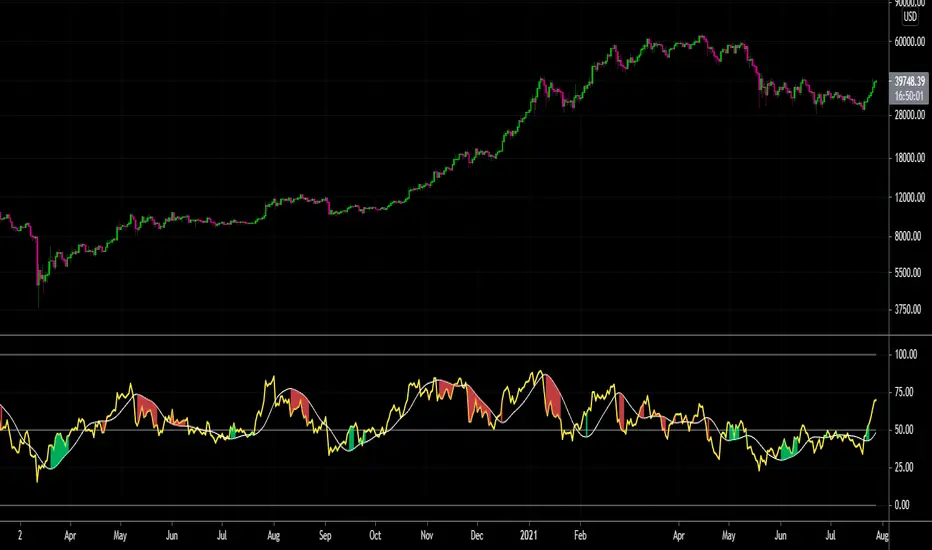
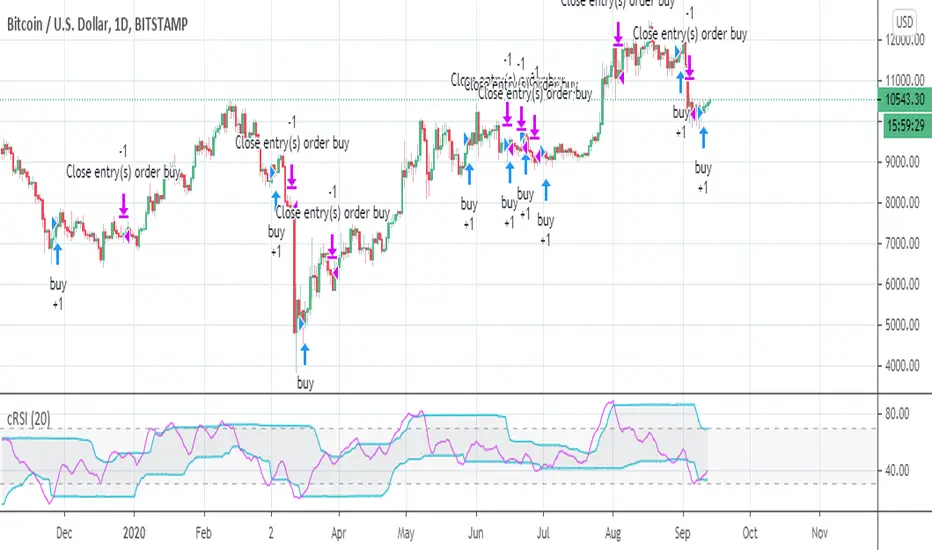
RSI cyclic smoothed strategy backtestI added a few lines of code to "when to trade"'s code to see that backtest result of "RSI cyclic smoothed v2".
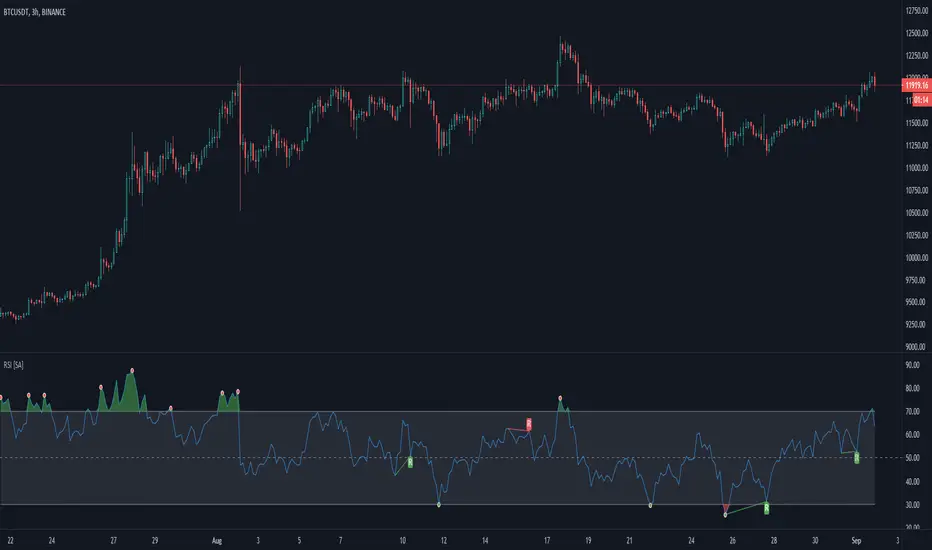
RSI Indicator [SystemAlpha]This is a RSI indicator enhanced with:
- Show Buy and Sell Alert
- Fill on oversold and overbought levels
- Show Regular and Hidden divergence
- Show Divergence Labels
- Generate Alerts: Buy/Sell and Divergence
RSI Plus v1.0 by WilsonThis is a modified version of my RSI Cloud indicator. I have included the option to plot 2 moving averages. Type of moving averages included in the script are SMA, EMA, WMA, VWMA, Hull MA and ALMA. Option to fill colors and to add alerts are included. I shall be including more options in a future update.
Anyone is free to copy and modify the script. Wishing everyone happy and profitable trading.

RSI bands - JDThis indicator can be used to determine a likely trading range, based on different rsi levels, translated to price points
JD.
#nottradingadvice
# DYOR

RSI buy sell force This inidicator show by RSI buy and sell force
the blue is the buy
red line is the sell
gray is avreage of the two
when blue above red is a buy , blue bellow red is a sell.
very simple and nice indicator
RSI IMPORTANT LEVELSThe indicator allows the user to establish importance levels on the indicator, the levels are established by a color stripe. The difference of this RSI with the others is that it allows you to set custom levels and set colors for each value allowing a better user experience.
Default levels:
-75-90 Overbought Levels
-50 Medium level
-25-10 Oversold levels
The indicator was created based on an existing template based on built-in indicators, my work consisted solely of allowing more levels to be established than already existing.

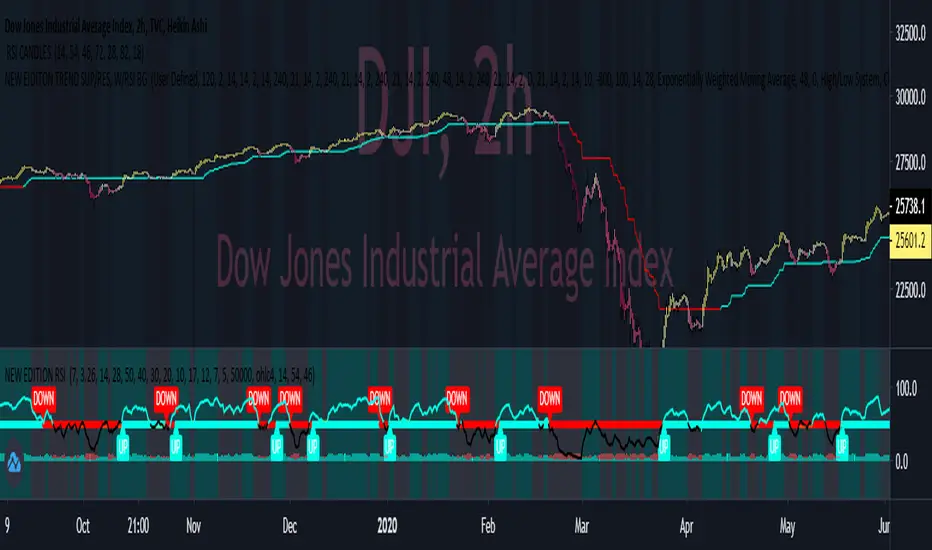
Rsi Candles by Faizan !Hello everyone ,
Rsi candles works well on higher timeframe ,
Go long = Once Aqua candle appears wait for 3 Yellow candle each closing show be higher than prev candle ,
Go Short = Similarly Once Aqua candle appears wait for 3 Pink candle each closing show be lower than prev candle.
RSI Pullback Trend Trading Indicator (LONG Only)***Use at your own risk***
***This is for testing and education only***
I suggest that you also manually add the RSI(5,3,3) on your main chart for analysis.
You can change the settings, but these are the defaults:
Default Main Timeframe = Daily
Default Secondary TimeFrame = Weekly (use around 5X your main timeframe, to check the longer term trend)
Default Stochastic settings ( 5, 3 , 3)
Default Fast EMA : 13
Default Slow EMA : 22
Default ATR : 14
Conditions to show buying signal on main TimeFrame. (Yellow Triangle)
- Check if the MACD Histogram is rising on the secondary timeframe.
- Check if the Stochastic on the main timeframe is below 20.
When deciding to buy, you can use the ATR channels to determine the stop loss and profit target.

RSI Hi-LoThis indicator calculates the average of the highest high and lowest low of the RSI in a 7-period interval.

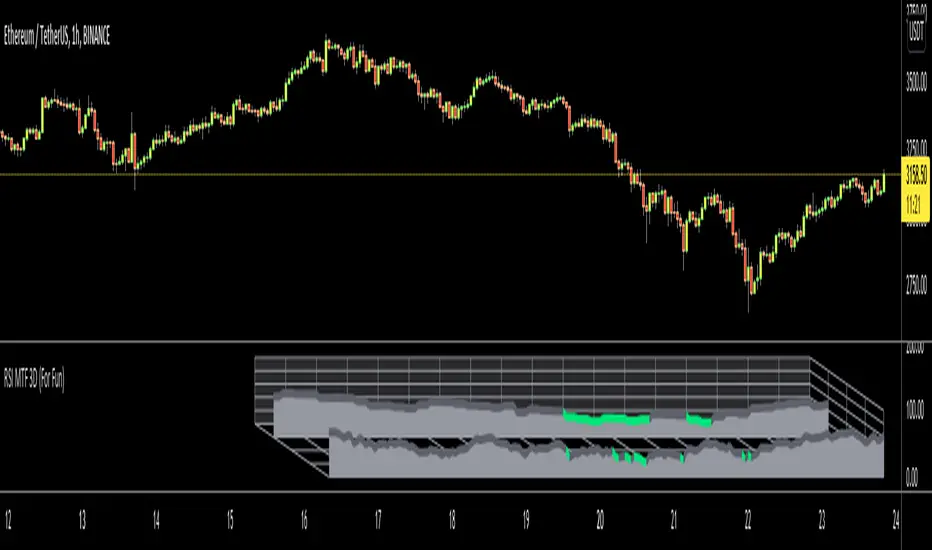
RSI with BGThis is a standard RSI indicator with Background colour and the option to draw the Background colour of the next higher timeframe.
Unfortunately, the 3D timeframe is not working properly (weekly background is not displayed). This is the same problem as with the MACD BG study.

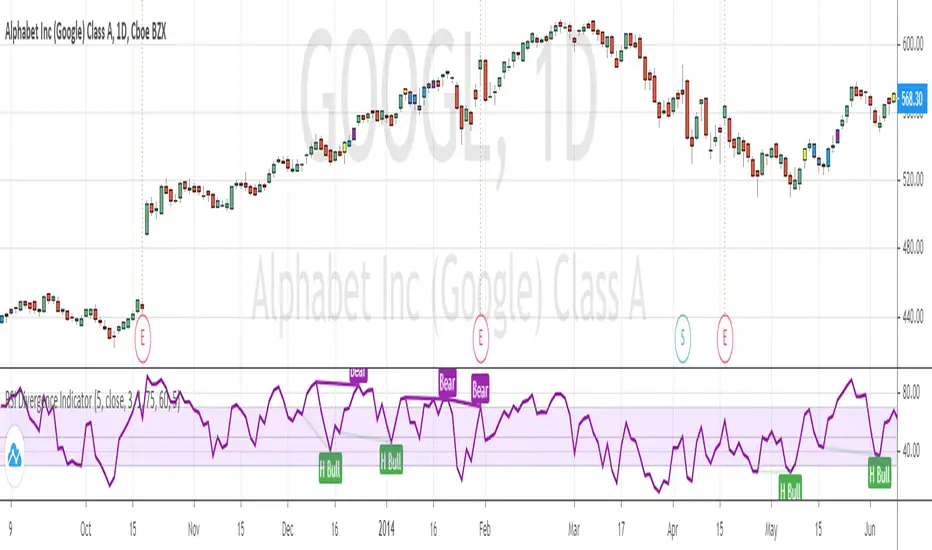
RSI Divergence Indicator (with alerts)Many have requested me for indicator version with alerts for the RSI Divergence strategy. Here is the one ...
Please note alert triggers in delay by number of bars defined in the settings. (same as strategy) ...
Bar color also changes when alert triggers ...
Yellow Bar shows BUY
Purple Bar shows EXIT ( Exit the Long position ... NO SHORTing )
On each Yellow Bar can be added to existing position
On each Purple Bar , exit partial position OR exit the whole position
Appreciate your feedback.
Warning
Use for education purpose only ...