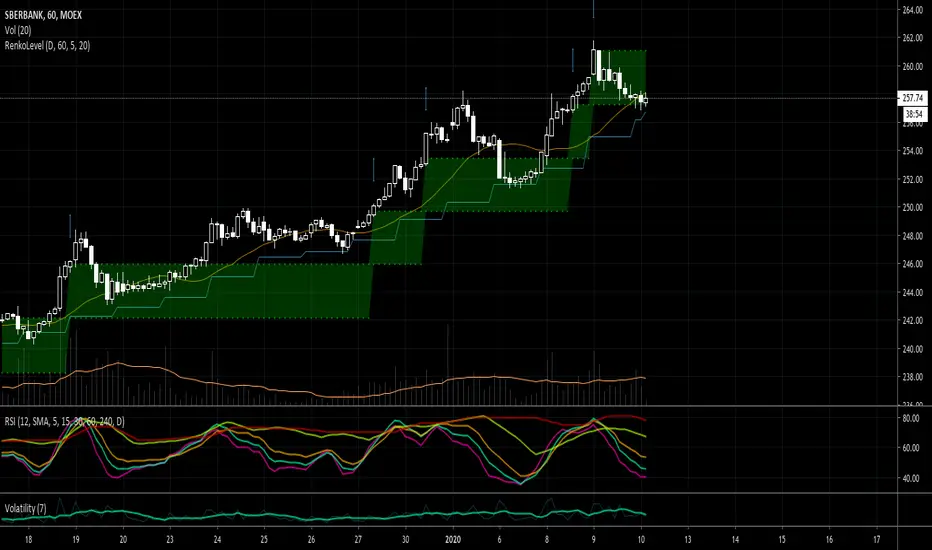
RSI STEP TRENDthis is script based on lazy bear special rsi and alex trend step
so it look like a nice hybrid together:)
signal and alerts inside
在腳本中搜尋"rsi"

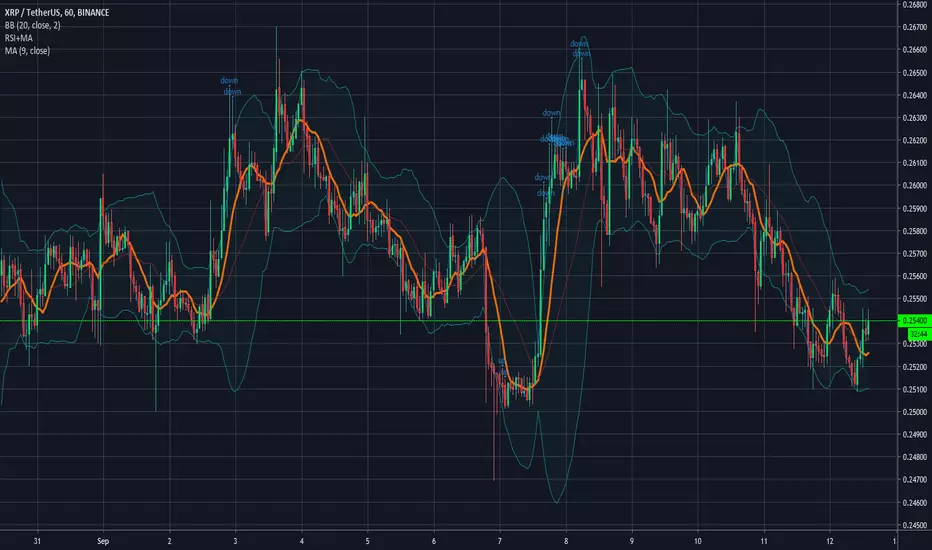

RSI ICHIMOKU CLOUDmain script written by ROBINHOODLAB
so the signal are done by cross up or down of the rsi and the CHIMOKU CLOUD
red circles are down
blue cross are up
alerts inside


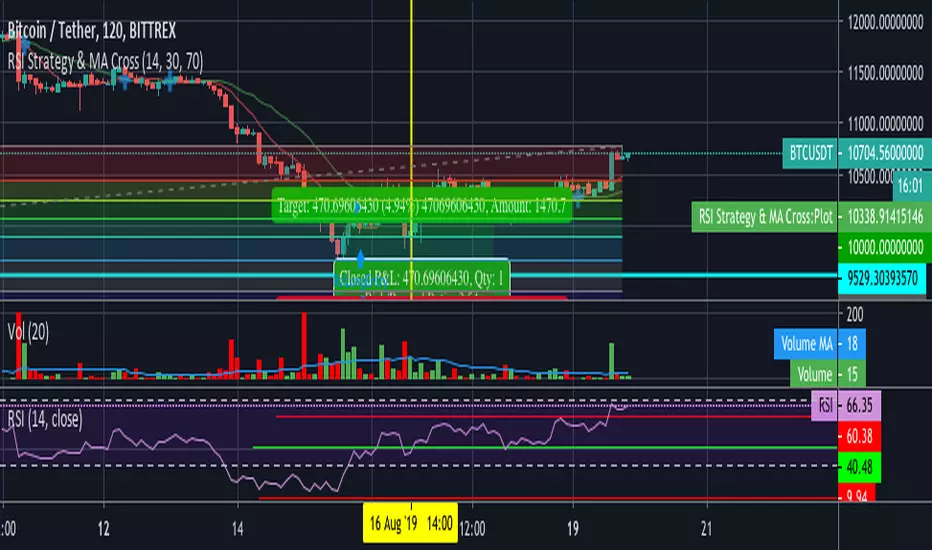
RSI Strategy & MA CrossCombination of two strategy.
MA Cross strategy is using 2 sma at 9 & 21. It can be configured through the source code.
RSI strategy to decide whether the stock/crypto is currently overbought/oversold.
Useful for quick entry and exit trade.
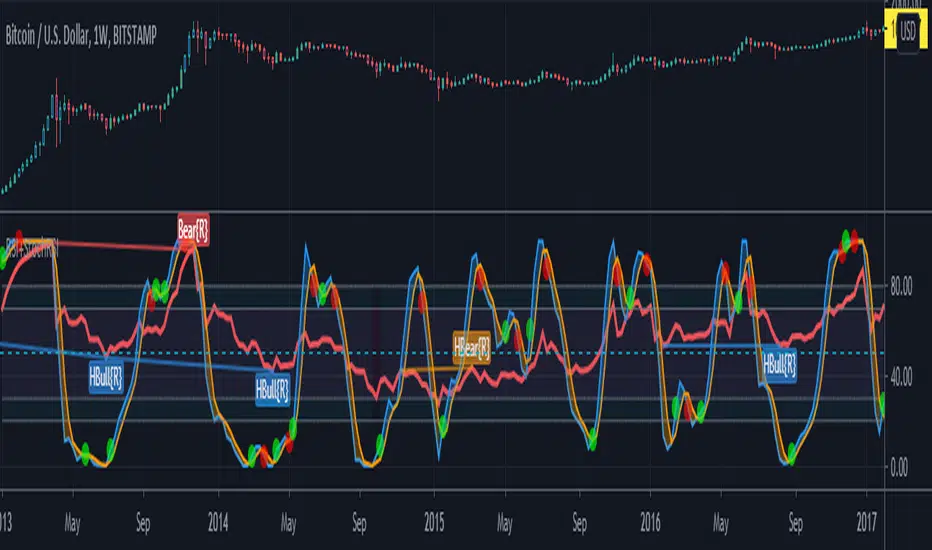
RSI Bottom [aamonkey]This is a modified RSI that prints a bottom signal directly on your price chart.
It pulls the data (in the default settings) from the weekly chart no matter on what timeframe you are on.
You can adjust the timeframe and threshold.
Default settings work best for big BTC cycles.

RSI on the chart [Experimental]This is an experimental work to show RSI on the chart. Feel free to use the code and indicator.
If you find my works useful, please consider a donation
BTC: 19qDW9AShZhBZsGuXcgRzam5Fbpc3EU8EV
ETH: 0x39c8552371b9b7f4e324197af460ba8bc8e18ef9


RSI with Overpriced and Underpriced highlightRelative Strength Index (RSI) with Overpriced and Underpriced highlights, respectively set at 70% and 30%

RSI & MACDJust combined the template RSI and MACD scripts from the pine library and it seems to work better in pine version 4 :) ty tradingview!


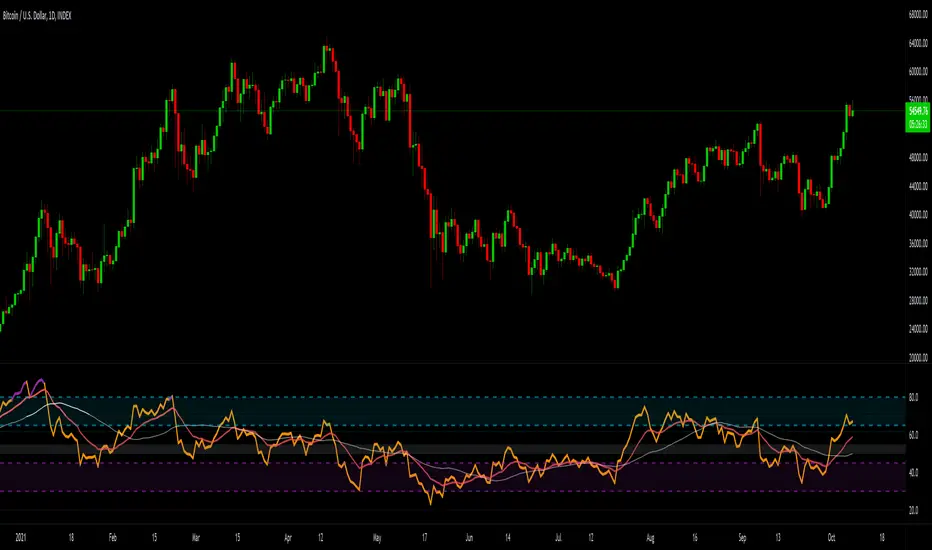
rsi sma/ema cuCustom RSI with SMA 9, EMA 45 and Bull/Bear Control Zones from Krown and Constance Brown.
