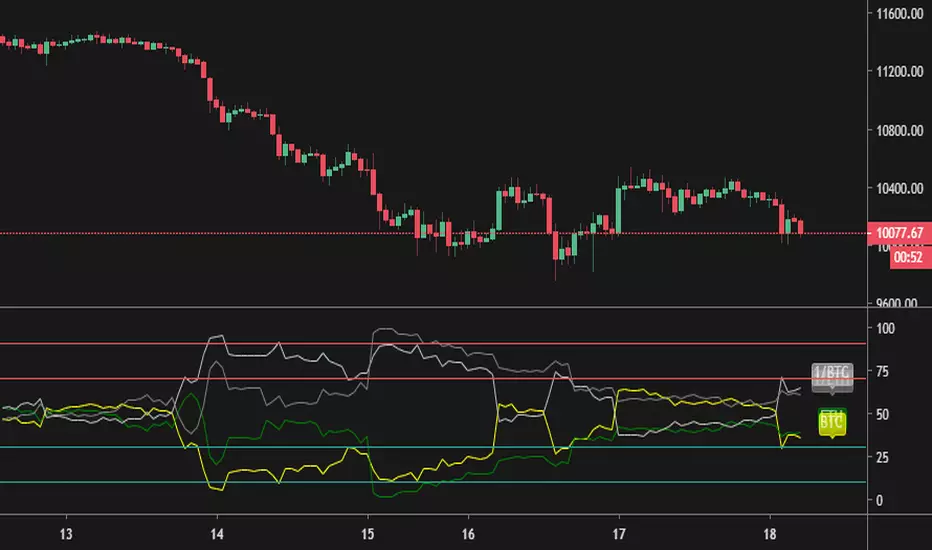
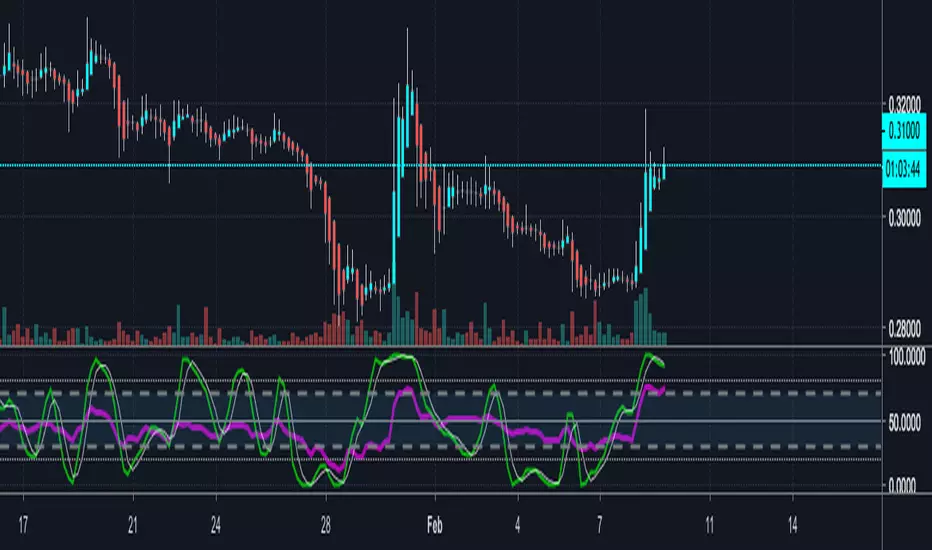
Various Volume RSI (BTC vs ETH) [mushoku]RSI to show btc and eth fight(BINANCE)
Binance(バイナンス) のBTCとETHを同時に表示する RSI です。
無料で使用できます。
こちらでも簡単ですが紹介しています。
note.mu
在腳本中搜尋"rsi"
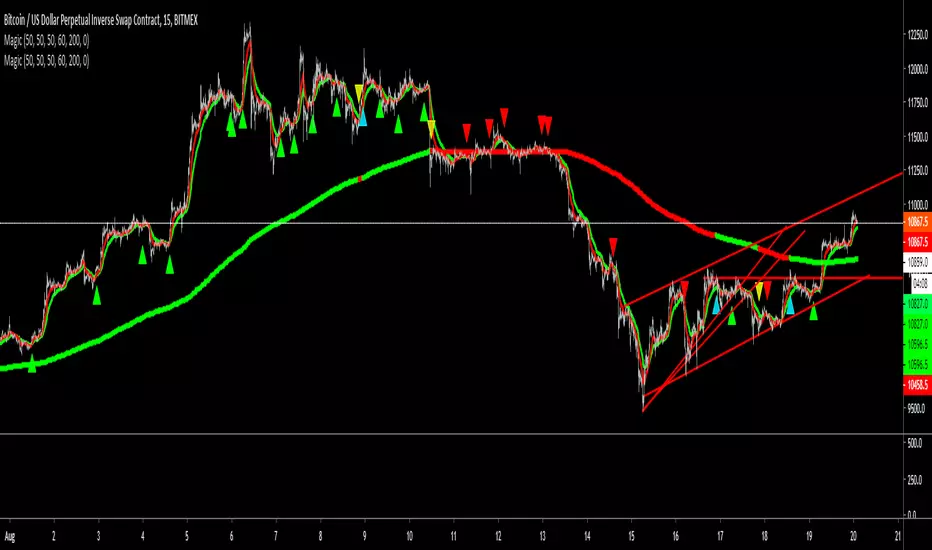
OMEN-Magic RSIRSI DERIVED equations that looks at similar but different aspects of rsi compared with time.
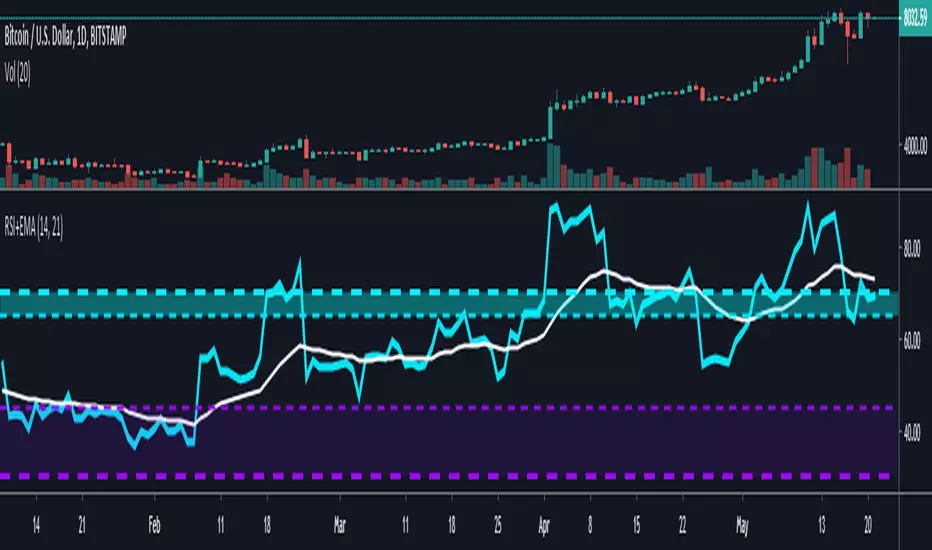
Scott's RSI with ema and stochsRSI with ema of RSI with regular stochastic overlaid into the same panel with control zones.

Various Volume RSI (UNLIMITED)RSI displaying multiple currencies together (arbitrary input version)
forex or cryptcurrencies...economic index or metal or energy...and more...
複数の通貨をまとめて表示するRSIです。(任意入力版)
外国為替や暗号通貨...経済指数・金属・エネルギー...その他を表示できます。
同時に多通貨を監視することで見えてくるものがあります。
詳細、購入などはこちらにて
note.mu

RSI Divergence with candle coloringHey there
This is a script requested by a friend
It's based on the RSI Divergence script from Ricardos Santos :
This version will color the candles instead of drawing an extra panel below the main chart
I set this script on Invite-only cause it's only for a friend to be used.
However, if interested, hit me up and I'll add you
Enjoy
Dave

RSI Stop LossExperiment for using RSI as a stop loss value, shows where the price will be when the RSI increases or decreases by a specified amount.

RSI Go longGiving all credit to @Celena at WarriorTrading for the idea behind this script.
The script is pretty basic and self-explanatory. We will use certain RSI levels both on 5min and 1min to determine the strength/momentum of a stock.
The idea is to monitor 5m and 1m timeframes at once. if the RSI starts to test the initial level, we will see a plot on the graph ( default color is orange ). If we reach our target level and above, bar colors will change to default color green. If this happens in both 1min and 5 min timeframe it is an indicator of the strength of the stock. This indicator coupled with our own strategy helps us reinforce the idea for long entries.

RSI with Smoothing and over-areas colored ARROWS BUY SELLThis is a complementary script for my previous RSI indicator
You have a BUY and SELL signals here and 3 methods of their interpretations:
- indicator is leaving the over-bought/sold areas
- indicator is entering the over-bought/sold areas
- indicator changes its direction from falling to rising and vice versa

RSI MomentumThis script represents Momentum's move in the RSI , So we expect to start moving faster than RSI and in this oscillator
When the line of histogram is under the neutral zone and it's color changes from red to maroon, The BUY Signal has been issued /
When the line of histogram is above the neutral zone and it's color changes from lime to green, The SELL Signal has been issued /
This script was written by Hamid Abdi (Teaching by Dr .A.Khodakarami)

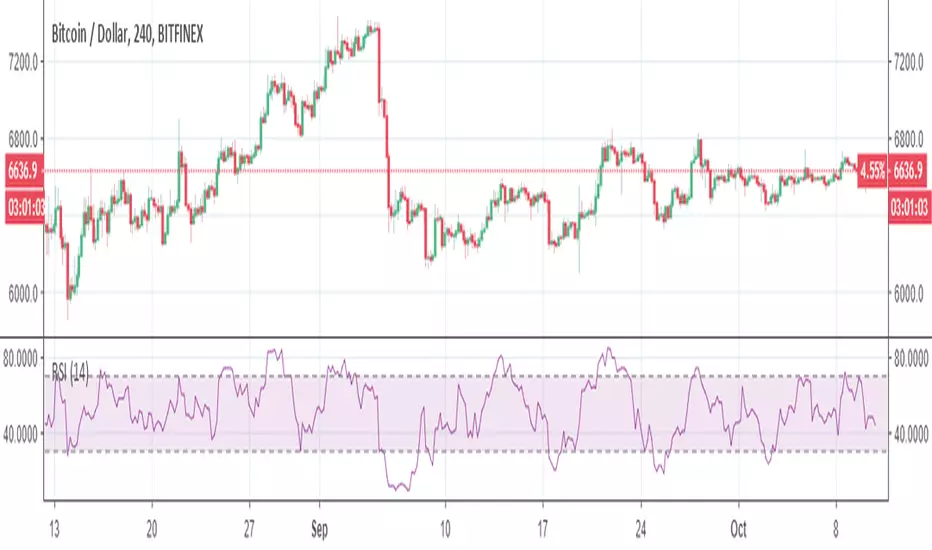
RSI + EMA with Multiple ZonesThis is your traditional RSI chart but with a few modifications
I added an extra zone parameter that you can specify with its own color and line customization.
There is an EMA that tracks the RSI as well.
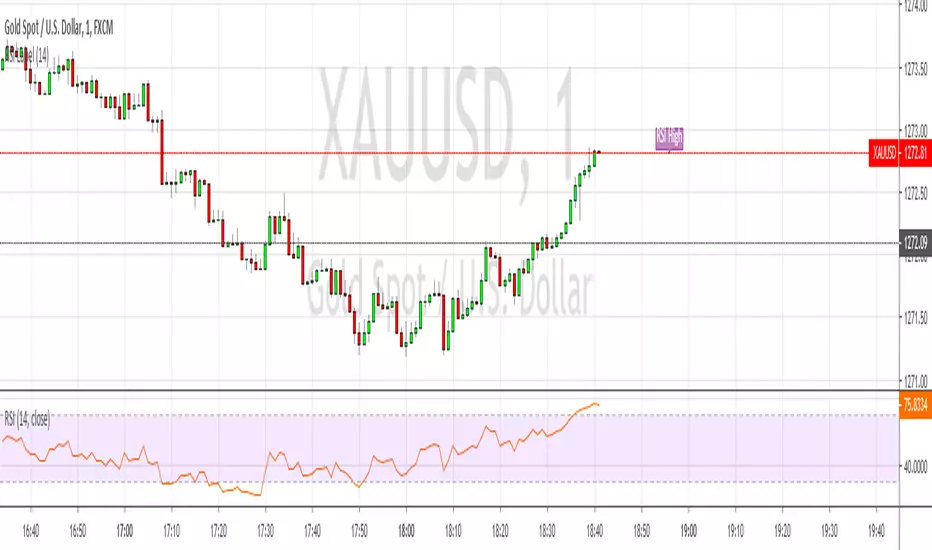
RSI LabelAdds a purple label to the right of price if RSI is overbought or oversold, otherwise it doesn't show anything at all, nada. Handy for people (like me) who often focus on price action and forget to watch the RSI
Rsi Resistance & SupportThis Indicator used Rsi & BB
If the RSI is out of BB, it displays support or resistance lines.

[Delphi][CryptoNews Plus] RSI + DMI ADXRSI + DMI ADX
Inner Version 1.0 07/02/2019
Developer: iDelphi
07/02/2019 Added RSI
07/02/2019 Added ADX

RSI with SMA ( Normal Formula of RSI)Tradingview has a different type of RSI. I prepare a normal formula for RSI to calculate better backtest performance.