RSI SMA ColorRSI 14 with SMA 21 Color. A momentum oscillator that measures the speed and change of price movements. It ranges from 0 to 100 and is typically used to identify overbought or oversold conditions in a market. An RSI above 70 may indicate that an asset is overbought, while an RSI below 30 may suggest it is oversold.
在腳本中搜尋"rsi"

Averaged Stochastic RSI by TenozenSimplicity beats everything! Averaged Stochastic RSi is calculated using the 2 points of stochastic of the RSI, where the difference is by 2 (larger), and averaged out the stochastic's values. In result it is less noisy and more responsive towards the market's momentum.
I hope you guys find this indicator useful! So far this is the best indicator I ever had! And I also learned that simplicity is better than complex blurry/abstract problems. Ciao!

VWAP + 2 Moving Averages + RSI + Buy and SellIndicator: VWAP + 2 Moving Averages + RSI + Buy and Sell
Buy and Sell Arrows (Great for use alone or in conjunction with other scripts on the chart)
This indicator displays BUY (BUY) and SELL (SELL) arrows on the chart based on a combination of moving averages, VWAP and RSI. Arrows are a visual way to identify trading opportunities and can be useful for traders who want to follow a strategy based on these conditions.
The indicator uses two moving averages (20 and 50 periods) to identify upward crosses (buy) and downward crosses (sell). In addition, it takes into account VWAP (Volume Weighted Average Price) and RSI (Relative Strength Index) as additional filters to confirm buy and sell signals.
This script is great for use both independently and in conjunction with other indicators and strategies. You can combine it with other indicators and customize it to your preferences to create a more comprehensive trading strategy.
Please remember that this indicator is provided for educational purposes only and does not constitute financial advice. It is always recommended to carry out a thorough analysis before making any trading decisions.
Give this indicator a try and enjoy clear visualization of buy and sell arrows on your chart. Happy trading!

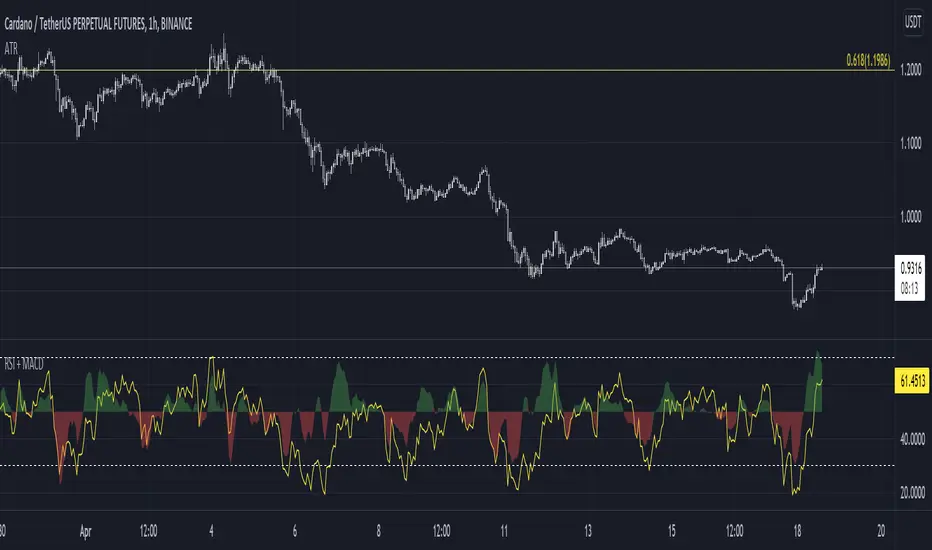
RSI + MACDRSI and MACD in one simplified indicator. Why? Because :
1. Save chart space, declutter, make decision making better, faster
2. MACD is not scaled to RSI range, now it is so you can have side by side comparison
Example how to use:
Enter on RSI oversold or overbought level, then exit on MACD crossover
See if there is an extra confluence to enter, hold or exit your trades, i.e oversold and falling macd is better than oversold and rising macd for short trades potentially.
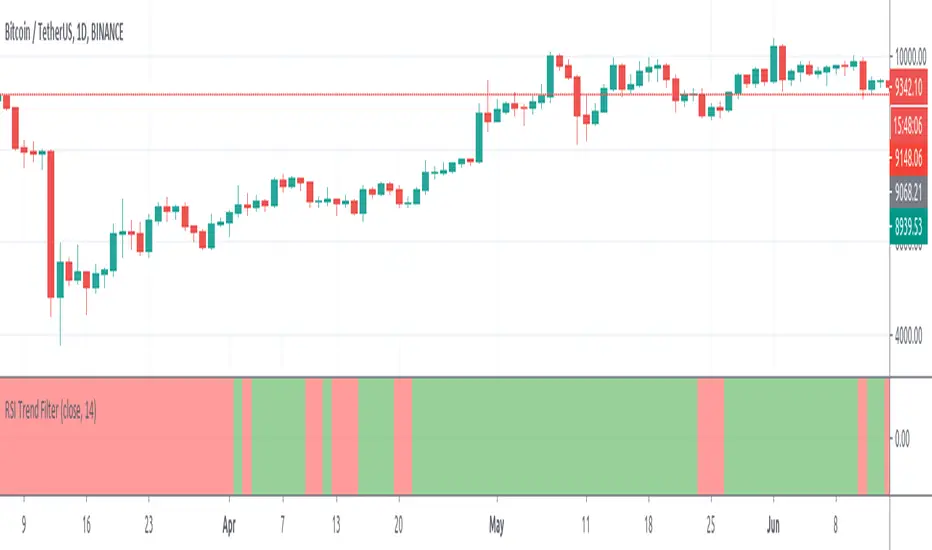
RSI Trend FilterRSI based basic trend filter. I don't used it in the NNFX structure but I wanted to test things.
Here RSI is not used as reversal indicator.
We check if RSI>50 or <50 and we use it as a trend confirmation indicator/filter.
RSI Fibonacci Levels StrategyRSI with Fibonacci Levels
Visually can be used as:
- Countertrend indicator at extreme green/red lines
- Follow trend indicator
- Fibonacci supports and resistantes zones
The strategy works as a follow trend
How to trade:
The indicator is more reliable in longer time frames, at least 4H
Choose a fibonacci level as reference
Buy when the RSI line turns green
Sell when the RSI line turns red

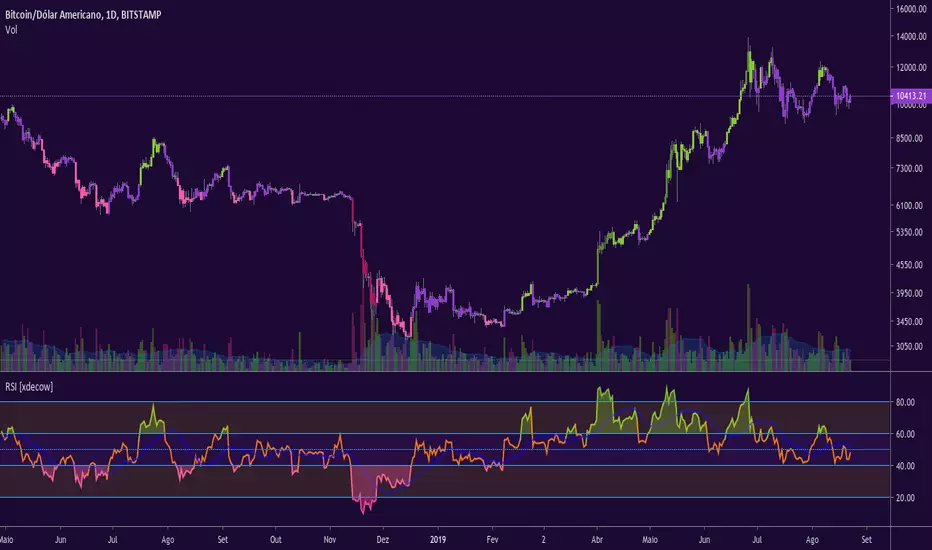
RSI [xdecow]RSI MTF
Options:
-MA
-RSI from another timeframe
-Uptrend/Downtrend zone
-barcolor based on RSI trend

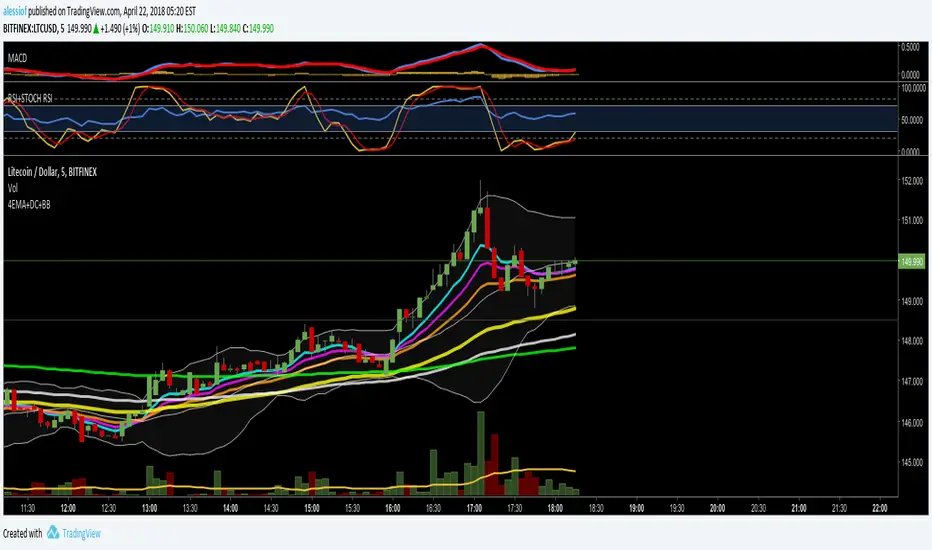
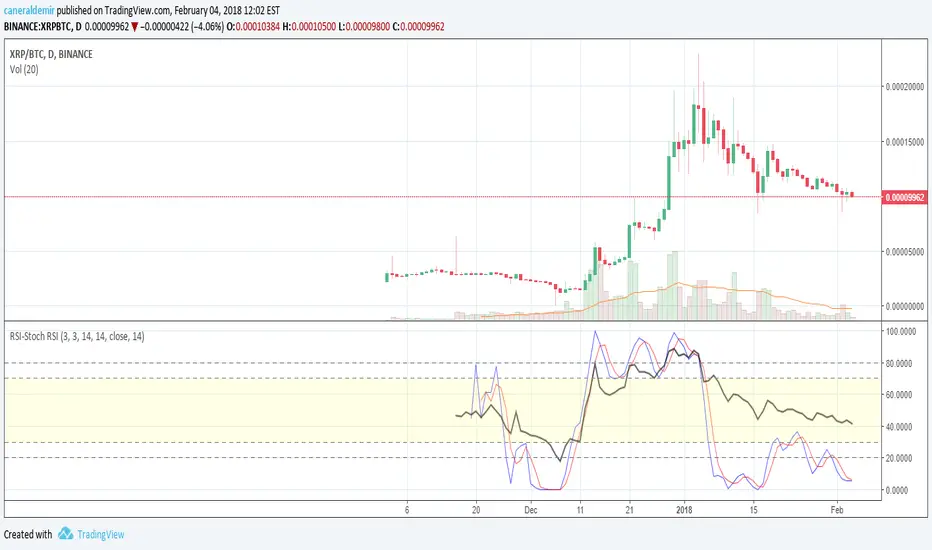
RSI + STOCH RSI OVERLAY by AlessiofRSI and Stochastic RSI in one. Standard settings.
Check out my other script for 4EMA + Death Cross + Bollinger Bands all in one.
RSI + StochasticRSI overbought and oversold histogram
Just indicator combo of oldschool slow stochastic and rsi, just looking a little bit better for someone.
Strategy is simple:
1) RSI is overbought or oversold (above 70, below 30)?
2) Stochastic line crosses its ema?
3) Stochastic and stochastic ema are in overbought = sell, oversold = buy.
Works good in volitile stocks/pairs and suits for fast scalping timeframes 1m 5m 15m
Strategy is old as the books, this is just a better visual for it.

RSI Combo (RSI, StochRSI)RSI and StochRSI combination with color fill histogram if RSI is over 70 or below 30.


RSI with 3 Separate Smoothing AveragesRSI has 3 moving averages, to help trade better
RSI period can be adjusted
Moving average has multiple selections (SMA, EMA, HMA)
moving average cross over can be used as signal for trades
Trade at your own risk

RSI Golden & Dead Cross AlertRSI 14 Golden And Dead Cross Indicator
It will give you an alert when there are rsi golden and dead cross.
It is a intergated signal: Crossing up and Crossing down of RSI.

RSI Signal Backtest Bounce AlertRSI crosses below 5min signal line, bounce above 50 RSI and crosses bullish back above signal line. Once it backtests signal the indicator will fire.

RSI - Ostinato TradingRSI indicator for Ostinato Trading scalping strategy. The classic RSI with special color fills for extremum detection.
RSI + MFIRSI and MFI combined, width gradient fields if OS or OB, shows divergences separate for wicks and bodies, shows dots when mfi and rsi oversold at the same time.

RSI Cross Alerts with Vertical Lines (9:30 AM - 2:45 PM)RSI Cross Alerts - Indicates Vertical Lines on previous times the RSI Indicator Crosses Overbought or Oversold parameters set by user.

RSI DJ GUTO 2025RSI do Samuca, tem de trocar as cores, esse e o usado nas lives, tem de trocar as cores pra ficar igual ao do Samuca pois aqui nao consegui trocar as cores.
Samuca's RSI, you have to change the colors, this is the one used in the lives, you have to change the colors to be the same as Samuca's because I couldn't change the colors here.

RSI Cloud Zones (by AButterfly)RSI instruction: Uptrend market only. LONG only. Should use only when SPY and QQQ are above 50 SMA and 200 SMA, and the 50sma is above 200sma, and RSI(14) is above 50 ............... BUY only in the GREEN area. Do NOT buy above GREEN green area. That would be chase (after a train, a ship that left). Take profit in the RED area, preferably on a green candle. This does not encourage SHORT-ing. LONG only. Disclaimer: This is an entertainment. If you lose money, don't blame this indicator or the creator. You have to pay attention to whether the market is on uptrend.

RSI TreeRSI Tree is a simple way to compare the strength of several different instruments against each other.
The default is to compare MSFT, NVDA, TSLA, GOOG, META, AMZN, AAPL and NASDAQ. You could do the same for currency pairs and any other instruments available in Trading View. However, it makes the most sense to compare seven instruments to an eighth underlying instrument. As you can see in the default values, we included the NASDAQ as the eighth instrument since the other seven are part of the NASDAQ composite index. If you were to trade major currency pairs, then your eighth instrument would most likely be the U.S. Dollar (DXY).
The chart setup is important as well. You need to split your chart horizontally into 4 plots. Each plot would be at a different timing interval. The example shows 4 hr, 1 hr, 15 min and 5 min (left to right) charts. Now not only can we compare the instruments against each other, but we can do it across time to get an idea of the motion of each instrument.
Note, the instrument used on the chart is somewhat important. If the chart is set to a currency pair, but you have the RSI Tree setup for equities (as in the default) then you will get some odd behavior due to the times when these are open. Equities are 0930 to 1600 EST, whereas something like a currency would be open 24 hours a day.
Layout for default settings: www.tradingview.com
Bugs?
Kindly report any issues and I'll try to fix them promptly.
Thank you!

RSI with Close & Tail DivergencesRSI divergence is a cornerstone signal for both stock and cryptocurrency traders, renowned for its reliability.
The basis for measuring divergence can vary:
Historically, it's been determined by the candlestick's closing price.
However, a contemporary approach uses the tail values, specifically the high and low prices, of the candlestick.
Depending on the criteria selected, the resultant signals can be markedly different.
Our innovative indicator offers:
Divergence tracking based on the closing price of the candlestick.
Divergence tracking considering the candlestick's peak and trough values.
A unique convergence of both types of divergence signals.
With this tool, traders are empowered to make informed decisions, anchored in precise divergence cues.
This indicator boasts the following capabilities:
Displays divergence based on closing price, highs/lows, as well as a unique combined criterion.
Highlights pivot points.
Denotes divergence spots on the RSI chart with lines.
Offers a background color representation instead of labels.
