The Flash-Strategy (Momentum-RSI, EMA-crossover, ATR)The Flash-Strategy (Momentum-RSI, EMA-crossover, ATR)
Are you tired of manually analyzing charts and trying to find profitable trading opportunities? Look no further! Our algorithmic trading strategy, "Flash," is here to simplify your trading process and maximize your profits.
Flash is an advanced trading algorithm that combines three powerful indicators to generate highly selective and accurate trading signals. The Momentum-RSI, Super-Trend Analysis and EMA-Strategy indicators are used to identify the strength and direction of the underlying trend.
The Momentum-RSI signals the strength of the trend and only generates trading signals in confirmed upward or downward trends. The Super-Trend Analysis confirms the trend direction and generates signals when the price breaks through the super-trend line. The EMA-Strategy is used as a qualifier for the generation of trading signals, where buy signals are generated when the EMA crosses relevant trend lines.
Flash is highly selective, as it only generates trading signals when all three indicators align. This ensures that only the highest probability trades are taken, resulting in maximum profits.
Our trading strategy also comes with two profit management options. Option 1 uses the so-called supertrend-indicator which uses the dynamic ATR as a key input, while option 2 applies pre-defined, fixed SL and TP levels.
The settings for each indicator can be customized, allowing you to adjust the length, limit value, factor, and source value to suit your preferences. You can also set the time period in which you want to run the backtest and how many dollar trades you want to open in each position for fully automated trading.
Choose your preferred trade direction and stop-loss/take-profit settings, and let Flash do the rest. Say goodbye to manual chart analysis and hello to consistent profits with Flash. Try it now!
General Comments
This Flash Strategy has been developed in cooperation between Baby_whale_to_moon and JS-TechTrading. Cudos to Baby_whale_to_moon for doing a great job in transforming sophisticated trading ideas into pine scripts.
Detailed Description
The “Flash” script considers the following indicators for the generation of trading signals:
1. Momentum-RSI
2. ‘Super-Trend’-Analysis
3. EMA-Strategy
1. Momentum-RSI
• This indicator signals the strength of the underlying upward- or downward-trend.
• The signal range of this indicator is from 0 to 100. Values > 60 indicate a confirmed upward- or downward-trend.
• The strategy will only generate trading signals in case the stock (or any other financial security) is in a confirmed upward- (long entry signals) or downward-trend (short entry signals).
• This indicator provides information with regards to the strength of the underlying trend and it does not give any insight with regard to the direction of the trend. Therefore, this strategy also considers other indicators which provide technical confirmation with regards to the direction of the underlying trend.
Graph 1 shows this concept:
• The Momentum-RSI indicator gives lower readings during consolidation phases and no trading signals are generated during these periods.
Example (graph 2):
2. Super-Trend Analysis
• The red line in the graph below represents the so-called super-trend-line. Trading signals are only generated in case the price action breaks through this super-trend-line indicating a new confirmed upward-trend (or downward-trend, respectively).
• If that happens, the super trend-line changes its color from red to green, giving confirmation that the trend changed from bearish to bullish and long-entries can be considered.
• The vice-versa approach can be considered for short entries.
Graph 3 explains this concept:
3. Exponential Moving Average / EMA-Strategy
The functionality of this EMA-element of the strategy has been programmed as follows:
• The exponential moving average and two other trend lines are being used as qualifiers for the generation of trading-signals.
• Buy-signals for long-entries are only considered in case the EMA (yellow line in the graph below) crosses the red line.
• Sell-signals for short-entries are only considered in case the EMA (yellow line in the graph below) crosses the green line.
An example is shown in graph 4 below:
We use this indicator to determine the new trend direction that may occur by using the data of the price's past movement.
4. Bringing it all together
This section describes in detail, how this strategy combines the Momentum-RSI, the super-trend analysis and the EMA-strategy.
The strategy only generates trading-signals in case all of the following conditions and qualifiers are being met:
1. Momentum-RSI is higher than the set value of this strategy. The standard and recommended value is 60 (graph 5):
2. The super-trend analysis needs to indicate a confirmed upward-trend (for long-entry signals) or a confirmed downward-trend (for short-entry signals), respectively.
3. The EMA-strategy needs to indicate that the stock or financial security is in a confirmed upward-trend (long-entries) or downward-trend (short-entries), respectively.
The strategy will only generate trading signals if all three qualifiers are being met. This makes this strategy highly selective and is the key secret for its success.
Example for Long-Entry (graph 6):
When these conditions are met, our Long position is opened.
Example for Short-Entry (graph 7):
Trade Management Options (graph 8)
Option 1
In this dynamic version, the so-called supertrend-indicator is being used for the trade exit management. This supertrend-indicator is a sophisticated and optimized methodology which uses the dynamic ATR as one of its key input parameters.
The following settings of the supertrend-indicator can be changed and optimized (graph 9):
The dynamic SL/TP-lines of the supertrend-indicator are shown in the charts. The ATR-length and the supertrend-factor result in a multiplier value which can be used to fine-tune and optimize this strategy based on the financial security, timeframe and overall market environment.
Option 2 (graph 10):
Option 2 applies pre-defined, fixed SL and TP levels which will appear as straight horizontal lines in the chart.
Settings options (graph 11):
The following settings can be changed for the three elements of this strategy:
1. (Length Mom-Rsi): Length of our Mom-RSI indicator.
2. Mom-RSI Limit Val: the higher this number, the more momentum of the underlying trend is required before the strategy will start creating trading signals.
3. The length and factor values of the super trend indicator can be adjusted:ATR Length SuperTrend and Factor Super Trend
4. You can set the source value used by the ema trend indicator to determine the ema line: Source Ema Ind
5. You can set the EMA length and the percentage value to follow the price: Length Ema Ind and Percent Ema Ind
6. The backtesting period can be adjusted: Start and End time of BackTest
7. Dollar cost per position: this is relevant for 100% fully automated trading.
8. Trade direction can be adjusted: LONG, SHORT or BOTH
9. As we explained above, we can determine our stop-loss and take-profit levels dynamically or statically. (Version 1 or Version 2 )
Display options on the charts graph 12):
1. Show horizontal lines for the Stop-Loss and Take-profit levels on the charts.
2. Display relevant Trend Lines, including color setting options for the supertrend functionality. In the example below, green lines indicate a confirmed uptrend, red lines indicate a confirmed downtrend.
Other comments
• This indicator has been optimized to be applied for 1 hour-charts. However, the underlying principles of this strategy are supply and demand in the financial markets and the strategy can be applied to all timeframes. Daytraders can use the 1min- or 5min charts, swing-traders can use the daily charts.
• This strategy has been designed to identify the most promising, highest probability entries and trades for each stock or other financial security.
• The combination of the qualifiers results in a highly selective strategy which only considers the most promising swing-trading entries. As a result, you will normally only find a low number of trades for each stock or other financial security per year in case you apply this strategy for the daily charts. Shorter timeframes will result in a higher number of trades / year.
• Consequently, traders need to apply this strategy for a full watchlist rather than just one financial security.
在腳本中搜尋"rsi"

Chanu Delta RSI StrategyThis strategy is built on the Chanu Delta RSI , which indicates the strength of the Bitcoin market. The problem with the previous Chanu Delta Strategy was that it was simply based on the price difference between the two Bitcoin markets, so there was no universality. However, this new Chanu Delta RSI strategy solves the problem by introducing an RSI that compares the price difference trend.
When the Chanu Delta RSI hits “Bull Level” and “Bear Level” and closes the candle, long and short signals are triggered respectively. The example shown on the screen is a default setting optimized for a 4-hour candlestick strategy based on the Bybit BTCUSDT futures market. You can use it by adjusting the setting value and modifying it to suit you.
This strategy is selectable from both reference and large amplitude BTCUSD markets in order to enable fine backtesting. I recommend using BYBIT:BTCUSDT for the reference market and COINBASE:BTCUSD for the large amplitude market.
(Note) Using the "Chanu Delta RSI" to know the current indicator value in real time, it is convenient to predict the signal of the strategy.
(Note) Because the Chanu Delta RSI represents the price difference based on the Bybit BTCUSDT futures market, backtesting is possible from March 2020.
_____________________________________________________________
이 전략은 비트코인 시장의 강점을 나타내는 Chanu Delta RSI를 기반으로 합니다. 기존 Chanu Delta 전략의 문제점은 단순히 두 비트코인 시장의 가격차를 기준으로 하여 보편성이 없었다는 점이다. 하지만 이번 새로운 Chanu Delta RSI 전략은 가격차이 추세를 비교하는 RSI를 도입해 문제를 해결했습니다.
Chanu Delta RSI가 "Bull Level"과 "Bear Level"에 도달하고 봉마감하면 롱, 숏 신호가 각각 트리거됩니다. 화면에 보이는 예시는 Bybit BTCUSDT 선물 시장을 기반으로 한 4시간 캔들스틱 전략에 최적화된 기본 설정입니다. 설정값을 조정하여 자신에게 맞게 수정하여 사용하시면 됩니다.
이 전략은 정밀한 백테스팅을 가능하게 하기 위해 참조 및 큰 진폭 BTCUSD 시장에서 모두 선택할 수 있습니다. 참조 시장에는 BYBIT:BTCUSDT를 사용하고 큰 진폭 시장에는 COINBASE:BTCUSD를 사용하는 것이 좋습니다.
(주) "Chanu Delta RSI"를 이용하여 현재 지표 값을 실시간으로 알 수 있어 전략의 시그널을 예측하는데 편리합니다.
(주) Chanu Delta RSI는 바이비트 BTCUSDT 선물시장을 기준으로 가격차이를 나타내므로 2020년 3월부터 백테스팅이 가능합니다.

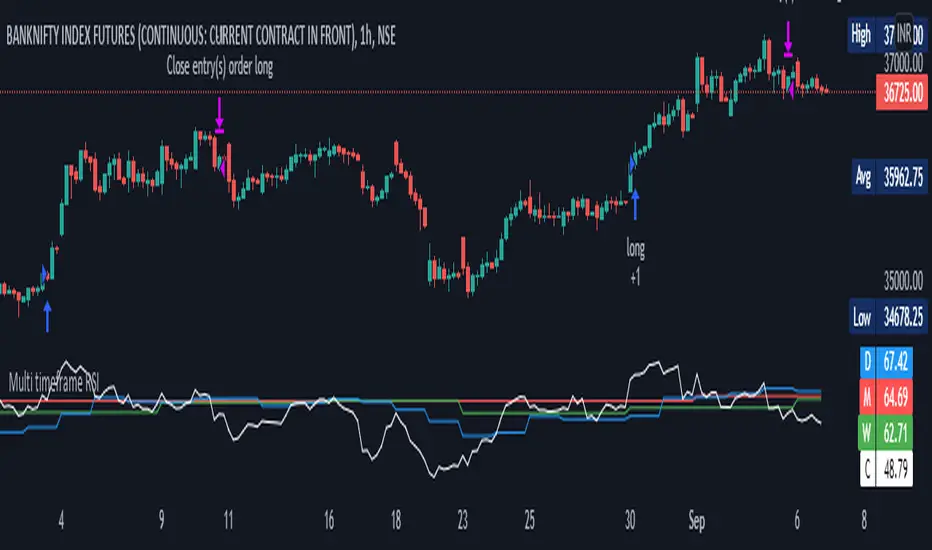
Multi timeframe RSI StrategyMulti Time Frame RSI is based on Concept of capturing Higher Time frame Momentum. Generally Higher TF Trends are more reliable and long
This strategy get the Monthly Weekly Daily and Current Time frame RSI and then trade on lower time frame taking as base of Higher TF
For Monthly, Weekly and Daily TF => RSI is set to = 40
for Lower TF => Upper RSI is = 65 Lower RSI is = 45
Trading Logic
Long = Current RSI > ( upper RSI and Monthly, Weekly and Daily TF RSI )
Short = Current RSI < ( Lower RSI and Monthly, Weekly and Daily TF RSI )
Brokerages Set to = 0.03%
Risk Mgmt=> Per trade risk = 5000 Rs
Alert=> alert are coded once you schedule TV alert, following singnal will get generated at current TF Candle close
Long = LE,
Close Long = LX
Short = SE,
Close Short= SX
For Bank Nifty = 1 hrs TF is preffered and Nifty = 15 Min TF
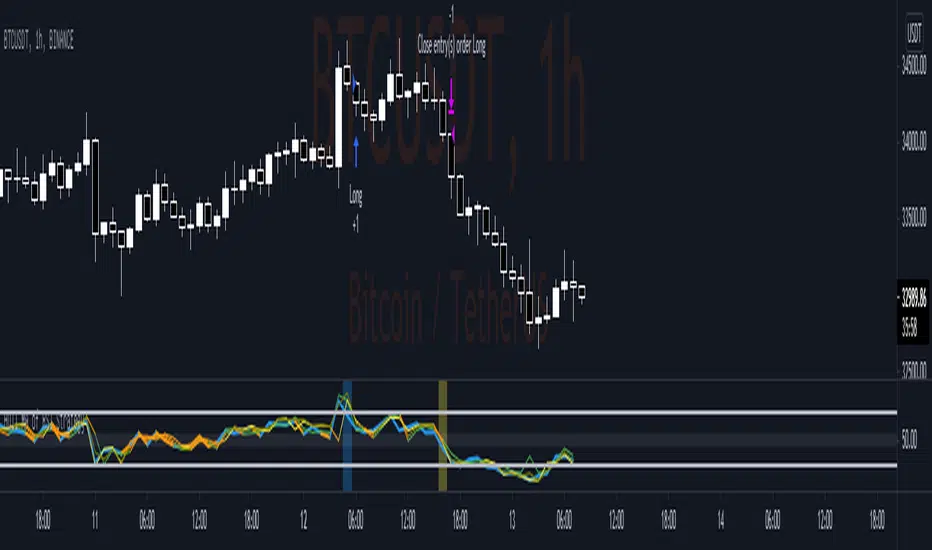
Hull MA of RSI StrategyThis simple strategy base on RSI value of Close Price, High Price, Low Price, Median Price and RSI value smoothed by Hull Moving Average.
1. Optimize parameter on BTC H1 Binance chart
RSI period: 13
Hull MA period: 3
Middle Channel: 55-45
Overbough / Oversold: 70-30
2. Setup
2.1 Long Condition
- RSI of Close Price crossunder Overbought
- Close Price lower than Median Price (HL2)
- RSI of Median Price above Overbought
2.2 Close Long Position
- RSI of Close Price crossover Overbought (Take profit)
or
- RSI of Low Price crossunder upper value of Middle Channel (Stop loss)
2.2 Short Condition
- RSI of Close Price crossover Oversold
- Close Price higher than Median Price (HL2)
- RSI of Median Price below Oversold
2.2 Close Long Position
- RSI of Close Price crossunder Oversold (Take profit)
or
- RSI of High Price crossover lower value of Middle Channel (Stop loss)
3. Idea
- Follow strong momentum of Price to catch Flash Buy/Sell Bar in Crypto Market
- RSI of High Price and Low Price help to regconize setup failure quickly.
- This case study desire to find a balance of Winrate, Profit factor, Sharpe Ratio
Relative Volume & RSI PopThis is a basic idea/script designed to take a breakout trade by taking advantage of volume spikes when price/strength is extended (either long or short).
The script only utilises two indicators, the Relative Volume (RV) and the Relative Strength Index (RSI). The script allows the user to select a RSI value between 69 up to 100 for a long trade and between 35 down to 0 for short trade and then pair this with RV from 0 - 10. The period for both the RSI and RV can also be amended by the user but I found in most cases there was no benefit gained by changing away from normal "14" period lookback. The script typically only has small draw downs as the script is designed to exit the trade when the RSI returns back to "normalised" level, therefore the trades are generally quite short. The exit condition for a long trade is when RSI crosses back below 69 (which is why you cannot enter a long below this value) and for a short the, trade will close when RSI crosses back above 35 (which is why you cannot enter a short above this value). These exit values are locked.
By allowing RSI value to go all the way up to "100" on the long side and "0" on the short side this in effect is a way of eliminating the script from taking either longs or shorts if lets say you wanted to back test the script for long only spikes or short only spike. E.G. By setting RSI upper value to "75" the RV to "1" and RSI lower value to "0" then no short trades will not be taken in your back test as the RSI never really gets down to zero.
I put this together with meme stocks in mind and back tested it on day charts for AMC and then a few trending style stocks too. It typically worked best as long only and with RSI settings between 71 - 75 and RV at 1 or 1.5. I also found it had okay results on some lower 1hr timeframe futures markets and weekly time frames too (albeit trades were few and far between on weekly timeframe).
The beauty of such a basic script you could easily set up a trading view screener to look for these opportunities everyday and perhaps even add in an ADX filter on the screener to see if the trend is increasing. Then use this script to run a back test on the stocks that you've selected from the screener.

Noro's Triple RSI Top/Bottom v1.1In 1.1 added:
+ Leverage-parameter
+ Indicators-parameter
Strategy
It is the indicator. Threefold RSI . 3 different RSI indicators are used:
1) The RSI indicator with the period 2
2) The RSI indicator with the period 7
3) The RSI indicator with the period 14
If at the same time RSI-2 < 10 and RSI-7 < 20 and RSI-14 < 30 = a bottom
If at the same time RSI-2 > 90 and RSI-7 > 80 and RSI-14 > 70 = a top
Parameter accuracy influences.
Strategy allows to measure indicator accuracy. To check whether this indicator is suitable for this pair and a timeframe, how exact.

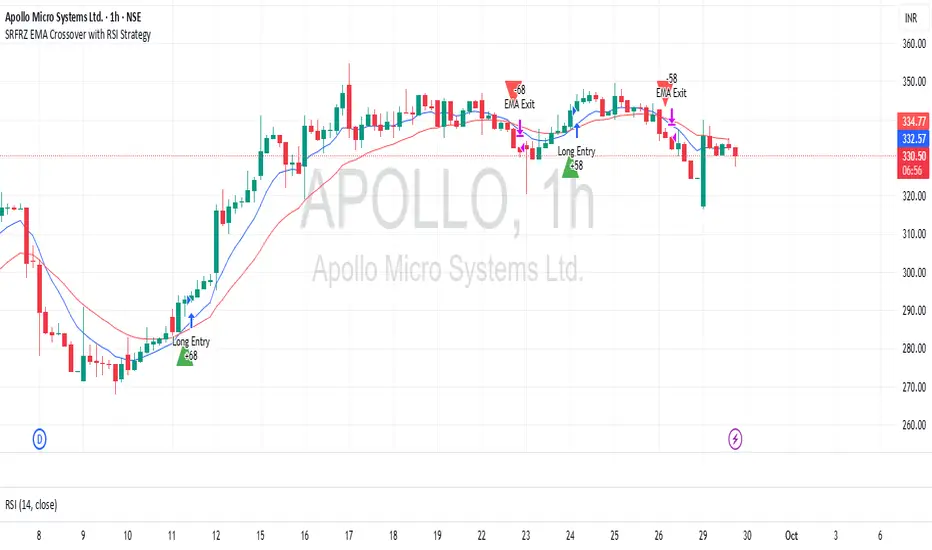
SRFRZ EMA Crossover with RSI StrategySRFRZ EMA Crossover with RSI Strategy
1. Overview
Strategy Name: SRFRZ EMA Crossover with RSI Strategy
Summary: A trend-following strategy designed for Indian stock and index markets, operating on any timeframe (optimized for 1H or 4H charts). It combines a 9-period and 21-period EMA crossover with RSI confirmation to identify high-probability long entries during the Indian trading session (9:15 AM–3:25 PM IST). Backtested with a fixed 20% capital allocation per trade, 3% stop loss, and 50% take profit, it aims for consistent returns in trending markets.
Intended Audience: Intermediate traders familiar with EMA and RSI, seeking automated signals for Indian markets.
2. How It Works (Core Logic)
Entry Conditions (Long/Buy Signal):
Primary Trigger: A "Golden Cross" occurs when the 9-period EMA crosses above the 21-period EMA, signaling bullish momentum.
RSI Confirmation: RSI (14-period) must be above 55, or cross above 55, to confirm strong momentum.
Trend Filter: The 9-period EMA must remain above the 21-period EMA for delayed RSI-triggered entries.
Session Filter: Trades are only executed during the Indian market session (9:15 AM–3:25 PM IST, Monday–Friday).
Exit Conditions:
Take Profit (TP): Fixed at 50% above the entry price (e.g., entry at ₹100, TP at ₹150).
Stop Loss (SL): Fixed at 3% below the entry price (e.g., entry at ₹100, SL at ₹97).
Indicator-Based Exit: Close the position if a "Death Cross" occurs (21-period EMA crosses above 9-period EMA).
Position Sizing: Allocates 20% of initial capital (₹100,000 default) per trade, calculated as (initial_capital * 0.20) / entry_price.
3. Key Indicators & Parameters
Primary Indicators:
EMA (9-period): Fast-moving average to capture short-term trends (plotted in blue).
EMA (21-period): Slower-moving average for trend confirmation (plotted in red).
RSI (14-period): Measures momentum, with a threshold of 55 for bullish confirmation (plotted in purple).
Customizable Settings in Pine Script:
initial_capital: Default ₹100,000 (adjust based on your account size).
qty_percent: Default 20% of capital per trade (adjust for risk tolerance).
sl_percent: Default 3% stop loss (adjust for volatility).
tp_percent: Default 50% take profit (adjust for reward targets).
session_time: Default "0915-1525:1234567" (Indian session, adjustable for other markets).
Default Values: Optimized for Indian stocks/indices (e.g., NIFTY 50) on 1H or 4H charts.
Risk Management:
Always use the built-in 3% stop loss.
Avoid trading during major news events (e.g., RBI announcements), as Pine Script cannot filter these.
Risk only 20% of capital per trade to diversify exposure.
Pro Tips:
Combine with support/resistance levels for manual confirmation.
Test on a demo account to validate performance on your chosen asset.
Monitor RSI for overbought conditions (>70) to anticipate reversals.
4. Visuals on Chart
Plotted Indicators:
Blue line: 9-period EMA.
Red line: 21-period EMA.
Purple line: RSI (14-period) in a separate pane.
Trade Signals:
Green triangle (below bar): Long entry.
Red triangle (above bar): Long exit (via TP, SL, or Death Cross).
5. Disclaimer & Notes
Risk Warning: Past performance is not indicative of future results. Trading involves significant risk. This strategy is for educational purposes only and is not financial advice.
Customization: The script is open-source (modify freely). Fork it to add short-selling logic or additional filters.
Note: The strategy avoids trades during non-session hours but cannot filter news events. Manually check economic calendars.
Add the script to your chart and adjust inputs (e.g., capital, TP/SL percentages).
Enable alerts for "Long Entry" and "Long Exit TP/SL" or "EMA Exit" to automate signals.
Optionally, connect to a broker via webhooks for auto-trading (consult your broker’s API).
HMA Crossover 1H with RSI, Stochastic RSI, and Trailing StopThe strategy script provided is a trading algorithm designed to help traders make informed buy and sell decisions based on certain technical indicators. Here’s a breakdown of what each part of the script does and how the strategy works:
Key Components:
Hull Moving Averages (HMA):
HMA 5: This is a Hull Moving Average calculated over 5 periods. HMAs are used to smooth out price data and identify trends more quickly than traditional moving averages.
HMA 20: This is another HMA but calculated over 20 periods, providing a broader view of the trend.
Relative Strength Index (RSI):
RSI 14: This is a momentum oscillator that measures the speed and change of price movements over a 14-period timeframe. It helps identify overbought or oversold conditions in the market.
Stochastic RSI:
%K: This is the main line of the Stochastic RSI, which combines the RSI and the Stochastic Oscillator to provide a more sensitive measure of overbought and oversold conditions. It is smoothed with a 3-period simple moving average.
Trading Signals:
Buy Signal:
Generated when the 5-period HMA crosses above the 20-period HMA, indicating a potential upward trend.
Additionally, the RSI must be below 45, suggesting that the market is not overbought.
The Stochastic RSI %K must also be below 39, confirming the oversold condition.
Sell Signal:
Generated when the 5-period HMA crosses below the 20-period HMA, indicating a potential downward trend.
The RSI must be above 60, suggesting that the market is not oversold.
The Stochastic RSI %K must also be above 63, confirming the overbought condition.
Trailing Stop Loss:
This feature helps protect profits by automatically selling the position if the price moves against the trade by 5%.
For sell positions, an additional trailing stop of 100 points is included.

Noro's Triple RSI Top/BottomIt is the indicator. Threefold RSI. 3 different RSI indicators are used:
1) The RSI indicator with the period 2
2) The RSI indicator with the period 7
3) The RSI indicator with the period 14
If at the same time RSI-2 < 10 and RSI-7 < 20 and RSI-14 < 30 = a bottom
If at the same time RSI-2 > 90 and RSI-7 > 80 and RSI-14 > 70 = a top
Parameter accuracy influences.
Strategy allows to measure indicator accuracy. To check whether this indicator is suitable for this pair and a timeframe, how exact.

BTC Momentum Strategy - RSI & Stoch RSI Entry and EMA ExitBTC Momentum Strategy: RSI & Stoch RSI Entry with EMA Exit
This strategy is designed to identify potentially strong entry points for Bitcoin (BTC) during periods of shifting momentum and then ride the trend until it shows signs of weakness. It's a straightforward, long-only strategy, meaning it only looks for opportunities to buy and then sell for a profit.
How It Works:
The strategy combines a few classic indicators to make its decisions. Think of it as a two-step confirmation system for buying, with a simple rule for selling.
1. The Buy Signal (Green Triangle)
To generate a buy signal, the strategy looks for two things to happen at the same time:
RSI Confirmation: It first waits for the Relative Strength Index (RSI) to show signs of bullish momentum. Specifically, it's looking for the RSI line to cross above its own moving average, suggesting that strength is starting to build from a lower level. This helps catch moves as they begin to turn positive.
Stochastic RSI Confirmation: As an extra layer of confirmation, it also checks the Stochastic RSI. This helps filter out weaker signals and confirm that momentum is truly shifting upwards from an oversold or "bottomed-out" condition.
When both of these conditions are met, a green "buy" triangle will appear below the candle, and the strategy will enter a long position.
2. The Sell Signal (Red Triangle)
The exit rule is simple and designed to let your winners run while protecting you when the trend reverses.
* EMA-Based Exit: The strategy plots an orange line on your chart, which is an Exponential Moving Average (EMA). The strategy will hold the position as long as the price stays above this line. If a candle closes *below* the orange EMA line, it's taken as a sign that the short-term trend is weakening, and the strategy will close the position to lock in profits or cut losses. A red "sell" triangle will appear above that candle.
Best Use:
This strategy was built with Bitcoin in mind and tends to perform best on higher timeframes like the Weekly charts. It aims to capture major swings rather than small, quick scalps.
You can adjust all the settings for the RSI, Stochastic RSI, and the Exit EMA to fine-tune the strategy to your own trading style.

Big Candle Identifier with RSI Divergence and Advanced Stops1. Strategy Objective
The main goal of this strategy is to:
Identify significant price momentum (big candles).
Enter trades at opportune moments based on market signals (candlestick patterns and RSI divergence).
Limit initial risk through a fixed stop loss.
Maximize profits by using a trailing stop that activates only after the trade moves a specified distance in the profitable direction.
2. Components of the Strategy
A. Big Candle Identification
The strategy identifies big candles as indicators of strong momentum.
A big candle is defined as:
The body (absolute difference between close and open) of the current candle (body0) is larger than the bodies of the last five candles.
The candle is:
Bullish Big Candle: If close > open.
Bearish Big Candle: If open > close.
Purpose: Big candles signal potential continuation or reversal of trends, serving as the primary entry trigger.
B. RSI Divergence
Relative Strength Index (RSI): A momentum oscillator used to detect overbought/oversold conditions and divergence.
Fast RSI: A 5-period RSI, which is more sensitive to short-term price movements.
Slow RSI: A 14-period RSI, which smoothens fluctuations over a longer timeframe.
Divergence: The difference between the fast and slow RSIs.
Positive divergence (divergence > 0): Bullish momentum.
Negative divergence (divergence < 0): Bearish momentum.
Visualization: The divergence is plotted on the chart, helping traders confirm momentum shifts.
C. Stop Loss
Initial Stop Loss:
When entering a trade, an immediate stop loss of 200 points is applied.
This stop loss ensures the maximum risk is capped at a predefined level.
Implementation:
Long Trades: Stop loss is set below the entry price at low - 200 points.
Short Trades: Stop loss is set above the entry price at high + 200 points.
Purpose:
Prevents significant losses if the price moves against the trade immediately after entry.
D. Trailing Stop
The trailing stop is a dynamic risk management tool that adjusts with price movements to lock in profits. Here’s how it works:
Activation Condition:
The trailing stop only starts trailing when the trade moves 200 ticks (profit) in the right direction:
Long Position: close - entry_price >= 200 ticks.
Short Position: entry_price - close >= 200 ticks.
Trailing Logic:
Once activated, the trailing stop:
For Long Positions: Trails behind the price by 150 ticks (trail_stop = close - 150 ticks).
For Short Positions: Trails above the price by 150 ticks (trail_stop = close + 150 ticks).
Exit Condition:
The trade exits automatically if the price touches the trailing stop level.
Purpose:
Ensures profits are locked in as the trade progresses while still allowing room for price fluctuations.
E. Trade Entry Logic
Long Entry:
Triggered when a bullish big candle is identified.
Stop loss is set at low - 200 points.
Short Entry:
Triggered when a bearish big candle is identified.
Stop loss is set at high + 200 points.
F. Trade Exit Logic
Trailing Stop: Automatically exits the trade if the price touches the trailing stop level.
Fixed Stop Loss: Exits the trade if the price hits the predefined stop loss level.
G. 21 EMA
The strategy includes a 21-period Exponential Moving Average (EMA), which acts as a trend filter.
EMA helps visualize the overall market direction:
Price above EMA: Indicates an uptrend.
Price below EMA: Indicates a downtrend.
H. Visualization
Big Candle Identification:
The open and close prices of big candles are plotted for easy reference.
Trailing Stop:
Plotted on the chart to visualize its progression during the trade.
Green Line: Indicates the trailing stop for long positions.
Red Line: Indicates the trailing stop for short positions.
RSI Divergence:
Positive divergence is shown in green.
Negative divergence is shown in red.
3. Key Parameters
trail_start_ticks: The number of ticks required before the trailing stop activates (default: 200 ticks).
trail_distance_ticks: The distance between the trailing stop and price once the trailing stop starts (default: 150 ticks).
initial_stop_loss_points: The fixed stop loss in points applied at entry (default: 200 points).
tick_size: Automatically calculates the minimum tick size for the trading instrument.
4. Workflow of the Strategy
Step 1: Entry Signal
The strategy identifies a big candle (bullish or bearish).
If conditions are met, a trade is entered with a fixed stop loss.
Step 2: Initial Risk Management
The trade starts with an initial stop loss of 200 points.
Step 3: Trailing Stop Activation
If the trade moves 200 ticks in the profitable direction:
The trailing stop is activated and follows the price at a distance of 150 ticks.
Step 4: Exit the Trade
The trade is exited if:
The price hits the trailing stop.
The price hits the initial stop loss.
5. Advantages of the Strategy
Risk Management:
The fixed stop loss ensures that losses are capped.
The trailing stop locks in profits after the trade becomes profitable.
Momentum-Based Entries:
The strategy uses big candles as entry triggers, which often indicate strong price momentum.
Divergence Confirmation:
RSI divergence helps validate momentum and avoid false signals.
Dynamic Profit Protection:
The trailing stop adjusts dynamically, allowing the trade to capture larger moves while protecting gains.
6. Ideal Market Conditions
This strategy performs best in:
Trending Markets:
Big candles and momentum signals are more effective in capturing directional moves.
High Volatility:
Larger price swings improve the probability of reaching the trailing stop activation level (200 ticks).

Z-Score RSI StrategyOverview
The Z-Score RSI Indicator is an experimental take on momentum analysis. By applying the Relative Strength Index (RSI) to a Z-score of price data, it measures how far prices deviate from their mean, scaled by standard deviation. This isn’t your traditional use of RSI, which is typically based on price data alone. Nevertheless, this unconventional approach can yield unique insights into market trends and potential reversals.
Theory and Interpretation
The RSI calculates the balance between average gains and losses over a set period, outputting values from 0 to 100. Typically, people look at the overbought or oversold levels to identify momentum extremes that might be likely to lead to a reversal. However, I’ve often found that RSI can be effective for trend-following when observing the crossover of its moving average with the midline or the crossover of the RSI with its own moving average. These crossovers can provide useful trend signals in various market conditions.
By combining RSI with a Z-score of price, this indicator estimates the relative strength of the price’s distance from its mean. Positive Z-score trends may signal a potential for higher-than-average prices in the near future (scaled by the standard deviation), while negative trends suggest the opposite. Essentially, when the Z-Score RSI indicates a trend, it reflects that the Z-score (the distance between the average and current price) is likely to continue moving in the trend’s direction. Generally, this signals a potential price movement, though it’s important to note that this could also occur if there’s a shift in the mean or standard deviation, rather than a meaningful change in price itself.
While the Z-Score RSI could be an insightful addition to a comprehensive trading system, it should be interpreted carefully. Mean shifts may validate the indicator’s predictions without necessarily indicating any notable price change, meaning it’s best used in tandem with other indicators or strategies.
Recommendations
Before putting this indicator to use, conduct thorough backtesting and avoid overfitting. The added parameters allow fine-tuning to fit various assets, but be careful not to optimize purely for the highest historical returns. Doing so may create an overly tailored strategy that performs well in backtests but fails in live markets. Keep it balanced and look for robust performance across multiple scenarios, as overfitting is likely to lead to disappointing real-world results.

TradeBuilderOverview
TradeBuilder is an ever-growing toolbox that lets you combine and compound any number of bundled indicators and algorithms to create a compound strategy. At launch, we're including two Moving Averages (SMA, EMA), RSI, and Stochastic Oscillator, with many more to come. You can use any combination of indicators, be it just one, two, or all.
Key Concepts
Indicator Integration: Tradebuilder allows the use of Moving Averages, RSI, and Stochastic Oscillators, with customizable parameters for each. More indicators to come.
Mode Selection : Choose between Confirm Trend Mode (using indicators to confirm trends) and Momentum Mode (using indicators to spot reversals).
Trade Flexibility : Offers options for both long and short trades, enabling diverse trading strategies.
Customizable Inputs : Easily toggle indicators on or off and adjust specific settings like periods and thresholds.
Signal Generation : Combines multiple conditions to generate entry and exit signals.
Input Parameters:
Moving Average (MA):
use_ma : Enable this to include the Moving Average in your strategy.
ma_cross_type : Choose between "Close/MA" (price crossing the MA) or "MA/MA" (one MA crossing another).
ma_length : Set the period for the primary MA.
ma_type : Choose between "SMA" (Simple Moving Average) or "EMA" (Exponential Moving Average).
ma_length2 : Set the period for the secondary MA if using the "MA/MA" cross type.
ma_type2 : Set the type for the secondary MA.
Relative Strength Index (RSI):
use_rsi : Enable this to include RSI in your strategy.
rsi_length : Set the period for RSI calculation.
rsi_overbought : Define the overbought level.
rsi_oversold : Define the oversold level.
Stochastic Oscillator:
use_stoch : Enable this to include the Stochastic Oscillator in your strategy.
stoch_k : Set the %K period.
stoch_d : Set the %D period.
stoch_smooth : Define the smoothing factor.
stoch_overbought : Set the overbought level.
stoch_oversold : Set the oversold level.
Confirmation or Momentum Mode:
confirm_trend : Set this to true to use RSI and Stochastic Oscillator to confirm trends (long when above overbought, short when below oversold). Set to false to trade on momentum (short when above overbought, long when below oversold).
Tip: When set to false and used with just momentum oscillators like Stochastic or RSI, it's geared toward scalping as it essentially becomes momentum trading.
Trade Directions:
trade_long : Enable to allow long trades.
trade_short : Enable to allow short trades.
Example Strategy on E-mini S&P 500 Index Futures ( CME_MINI:ES1! ), 1-minute Chart
Let’s say you want to create a strategy to go long when:
A 5-period SMA crosses above a 100-period EMA.
RSI is above 20.
The Stochastic Oscillator is above 95.
Trend Confirmation Mode is on.
For short:
A 5-period SMA crosses below a 100-period EMA.
RSI is below 45.
The Stochastic Oscillator is below 5.
Trend Confirmation Mode is on.
Here’s how you would set it up in Tradebuilder:
use_ma = true
ma_cross_type = "MA/MA"
ma_length = 5
ma_type = "SMA"
ma_length2 = 100
ma_type2 = "EMA"
use_rsi = true
rsi_length = 14
rsi_overbought = 20
rsi_oversold = 45
use_stoch = true
stoch_k = 8
stoch_d = 1
stoch_smooth = 1
stoch_overbought = 95
stoch_oversold = 5
confirm_trend = true
trade_long = true
trade_short = false
Alerts
Here is how to set TradeBuilder alerts: open a TradingView chart, attach TradeBuilder, right-click on chart -> Add Alert. Condition: Symbol (e.g. NQ) >> TradeBuilder >> Open-Ended Alert >> Once Per Bar Close.
Development Roadmap
We plan to add many more compoundable indicators to TradeBuilder over the coming months from all walks of technical analysis, including Volume, Volatility, Trend Detection/Validation, Momentum, Divergences, Chart Patterns, Support/Resistance Analysis. etc.

Adaptive RSI StrategyThe Adaptive RSI Strategy is designed to give you an edge by adapting to changing market conditions more effectively than the traditional RSI. By adjusting dynamically to recent price movements, this strategy aims to provide more timely and accurate trade signals.
How Does It Work?
You can set the number of periods for the RSI calculation. The default is 14, but feel free to experiment with different lengths to suit your trading style.
Choose the price data to base the RSI on, typically the closing price.
Decide if you want the strategy to visually highlight upward and downward movements of the Adaptive RSI (ARSI) on the chart. This can help you quickly spot trends.
Adaptive Calculation:
Alpha: The strategy uses an adaptive factor called alpha, which changes based on recent RSI values. This makes the RSI more sensitive to recent market conditions.
Adaptive RSI (ARSI): This is the core of our strategy. It calculates the ARSI using the adaptive alpha, making it more responsive to price changes compared to the traditional RSI.
Trade Signals:
Long Entry (Buy Signal): The strategy triggers a buy signal when the ARSI value crosses above its previous value. This indicates a potential upward trend, suggesting it's a good time to enter a long position.
Short Entry (Sell Signal): Conversely, a sell signal is triggered when the ARSI value crosses below its previous value, indicating a potential downward trend and suggesting it's a good time to enter a short position.
Visual Representation:
If you enable the highlight movements feature, the ARSI line on the chart will change color: green for upward movements and red for downward movements. This makes it easier to see potential trade opportunities at a glance.
Why Use the Adaptive RSI Strategy?
Responsiveness: The adaptive nature of this strategy means it's more sensitive to market changes, helping you react quicker to new trends.
Customization: You can tailor the length of the RSI period and decide whether to highlight movements, allowing you to adapt the strategy to your specific needs and preferences.
Visual Clarity: Highlighting the ARSI movements on the chart makes it easier to spot trends and potential entry points, giving you a clearer picture of the market.
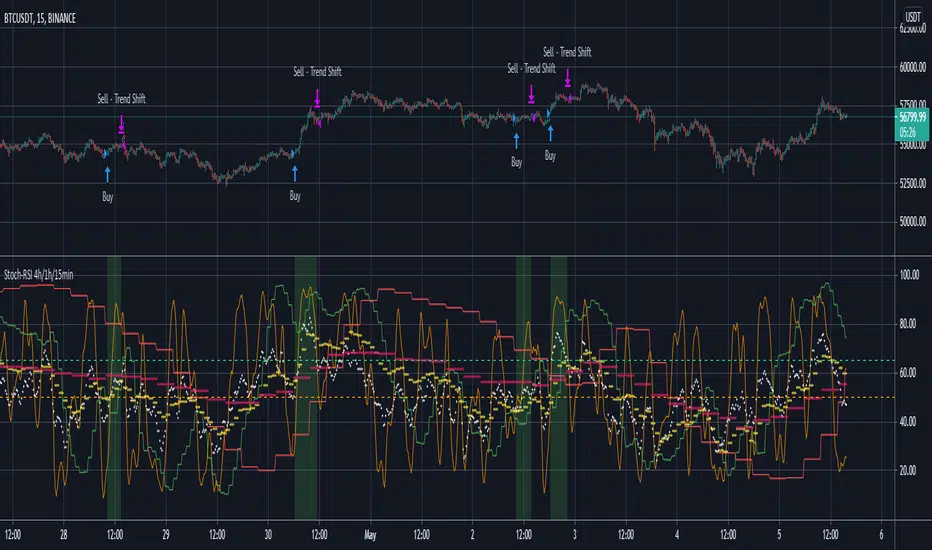
Stoch-RSI 4h/1h/15min!!!! Note: Run this on the 15min timeframe (Important) !!!!
Note the default settings on this indicator are best for BTC/USDT. For other pairs it might take some fiddling with variables to get a useful result (if a useful result is obtainable with the selected pair)
Generally, select between the options (RSI/Stoch) and (15min/1hour) and (1hour/4hours) - to find a strategy backtest result that is worth considering.
Only long positions are considered here (I tried shorts but could not get a credible backtest result with this approach).
This is an indicator which looks at RSI and StochRSI on the 15min, 1hour and 4hour timeframe.
The user can select a 15min/1hour option (RSI/Stoch) and then also a 1hour/4hour option (RSI/Stoch).
So there is one selection from a lower (15min/1hour) timeframe and another selection from a longer (1hour/4hour) timeframe.
The general idea is to, consider buying when, the lower timeframe (RSI/Stoch) is going upwards and also the longer timeframe (RSI/Stoch) is going upwards.
A good backtest result would suggest that the confluence in RSI/Stoch over the shorter and longer timeframes can estimate a good time to buy.
(Careful with a 1hour Stoch for the shorter timeframe variable as its possible to also select a 1hour Stoch for the longer timeframe variable.)
There are user set variables that can be set to avoid a buy signal, if either the lower or high timeframe variables are greater than.
For example, buying when a rsi/stoch is >65% might not be advisable as the rsi/stoch is most probably due for a downswing when above this value.
The strategy closes a position when either the shorter or longer timeframe variables no longer are going up.
There is also a take profit % which can be set to exit trades at a given %.
The default values on this indicator tool are for bitcoin, which shows a reasonable backtest result. - worth sharing on tradingview.
Please do get in touch for any additional information/suggestions.
Sincerely,
MoonFlag
Noro's Fast RSI Strategy v1.3In 1.3 added:
+ Min/Max
+ Arrows
For:
- crypto/fiat
- crypto/crypto
- timeframes: 1hour, 30min, 15min, 5min
Strategy uses 2 indicators:
1) RSI indicator, period = 7 (default)
2) EMA Body, period = 30
EMA Body
Step 1. The candle body size is calculated = abs(close-open)
Step 2. The average size of a body of a candle is calculated. Only 30 last candles. EMA .
Step 3. If the body of the current candle is less than a half of a body of an average candle, then such candle is ignored by strategy because too small.
Strategy
If RSI < RSI Limit and the body of a candle is more than a body of an average candle / 4 - to open long.
If RSI > RSI Limit and the body of a candle is more than a body of an average candle / 2 - to close long.
If RSI > (100 - RSI Limit) and the body of a candle is more than a body of an average candle / 4 - to open short.
If RSI < (100 - RSI Limit) and the body of a candle is more than a body of an average candle / 2 - to close short.
If the candle a red and previous candle too red and closing of a candle is lower than closing of the previous candle and Min/Max is activated - to open long.
If the candle a green and previous candle too green and closing of a candle is higher than closing of the previous candle and Min/Max is activated - to open short.

Noro's Fast RSI Strategy v1.2For:
- crypto/fiat
- crypto/crypto
- timeframes: 1hour, 30min, 15min, 5min
Strategy uses 2 indicators:
1) RSI indicator, period = 7 (default)
2) EMA Body, period = 30
EMA Body
Step 1. The candle body size is calculated = abs(close-open)
Step 2. The average size of a body of a candle is calculated. Only 30 last candles. EMA .
Step 3. If the body of the current candle is less than a half of a body of an average candle, then such candle is ignored by strategy because too small.
Strategy
If RSI < RSI Limit and the body of a candle is more than a body of an average candle / 4 - to open long.
If RSI > RSI Limit and the body of a candle is more than a body of an average candle / 2 - to close long.
If RSI > (100 - RSI Limit) and the body of a candle is more than a body of an average candle / 4 - to open short.
If RSI < (100 - RSI Limit) and the body of a candle is more than a body of an average candle / 2 - to close short.

Noro's Fast RSI Strategy v1.1For:
- crypto/fiat
- crypto/crypto
- timeframes: 1hour, 30min, 15min, 5min
Strategy uses 2 indicators:
1) RSI indicator, period = 7 (default)
2) EMA Body, period = 30
EMA Body
Step 1. The candle body size is calculated = abs(close-open)
Step 2. The average size of a body of a candle is calculated. Only 30 last candles. EMA .
Step 3. If the body of the current candle is less than a half of a body of an average candle, then such candle is ignored by strategy because too small.
Strategy
If RSI < RSI Limit and the body of a candle is more than a third of a body of an average candle - to open long.
If RSI > RSI Limit and the body of a candle is more than a third of a body of an average candle - to close long.
If RSI > (100 - RSI Limit) and the body of a candle is more than a third of a body of an average candle - to open short.
If RSI < (100 - RSI Limit) and the body of a candle is more than a third of a body of an average candle - to close short.

Noro's Fast RSI Strategy v1.0For:
- crypto/fiat
- crypto/crypto
- timeframes: 1hour, 30min, 15min, 5min
Strategy uses 2 indicators:
1) RSI indicator, period = 3
2) EMA Body, period = 30
EMA Body
Step 1. The candle body size pays off = abs(close-open)
Step 2. The average size of a body of a candle pays off. Only 30 last candles. EMA.
Step 3. If the body of the current candle is less than a half of a body of an average candle, then such candle is ignored by strategy because too small.
Strategy
If RSI < RSI Limit and the body of a candle is more than a half of a body of an average candle - to open long.
If RSI > RSI Limit and the body of a candle is more than a half of a body of an average candle - to close long.
If RSI > (100 - RSI Limit) and the body of a candle is more than a half of a body of an average candle - to open short.
If RSI < (100 - RSI Limit) and the body of a candle is more than a half of a body of an average candle - to close short.

W/M Pattern Strategy + MACD/RSI Confirmation V3.0 by ThaungkmitlW/M Pattern Strategy + MACD/RSI Confirmation V3.0
Description Text:
This script is a comprehensive Strategy (backtestable) that combines classical Chart Patterns with momentum indicators to identify high-probability reversal setups. It focuses on detecting "W" Patterns (Double Bottoms/Higher Lows) and "M" Patterns (Double Tops/Lower Highs), filtered by MACD and RSI to reduce false signals.
How It Works
The strategy relies on a "Confluence" of three factors before triggering an entry:
1. Price Action Patterns (W & M)
W Pattern (Bullish): The script detects Pivot Lows. If a new Pivot Low is higher than the previous one (forming a Higher Low structure), it marks a potential "W" pattern.
M Pattern (Bearish): The script detects Pivot Highs. If a new Pivot High is lower than the previous one (forming a Lower High structure), it marks a potential "M" pattern.
2. MACD Confirmation (Zero Line)
Price action alone is not enough. The script waits for the MACD Line to cross the Zero Line:
Buy: MACD crosses UP over 0 (indicating bullish momentum shift).
Sell: MACD crosses DOWN under 0 (indicating bearish momentum shift).
3. RSI Threshold
To ensure the trend has strength, the RSI (Relative Strength Index) acts as a final filter:
Buy Condition: RSI must be above 50.
Sell Condition: RSI must be below 50.
Visual Features
Pivot Labels: Automatically marks Pivot High (Red Triangle) and Pivot Low (Green Triangle).
Pattern Lines: Draws lines connecting the swing points when a potential W or M pattern is detected.
Signals: Displays "BUY" or "SELL" labels with text explaining the setup (e.g., "W+MACD+RSI").
Background: Highlights the chart background (Green/Red) when a valid trade signal occurs.
EMAs: Plots EMA 10 (Blue) and EMA 15 (Red) to help you visualize the immediate trend direction.
Settings
Pivot Left/Right Bars: Adjust the sensitivity of the Swing detection.
MACD Settings: Fast, Slow, and Signal lengths (Standard 12, 26, 9).
RSI Settings: Adjust Length and the Threshold level (Default is 50).
Backtesting
This is a strategy script, meaning you can use the Strategy Tester panel below the chart to see how this logic performs on historical data for your chosen timeframe and asset.
Disclaimer: This tool is for educational purposes. Past performance in backtesting does not guarantee future results.

VWAP + Multi-Timeframe RSI StrategyThis strategy combines VWAP trend direction with confirmation from RSI on a higher timeframe. The idea is to only take trades when both intraday momentum and higher-timeframe trend are aligned, increasing accuracy.
LONG Entry:
Price above VWAP (bullish environment).
RSI on the current timeframe is below overbought (room to rise).
RSI on the higher timeframe (default H1) is above 50 (bullish confirmation).
SHORT Entry:
Price below VWAP (bearish environment).
RSI on the current timeframe is above oversold (room to fall).
RSI on the higher timeframe is below 50 (bearish confirmation).
Exit Rule:
Stop-loss near VWAP.
Take-profit at ~2x risk or when major levels are reached.
Best Timeframes:
Use 15m or 30m chart with H1 RSI for intraday trading.
Use 1H chart with Daily RSI for swing trading.
⚡ The higher-timeframe RSI filter reduces false signals and aligns trades with institutional flow.

Kaito Box with RSI Div(Dynamic Adjustment + MA + Long)The script implements a dynamic trading strategy that combines box range detection, RSI divergence signals, and moving average trend analysis. It is designed for use on OKX Signal Bots and includes features for dynamic position scaling and partial position closing. Below is a summary of its key functionalities:
Key Features:
Box Range Detection:
The script identifies price ranges using the highest high and lowest low of a configurable boxLength period.
These levels are plotted on the chart to visualize the price range.
RSI Divergence Detection:
The script calculates RSI using a configurable rsiLength.
Detects bullish divergence when price makes a lower low, but RSI makes a higher low.
Detects bearish divergence when price makes a higher high, but RSI makes a lower high.
Includes separate left and right lookback periods (leftLookback, rightLookback) for precise local extrema detection.
Customizable Moving Averages:
Supports multiple types of Moving Averages (SMA, EMA, SMMA, WMA, VWMA).
Calculates and plots MA20, MA50, MA100, and MA200 on a user-defined timeframe (custom_timeframe).
Identifies uptrends and downtrends based on the alignment of the moving averages and price levels.
Dynamic Position Scaling:
Implements dynamic position sizing for long entries and partial position closing for exits.
The percentage of position size added or closed is based on the difference between the current price and the average position price (avgPrice), with configurable minimum thresholds (minEnterPercent, minExitPercent).
Signal Integration for OKX Bots:
Sends buy/sell signals to OKX Signal Bots using the configured signalToken.
Supports market or limit orders with configurable price offsets and investment types.
Trend-Based Signal Filtering:
Only triggers long signals during downtrends and short signals during uptrends, ensuring trades align with the overall market context.
Visual Annotations:
Plots bullish and bearish divergence signals on the chart.
Displays labels showing dynamic position size adjustments and current average price during trades.
How It Works:
Long Signals:
Triggered when the price breaches the lower box range, and a bullish RSI divergence is detected.
Additional filtering ensures long trades are executed only during downtrend conditions.
Dynamically adjusts the position size based on the price difference from the average entry price.
Short Signals:
Triggered when the price breaches the upper box range, and a bearish RSI divergence is detected.
Additional filtering ensures short trades are executed only during uptrend conditions.
Dynamically closes portions of the position based on price movement relative to the average entry price.
Alerts:
Generates actionable alerts formatted for OKX bots, including order type, signal token, and dynamically calculated position sizes.
Use Case:
This strategy is well-suited for automated trading on platforms like OKX, where it can:
Exploit price ranges and RSI divergences for precise entries and exits.
Dynamically manage position sizes to optimize risk-reward.
Adapt to different market conditions using configurable parameters like moving averages, divergence lookbacks, and trend filters.
This script provides a robust foundation for traders looking to automate their strategies while maintaining flexibility and control over their trading logic.

DAILY Supertrend + EMA Crossover with RSI FilterThis strategy is a technical trading approach that combines multiple indicators—Supertrend, Exponential Moving Averages (EMAs), and the Relative Strength Index (RSI)—to identify and manage trades.
Core Components:
1. Exponential Moving Averages (EMAs):
Two EMAs, one with a shorter period (fast) and one with a longer period (slow), are calculated. The idea is to spot when the faster EMA crosses above or below the slower EMA. A fast EMA crossing above the slow EMA often suggests upward momentum, while crossing below suggests downward momentum.
2. Supertrend Indicator:
The Supertrend uses Average True Range (ATR) to establish dynamic support and resistance lines. These lines shift above or below price depending on the prevailing trend. When price is above the Supertrend line, the trend is considered bullish; when below, it’s considered bearish. This helps ensure that the strategy trades only in the direction of the overall trend rather than against it.
3. RSI Filter:
The RSI measures momentum. It helps avoid buying into markets that are already overbought or selling into markets that are oversold. For example, when going long (buying), the strategy only proceeds if the RSI is not too high, and when going short (selling), it only proceeds if the RSI is not too low. This filter is meant to improve the quality of the trades by reducing the chance of entering right before a reversal.
4. Time Filters:
The strategy only triggers entries during user-specified date and time ranges. This is useful if one wants to limit trading activity to certain trading sessions or periods with higher market liquidity.
5. Risk Management via ATR-based Stops and Targets:
Both stop loss and take profit levels are set as multiples of the ATR. ATR measures volatility, so when volatility is higher, both stops and profit targets adjust to give the trade more breathing room. Conversely, when volatility is low, stops and targets tighten. This dynamic approach helps maintain consistent risk management regardless of market conditions.
Overall Logic Flow:
- First, the market conditions are analyzed through EMAs, Supertrend, and RSI.
- When a buy (long) condition is met—meaning the fast EMA crosses above the slow EMA, the trend is bullish according to Supertrend, and RSI is below the specified “overbought” threshold—the strategy initiates or adds to a long position.
- Similarly, when a sell (short) condition is met—meaning the fast EMA crosses below the slow EMA, the trend is bearish, and RSI is above the specified “oversold” threshold—it initiates or adds to a short position.
- Each position is protected by an automatically calculated stop loss and a take profit level based on ATR multiples.
Intended Result:
By blending trend detection, momentum filtering, and volatility-adjusted risk management, the strategy aims to capture moves in the primary trend direction while avoiding entries at excessively stretched prices. Allowing multiple entries can potentially amplify gains in strong trends but also increases exposure, which traders should consider in their risk management approach.
In essence, this strategy tries to ride established trends as indicated by the Supertrend and EMAs, filter out poor-quality entries using RSI, and dynamically manage trade risk through ATR-based stops and targets.
