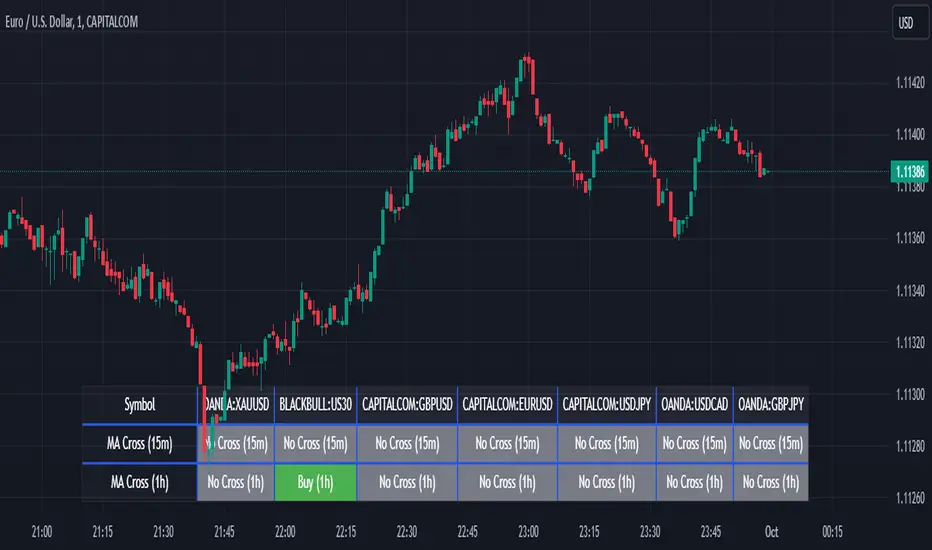
Screener MA CrossThe Screener MA Cross is an efficient tool designed to help traders quickly identify potential buy and sell signals across multiple currency pairs and timeframes. This script monitors the crossover behavior of two moving averages (MA8 and MA50) to determine possible entry points for trades.
Key Features:
Multi-Pair Monitoring: The indicator allows users to screen popular assets, including XAUUSD, US30, GBPUSD, EURUSD, USDJPY, USDCAD, and GBPJPY. You can add or remove symbols based on your preference.
Dual Timeframe Analysis: It tracks moving average crossovers on both 15-minute and 1-hour charts, giving users insights into short-term and medium-term trends without switching between timeframes.
Color-Coded Signals:
Green: Indicates a bullish "Buy" signal when the MA8 crosses above the MA50, suggesting upward momentum.
Red: Indicates a bearish "Sell" signal when the MA8 crosses below the MA50, signaling downward momentum.
Gray: Represents a neutral or no-cross state, indicating no clear trend.
Clean Table Format: Displays all relevant signals directly on your chart in a structured, easy-to-read table format, allowing you to quickly scan and assess trading opportunities.
How It Works: The script uses moving averages (MA8 and MA50) to analyze crossover patterns, a common method for identifying trend changes. A crossover occurs when a shorter moving average (MA8) crosses above or below a longer moving average (MA50). By requesting data from the 15-minute and 1-hour timeframes, the Screener MA Cross provides a clear overview of the market situation across various assets, helping you decide on potential trades.
This tool is particularly useful for trend-following strategies and can be used to spot momentum shifts on smaller timeframes, making it ideal for day traders and scalpers.
How to Use:
Add the indicator to your chart and customize the asset symbols to match your trading preferences.
Monitor the signals on the table. Green signals indicate potential buying opportunities, while red signals suggest possible selling points.
Use alongside other analysis: While the Screener MA Cross offers valuable insights, it's best used in combination with other indicators and analysis techniques to confirm trade setups.
在腳本中搜尋"scalp"
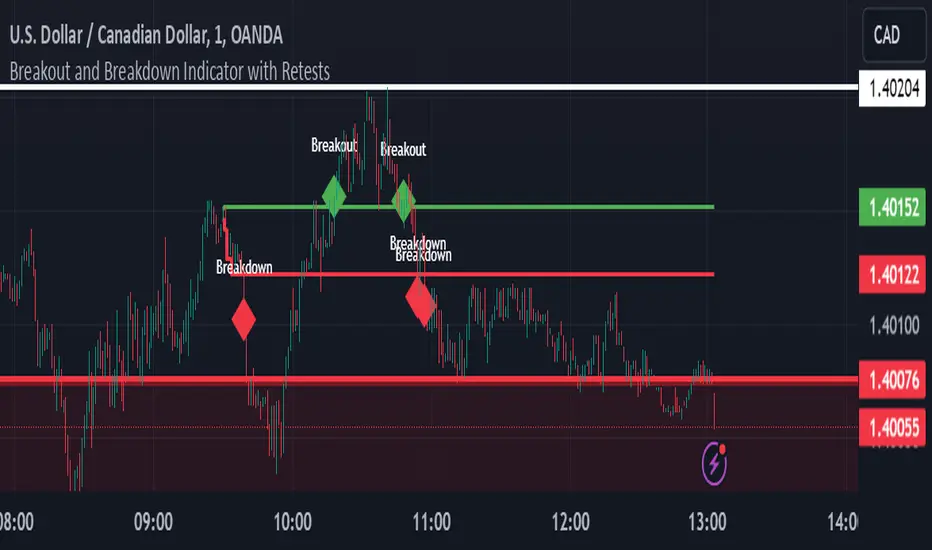
Breakout and Breakdown Indicator with RetestsThis indicator is designed to help traders identify high-probability breakout and breakdown points based on the first 5 minutes of market activity (9:30 am to 9:35 am). It works effectively on both the 1-minute and 5-minute timeframes, making it ideal for day traders and scalpers.
This indicator is a better indicator of my previous 5-Minute Opening Range Breakout indicator.
Key Features:
Dynamic Support and Resistance Lines: Automatically plots the highest and lowest price levels from 9:30 am to 9:35 am, providing essential support and resistance zones.
Breakout/Breakdown Detection: Identifies and marks successful breakout and breakdown points only after a confirmed retest, ensuring more accurate signals.
Visual Markers: Uses customizable green diamonds for successful breakouts and red diamonds for successful breakdowns, allowing easy identification on the chart.
Customization Options:
Change Colors: You can personalize the color of the breakout and breakdown markers, the label text, and the lines drawn from the 9:30 am to 9:35 am window.
Adapt to Your Chart: Adjust the indicator to match your preferred charting theme, ensuring it blends seamlessly with your trading setup.
How It Works:
Plots Key Levels: Identifies the highest and lowest prices during the first 5 minutes of trading (9:30 am to 9:35 am) and plots them on the chart.
Monitors Retests: Waits for a retest of these levels before confirming a breakout or breakdown.
Labels Breakouts/Breakdowns: After a retest, successful breakouts are marked with green diamonds and "Breakout" text, while breakdowns are marked with red diamonds and "Breakdown" text.
Why Use This Indicator?
Avoid False Signals: The retest requirement helps filter out false breakouts and breakdowns, offering more reliable trading signals.
Works Across Timeframes: Suitable for both 1-minute and 5-minute charts, allowing flexibility for different trading styles.
Some what Customizable: Adjust colors to fit your charting preferences and enhance visual clarity.
Recommended Use: Combine this indicator with other technical analysis tools, such as volume, candlestick patterns, or moving averages, for more informed trading decisions.
Uptrick: Volume-Weighted EMA Signal### **Uptrick: Volume-Weighted EMA Signal (UVES) Indicator - Comprehensive Description**
#### **Overview**
The **Uptrick: Volume-Weighted EMA Signal (UVES)** is an advanced, multifaceted trading indicator meticulously designed to provide traders with a holistic view of market trends by integrating Exponential Moving Averages (EMA) with volume analysis. This indicator not only identifies the direction of market trends through dynamic EMAs but also evaluates the underlying strength of these trends using real-time volume data. UVES is a versatile tool suitable for various trading styles and markets, offering a high degree of customization to meet the specific needs of individual traders.
#### **Purpose**
The UVES indicator aims to enhance traditional trend-following strategies by incorporating a critical yet often overlooked component: volume. Volume is a powerful indicator of market strength, providing insights into the conviction behind price movements. By merging EMA-based trend signals with detailed volume analysis, UVES offers a more nuanced and reliable approach to identifying trading opportunities. This dual-layer analysis allows traders to differentiate between strong trends supported by significant volume and weaker trends that may be prone to reversals.
#### **Key Features and Functions**
1. **Dynamic Exponential Moving Average (EMA):**
- The core of the UVES indicator is its dynamic EMA, calculated over a customizable period. The EMA is a widely used technical indicator that smooths price data to identify the underlying trend. In UVES, the EMA is dynamically colored—green when the current EMA value is above the previous value, indicating an uptrend, and red when below, signaling a downtrend. This visual cue helps traders quickly assess the trend direction without manually calculating or interpreting raw data.
2. **Comprehensive Moving Average Customization:**
- While the EMA is the default moving average in UVES, traders can select from various other moving average types, including Simple Moving Average (SMA), Smoothed Moving Average (SMMA), Weighted Moving Average (WMA), and Volume-Weighted Moving Average (VWMA). Each type offers unique characteristics:
- **SMA:** Provides a simple average of prices over a specified period, suitable for identifying long-term trends.
- **EMA:** Gives more weight to recent prices, making it more responsive to recent market movements.
- **SMMA (RMA):** A slower-moving average that reduces noise, ideal for capturing smoother trends.
- **WMA:** Weighs prices based on their order in the dataset, making recent prices more influential.
- **VWMA:** Integrates volume data, emphasizing price movements that occur with higher volume, making it particularly useful in volume-sensitive markets.
3. **Signal Line for Trend Confirmation:**
- UVES includes an optional signal line, which applies a secondary moving average to the primary EMA. This signal line can be used to smooth out the EMA and confirm trend changes. The signal line’s color changes based on its slope—green for an upward slope and red for a downward slope—providing a clear visual confirmation of trend direction. Traders can adjust the length and type of this signal line, allowing them to tailor the indicator’s responsiveness to their trading strategy.
4. **Buy and Sell Signal Generation:**
- UVES generates explicit buy and sell signals based on the interaction between the EMA and the signal line. A **buy signal** is triggered when the EMA transitions from a red (downtrend) to a green (uptrend), indicating a potential entry point. Conversely, a **sell signal** is triggered when the EMA shifts from green to red, suggesting an exit or shorting opportunity. These signals are displayed directly on the chart as upward or downward arrows, making them easily identifiable even during fast market conditions.
5. **Volume Analysis with Real-Time Buy/Sell Volume Table:**
- One of the standout features of UVES is its integration of volume analysis, which calculates and displays the volume attributed to buying and selling activities. This analysis includes:
- **Buy Volume:** The portion of the total volume associated with price increases (close higher than open).
- **Sell Volume:** The portion of the total volume associated with price decreases (close lower than open).
- **Buy/Sell Ratio:** A ratio of buy volume to sell volume, providing a quick snapshot of market sentiment.
- These metrics are presented in a real-time table positioned in the top-right corner of the chart, with customizable colors and formatting. The table updates with each new bar, offering continuous feedback on the strength and direction of the market trend based on volume data.
6. **Customizable Settings and User Control:**
- **EMA Length and Source:** Traders can specify the lookback period for the EMA, adjusting its sensitivity to price changes. The source for EMA calculations can also be customized, with options such as close, open, high, low, or other custom price series.
- **Signal Line Customization:** The signal line’s length, type, and width can be adjusted to suit different trading strategies, allowing traders to optimize the balance between trend detection and noise reduction.
- **Offset Adjustment:** The offset feature allows users to shift the EMA and signal line forward or backward on the chart. This can help align the indicator with specific price action or adjust for latency in decision-making processes.
- **Volume Table Positioning and Formatting:** The position, size, and color scheme of the volume table are fully customizable, enabling traders to integrate the table seamlessly into their chart setup without cluttering the visual workspace.
7. **Versatility Across Markets and Trading Styles:**
- UVES is designed to be effective across a wide range of financial markets, including Forex, stocks, cryptocurrencies, commodities, and indices. Its adaptability to different markets is supported by its comprehensive customization options and the inclusion of volume analysis, which is particularly valuable in markets where volume plays a crucial role in price movement.
#### **How Different Traders Can Benefit from UVES**
1. **Trend Followers:**
- Trend-following traders will find UVES particularly beneficial for identifying and riding trends. The dynamic EMA and signal line provide clear visual cues for trend direction, while the volume analysis helps confirm the strength of these trends. This combination allows trend followers to stay in profitable trades longer and exit when the trend shows signs of weakening.
2. **Volume-Based Traders:**
- Traders who focus on volume as a key indicator of market strength can leverage the UVES volume table to gain insights into the buying and selling pressure behind price movements. By monitoring the buy/sell ratio, these traders can identify periods of strong conviction (high buy volume) or potential reversals (high sell volume) with greater accuracy.
3. **Scalpers and Day Traders:**
- For traders operating on shorter time frames, UVES provides quick and reliable signals that are essential for making rapid trading decisions. The ability to customize the EMA length and type allows scalpers to fine-tune the indicator for responsiveness, while the volume analysis offers an additional layer of confirmation to avoid false signals.
4. **Swing Traders:**
- Swing traders, who typically hold positions for several days to weeks, can use UVES to identify medium-term trends and potential entry and exit points. The indicator’s ability to filter out market noise through the signal line and volume analysis makes it ideal for capturing significant price movements without being misled by short-term volatility.
5. **Position Traders and Long-Term Investors:**
- Even long-term investors can benefit from UVES by using it to identify major trend reversals or confirm the strength of long-term trends. The flexibility to adjust the EMA and signal line to longer periods ensures that the indicator remains relevant for detecting shifts in market sentiment over extended time frames.
#### **Optimal Settings for Different Markets**
- **Forex Markets:**
- **EMA Length:** 9 to 14 periods.
- **Signal Line:** Use VWMA or WMA for the signal line to incorporate volume data, which is crucial in the highly liquid Forex markets.
- **Best Use:** Short-term trend following, with an emphasis on identifying rapid changes in market sentiment.
- **Stock Markets:**
- **EMA Length:** 20 to 50 periods.
- **Signal Line:** SMA or EMA with a slightly longer length (e.g., 50 periods) to capture broader market trends.
- **Best Use:** Medium to long-term trend identification, with volume analysis confirming the strength of institutional buying or selling.
- **Cryptocurrency Markets:**
- **EMA Length:** 9 to 12 periods, due to the high volatility in crypto markets.
- **Signal Line:** SMMA or EMA for smoothing out extreme price fluctuations.
- **Best Use:** Identifying entry and exit points in volatile markets, with the volume table providing insights into market manipulation or sudden shifts in trader sentiment.
- **Commodity Markets:**
- **EMA Length:** 14 to 21 periods.
- **Signal Line:** WMA or VWMA, considering the impact of trading volume on commodity prices.
- **Best Use:** Capturing medium-term price movements and confirming trend strength with volume data.
#### **Customization for Advanced Users**
- **Advanced Offset Usage:** Traders can experiment with different offset values to see how shifting the EMA and signal line impacts the timing of buy/sell signals. This can be particularly useful in markets with known latency or for strategies that require a delayed confirmation of trend changes.
- **Volume Table Integration:** The position, size, and colors of the volume table can be adjusted to fit seamlessly into any trading setup. For example, a trader might choose to position the table in the bottom-right corner and use a smaller size to keep the focus on price action while still having access to volume data.
- **Signal Filtering:** By combining the signal line with the primary EMA, traders can filter out false signals during periods of low volatility or when the market is range-bound. Adjusting the length of the signal line allows for greater control over the sensitivity of the trend detection.
#### **Conclusion**
The **Uptrick: Volume-Weighted EMA Signal (UVES)** is a powerful and adaptable indicator designed for traders who demand more from their technical analysis tools. By integrating dynamic EMA trend signals with real-time volume analysis, UVES offers a comprehensive view of market conditions, making it an invaluable resource for identifying trends, confirming signals, and understanding market sentiment. Whether you are a day trader, swing trader, or long-term investor, UVES provides the versatility, precision, and customization needed to make more informed and profitable trading decisions. With its ability to adapt to various markets and trading styles, UVES is not just an indicator but a complete trend analysis solution.

Overlay-ChartOverlay-Chart Indicator
The Overlay-Chart Indicator is an advanced script designed for scalpers and day traders, providing comprehensive insights into daily, weekly, monthly, and previous period price levels. This indicator helps traders visualize critical price levels and make informed decisions based on historical and current data.
Key Features:
Drawing Future Lines with Labels:
The script uses the drawFutureLine function to plot future price levels with customizable labels. This helps traders anticipate and react to key price points.
Daily Levels:
Displays the open, low, high, close, and equilibrium (EQ) prices for the current day. This provides a quick reference for daily trading ranges and significant price points.
Weekly Levels:
Shows the open, low, high, close, and equilibrium prices for the current week, offering a broader view of market trends and key weekly price levels.
Monthly Levels:
Illustrates the open, low, high, close, and equilibrium prices for the current month, enabling traders to understand long-term trends and significant monthly price points.
Previous Day, Week, and Month Levels:
Historical data from previous periods (day, week, month) is displayed, allowing traders to compare past and present price levels to identify patterns and potential support/resistance levels.
Customizable Colors:
Traders can choose colors for daily, weekly, monthly, and previous day levels to enhance chart readability and personalization.
Flexible Display Options:
Users can select which price levels (Open, Low, High, Close, EQ) to display for each period (daily, weekly, monthly, previous day, week, month).
How It Works:
The script fetches historical and current price data using the request.security function. It then uses these data points to draw lines on the chart representing significant price levels. These lines are drawn into the future to help traders visualize where these levels will be in upcoming bars. Labels are added to these lines for easy identification.
How to Use:
Configure Inputs:
Enable or disable the display of daily, weekly, monthly, and previous period levels using the input options.
Customize colors for different levels to match your charting preferences.
Analyze Key Levels:
Observe the plotted lines and labels to understand critical price points for the current and past periods.
Use this information to identify potential entry and exit points, support and resistance levels, and overall market trends.
Future Planned Features:
The script includes several features that are currently commented out but planned for future updates:
Volume Weighted Average Price (VWAP):
Display VWAP for daily, weekly, and monthly periods to provide an average price based on volume.
Point of Control (POC):
Show the price level with the highest trading volume for daily, weekly, and monthly periods.
Value Area High (VAH) and Low (VAL):
Display the upper and lower boundaries of the value area where most trading activity occurs for daily, weekly, and monthly periods.
These enhancements will offer additional insights into volume distribution and market sentiment, further improving the utility of the Overlay-Chart Indicator for traders.
This script is specifically designed to cater to the needs of scalpers and day traders who require precise, visually intuitive data for their trading strategies. The planned features will further enhance its effectiveness, providing a comprehensive tool for market analysis.

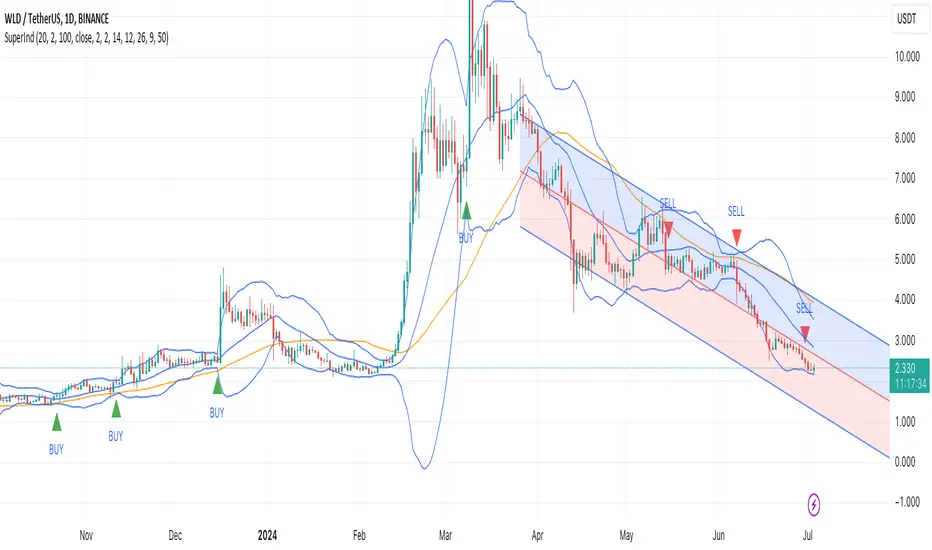
Super IndicatorOverview of the Combined Indicator
This combined indicator leverages three major technical analysis tools:
Bollinger Bands
Linear Regression Channels
Scalping Strategy Indicators (RSI, MACD, SMA)
Each of these tools provides unique insights into market conditions, and their integration offers a comprehensive view of price movements, trends, and potential trading signals.
1. Bollinger Bands
Purpose:
Bollinger Bands are used to measure market volatility and identify overbought or oversold conditions.
Components:
Basis (Middle Band): Typically a 20-period Simple Moving Average (SMA).
Upper Band: Basis + (2 * Standard Deviation).
Lower Band: Basis - (2 * Standard Deviation).
Why They Complement:
Bollinger Bands expand and contract based on market volatility. When the bands are narrow, it indicates low volatility and potential for a significant move. Wide bands indicate high volatility. This helps traders gauge the strength of market moves and potential reversals.
2. Linear Regression Channels
Purpose:
Linear Regression Channels identify the overall trend direction and measure deviation from the mean price over a specific period.
Components:
Middle Line (Linear Regression Line): The line of best fit through the price data over a specified period.
Upper and Lower Lines: Channels created by adding/subtracting a multiple of the standard deviation or another deviation measure from the regression line.
Why They Complement:
Linear Regression Channels provide a clear visual representation of the trend direction and the range within which prices typically fluctuate. This can help traders identify trend continuations and reversals, making it easier to spot entry and exit points.
3. Scalping Strategy Indicators
Purpose:
The RSI, MACD, and SMA are used to generate short-term buy and sell signals, which are essential for scalping strategies aimed at capturing quick profits from small price movements.
Components:
RSI (Relative Strength Index): Measures the speed and change of price movements, typically over 14 periods. It helps identify overbought and oversold conditions.
MACD (Moving Average Convergence Divergence): Consists of the MACD line, Signal line, and histogram. It helps identify changes in the strength, direction, momentum, and duration of a trend.
SMA (Simple Moving Average): The average price over a specified period, used to smooth out price data and identify trends.
Why They Complement:
These indicators provide short-term signals that can confirm or refute the signals given by Bollinger Bands and Linear Regression Channels. For example, a buy signal might be more reliable if the price is near the lower Bollinger Band and the MACD crosses above its signal line.
How They Work Together
Scenario 1: Confirming Trend Continuations
Bollinger Bands: Price staying near the upper band suggests a strong uptrend.
Linear Regression Channels: Price staying above the middle line confirms the uptrend.
5-Minute Scalping Strategy: RSI not in overbought territory, and MACD showing bullish momentum confirms continuation.
Scenario 2: Identifying Reversals
Bollinger Bands: Price touching or moving outside the lower band suggests oversold conditions.
Linear Regression Channels: Price at the lower channel line indicates potential support.
5-Minute Scalping Strategy: RSI in oversold territory, and MACD showing a bullish crossover indicates a reversal.
Scenario 3: Volatility Breakouts
Bollinger Bands: Bands contracting indicates low volatility and potential breakout.
Linear Regression Channels: Price moving away from the middle line signals potential breakout direction.
Scalping Strategy: MACD and RSI confirming the breakout direction for entry.
Input Parameters:
Define settings for Bollinger Bands, Linear Regression Channels, and the scalping strategy.
Allow users to customize lengths, multipliers, and colors.
Bollinger Bands Calculation:
Calculate the basis (SMA) and standard deviation.
Derive the upper and lower bands from the basis and standard deviation.
Linear Regression Channel Calculation:
Compute the slope, average, and intercept of the linear regression line.
Calculate deviations to plot upper and lower channel lines.
5-Minute Scalping Strategy:
Calculate RSI, MACD, and SMA for short-term trend analysis.
Define buy and sell conditions based on these indicators.
Plotting and Alerts:
Plot Bollinger Bands and Linear Regression Channels on the chart.
Plot buy and sell signals with shapes.
Set alerts for key conditions like exiting the regression channel bounds and trend switches.
Conclusion
By combining Bollinger Bands, Linear Regression Channels, and a 5-minute scalping strategy, this indicator offers a robust tool for traders. Bollinger Bands provide volatility insights, Linear Regression Channels highlight trend direction and potential reversals, and the scalping strategy offers precise entry and exit points. Together, these tools can enhance a trader's ability to make informed decisions in various market conditions.
LNL Trend SystemLNL Trend System is an ATR based day trading system specifically designed for intra-day traders and scalpers. The System works on any chart time frame & can be applied to any market. The study consist of two components - the Trend Line and the Stop Line. Trend System is based on a special ATR calculation that is achieved by combining the previous values of the 13 EMA in relation to the ATR which creates a line of deviations that visually look similar to the basic moving average but actually produce very different results ESPECIALLY in sideways market.
Trend Line:
Trend Line is a simple line which is basically a fast gauge represented by the 13 EMA that can change the color based on the current trend structure defined by multiple averages (8,13,21,34 EMAs). Trend Line is there to simply add the confluence for the current trend. Colors of the line are pretty much self-explanatory. Whenever the line turns red it states that the current structure is bearish. Vice versa for green line. Gray line represents neutral market structure.
Stop Line:
Stop Line is an ATR deviaton line with special calculation based on the previous bar ATRs and position of the price in relation to the current and previous values of 13 EMA. As already stated, this creates an ATR deviation marker either above or below the price that trails the price up or down until they touch. Whenever the price comes into the Stop Line it means it is making an ATR expansion move up or down .This touch will usually resolve into a reaction (a bounce) which provides trade opportunities.
Trend Bars:
When turned ON, Trend Bars can provide additional confulence of the current trend alongside with the Trend Line color. Trend Bars are based on the DMI and ADX indicators. Whenever the DMI is bearish and ADX is above 20 the candles paint themselfs red. And vice versa applies for the green candles and bullish DMI. Whenever the ADX falls below the 20, candles are netural (Gray) which means there is no real trend in place at the moment.
Trend Mode:
There are total of 5 different trend modes available. Each mode is visualizing different ATR settings which provides either aggressive or more conservative approach. The more tigher the mode, the more closer the distance between the price and the Stop Line. First two modes were designed for slower markets, whereas the "Loose" and "FOMC" modes are more suitable for products with high volatility.
Trend Modes:
1. Tight
Ideal for the slowest markets. Slowest market can be any market with unusually small average true range values or just simply a market that does have a personality of a "sleeper". Tight Mode can be also used for aggresive entries in the most ridiculous trends. Sometimes price will barely pullback to the Trend Line not even the Stop Line.
2. Normal
Normal Mode is the golden mean between the modes. "Normal" provides the ideal ATR lengths for the most used markets such as S&P Futures (ES) or SPY, AAPL and plenty of other highly popular stocks. More often than not, the length of this mode is respected considering there is no breaking news or high impact market event scheduled.
3. Loose
The "Loose" mode is basically a normal mode but a little bit more loose. This mode is useful whenever the ATRs jump higher than usual or during the days of highly anticipated news events. This mode is also better suited for more active markets such as NQ futures.
4. FOMC
The FOMC mode is called FOMC for a reason. This mode provides the maximum amount of wiggle room between the price and the Stop Line. This mode was designed for the extreme volatility, breaking news events or post-FOMC trading. If the market quiets down, this mode will not get the Stop Line touch as frequently as othete modes, thus it is not very useful to run this on markets with the average volatlity. Although never properly tested, perhaps the FOMC mode can find its value in the crypto market?
5. The Net
The net mode is basically a combination of all modes into one stop line system which creates "the net" effect. The Net provides the widest Stop Line zone which can be mainly appreciated by traders that like to use scale-in scale-out methods for their trading. Not to mention the visual side of the indicator which looks pretty great with the net mode on.
HTF (Higher Time Frame) Trend System:
The system also includes additional higher time frame (HTF) trend system. This can be set to any time frame by manual HTF mode. HTF mode set to "auto" will automatically choose the best suitable higher time frame trend system based on how appropriate the aggregation is. For everything below 5min the HTF Trend System will stay on 5min. Anything between 5-15min = 30min. 30min - 120min will turn on the 240min. 180min and higher will result in Daily time frame. Anything above the Daily will result in Weekly HTF aggregation, above W = Monthly, above M = Quarterly.
Background Clouds:
In terms of visualization, each trend system is fully customizable through the inputs settings. There is also an option to turn on/off the background clouds behind the stop lines. These clouds can make the charts more clean & visible.
Tips & Tricks:
1. Different Trend Modes
Try out different modes in different markets. There is no one single mode that will fit to everyone on the same type of market. I myself actually prefer more Loose than the Normal.
2. Stop Line Mirroring
Whenever the Stop Lines start to mirror each other (there is one above the price and one below) this means the price is entering a ranging sideways market. It does not matter which Stop Line will the price touch first. They can both be faded until one of them flips.
3. Signs of the Ranging Market
Watch out for signs of ranging market. Whenever the Trend System looses its colors whether on trend line or trend bars, if everything turns neutral (gray) that is usually a solid indication of a range type action for the following moments. Also as already stated before, the Stop Line mirroring is a good sign of the range market.
4. Trailing Tool, Trend System as an Additional Study?
In case you are not a fan of the colorful green / red charts & candles. You can switch all of them off and just leave the Stop Line on. This way you can use the benefits of the trend system and still use other studies on top of that. Similarly as the Parabolic SAR is often used.
5. The Flip Setup
One of my favorite trades is the Flip Setup on the 5min charts. Whenever the Stop Line is broken , the very first opposing touch after the Trend System flips is a usually a highly participated touch. If there is a strong reaction, this means this is likely a beginning of a new trend. Once I am in the position i like to trail the Stop Line on the 1min charts.
Hope it helps.

BB_MDL_V1Simple indicator that is based on the average line of the bollinger bands and the exponential average of 200 periods.
The customizable variable is bollinger bands length, currently the default is 35, you can tweak it to your liking and see how trend identification changes.
My recommendation is to work in 5-minute time frames in values such as SOL, FTM or MASK (cryptos)
This simple strategy can be combined with many others to gain more insight and get better market entries and exits.

MTF Commodity Oddity Index (CCI+)MTF Commodity Oddity Index (CCI+)
This chart overlay indicator is based upon the Commodity Channel Index (CCI) and can signal multiple triple-timeframe CCI overbought and oversold confluences directly onto your chart, intended for use as a confluence either for reversal trade entries, or potential trade exits, indicating where price may be probable to reverse.
Features include:
- Primary set of fully configurable triple-timeframe overbought and oversold signals, indicating where 3 selected timeframes are all overbought or all oversold at the same time. Enabled by default.
- Secondary set of fully configurable triple-timeframe overbought and oversold signals, indicating where 3 selected timeframes are all overbought or all oversold at the same time. Enabled by default.
- Optional drawing of background colours and/or ribbon seen at bottom of the chart image.
- The default primary MTF #1 timeframes are set to 1 minute, 5 minute and 15 minute. These are highly suitable for low timeframe scalpers trading on < 5m charts, and can often pin point price reversals.
- The default Secondary MTF #2 timeframes are set to 15 minute, 30 minute and 120 minute. These are suitable for both low timeframe scalpers and considerably higher timeframe traders.
- Independent alerts for MTF #1 and MTF #2 triple-timeframe confluences, including options for alerting MTF overbought and MTF oversold individually, as well as an option for alerting either overbought or oversold in a single combined alert.
- Also includes standard configurable CCI options, including CC length and source type.
Note: The features listed above are accurate at the time of publishing but maybe updated or added to in future.
A similar MTF CCI indicator is also available as a panel indicator here .
This indicator is based upon the original MTF Fantastic Stochastic (FS+) available here .
What is the Commodity Channel Index (CCI)?
Investopedia has described the popular oscillator as follows:
“The Commodity Channel Index (CCI) is a momentum-based oscillator used to help determine when an investment vehicle is reaching a condition of being overbought or oversold.
Developed by Donald Lambert, this technical indicator assesses price trend direction and strength, allowing traders to determine if they want to enter or exit a trade, refrain from taking a trade, or add to an existing position. In this way, the indicator can be used to provide trade signals when it acts in a certain way.”
You can read more about the CCI , its use cases and calculations here .
How do traders use overbought and oversold levels in their trading?
The oversold level, that is traditionally when the CCI is above the 100 level is typically interpreted as being 'overbought', and below the -100 level is typically considered 'oversold'. Traders will often use the CCI at an overbought level as a confluence for entry into a short position, and the CCI at an oversold level as a confluence for an entry into a long position. These levels do not mean that price will necessarily reverse at those levels in a reliable way, however. This is why this version of the CCI employs the triple timeframe overbought and oversold confluence, in an attempt to add a more confluence and reliability to this usage of the CCI . While traditionally, the overbought and oversold levels are below -100 for oversold, and above 100 for overbought, the default threshold settings of this indicator have been increased to provide fewer, stronger signals, especially suited to the low timeframes and highly volatile assets.

Ultimate risk management toolHow to use:
Use the cursor to select the time, entry, stop loss, and target position. Then a window will pop up and type the trading fee or any other things you want to adjust to calculate the actual reward/risk ratio according to the price you selected.
Known error:
Settings of this script can't be saved as default might due to the interactive price selection function. If anyone knows how to fix it, please let me know.
feature:
1. Dynamic profit label can move up and down vertically on the right-hand side of the box.
2. The breakeven line can tell you you can move your stop loss to the entry price when the price reaches it.
3. Calculate the actual reward/risk ratio based on the trading fee. The calculator only calculates the actual Risk/Reward Ratio, which might be helpful for scalpers.
4. When the price touches sl or tp, that side of the box will be highlighted. Sometimes it doesn't work but I will try my best to fix it. Feel free to share your idea to help me to fix it.
5. Price alert. This tool compares with the alert function but reopens it if you want to change the alert price.

Elevated Leverage index System - ELiSELEVATED LEVERAGE index SYSTEM (ELiS) tries to solve the problem of adjusting meaningful leverage in futures and margin trading.
The biggest problem for traders is adjusting the leverage level manually.
Concerning about the volatilities it's very hard to set a meaningful leverage level.
ELiS includes 4 different volatility component which are:
1- nATR: Normalized Average True Range which is actually ATR/price to stabilize ATR's value differences when price changes are high on long term periods.
2- Standard Deviation
3- Kairi based nATR
4- Bollinger %B
which are scaled from 0 to 100 and takes different averages with different combinations & ratios and combines them as an index.
This index calculates an average volatility to set the true leverage level when trading futures especially in Crypto and FX markets.
There are 5 risk levels of "GEARS" like on automobiles to set the max leverage for risk management.
Gear 1 - CONSERVATIVE: max leverage level can be 20 for swing traders and beginners
Gear 2 - STANDARD: max leverage level can be 25 (default) for day traders
Gear 3 - AVERAGE: max leverage level can be 33 for day traders
Gear 4 - RISKY: max leverage level can be 50 for scalpers
Gear 5 - AGRESSIVE: max leverage level can be 100 for advanced scalpers
default length for ATR, Standard Deviation and %B are all 50
Simply:
When markets aren't volatile: ELiS indicateshigher leverage values to maximize profits.
When markets are volatile enough: ELiS indicates lower values to reduce risk level.
hope you all enjoy ELiS on profitable trades.

Distance From EMAThis indicator plots the distance in percent from price action to a moving average. Negative values mean that the price is below the moving average and positive values mean that the price is above the moving average. You can chose from EMA, MA, WMA, HMA for your input moving average. You can also change the period and source( open, close, high, low ). This is a useful tool for scalpers.

HLC Bollinger BandsThis is just a Bollinger band indicator that uses the highs & lows in addition to the close in the calculation of volatility / deviations from average. These bands will be slightly wider than regular Bollingers as a result.
I've found it useful with very short lookback lengths (3 to 5) for identifying periods when the bands are contracted... usually leads to an expansion of volatilty, so good for scalps.
Enjoy.

RSI: Evolved [DAFE]RSI: Evolved : The Ultimate Momentum Intelligence Engine
30+ RSI Engines. 15+ Zero-Lag Smoothers. The Revolutionary Quantum Horizon. This is Not Just an RSI. This is the Evolution of Momentum.
█ PHILOSOPHY: BEYOND THE OSCILLATOR, INTO THE NEXUS
The standard Relative Strength Index is a relic. It is a brilliant, timeless concept trapped in a rigid, one-dimensional formula developed in the 1970s. It assumes all market momentum is uniform, that all volatility is equal, and that a single mathematical lens is sufficient to view the infinitely complex character of modern markets. It is not.
RSI: Evolved was not created to be another RSI. It was engineered to be the definitive evolution of momentum analysis. This is not an indicator; it is a powerful, interactive research environment. It is a laboratory where you, the trader, can move beyond the static "one-size-fits-all" approach and forge a momentum oscillator that is perfectly adapted to the unique physics of your market, timeframe, and trading style.
This suite deconstructs the very DNA of the RSI, rebuilding it with a library of over 30 distinct, mathematically diverse calculation engines . From timeless classics and exotic variations to proprietary DAFE quantum models, this suite provides an unparalleled arsenal for quantifying the unseen forces of market momentum.
█ THE EVOLUTION: WHAT MAKES THIS UNLIKE ANY OTHER RSI?
This is not just a collection of features; it is a seamlessly integrated, multi-layered analytical system. It stands in a class of its own for several key reasons:
The 30+ Algorithm Core: At its heart is a library of over 30 unique RSI calculation engines. You can now choose an engine based on its mathematical properties—whether you need the zero-lag responsiveness of a Hull RSI, the time-warping capability of a Laguerre RSI, or the predictive power of a DAFE Quantum Fusion RSI.
Advanced Post-Processing: After the RSI is calculated, it passes through a multi-stage refinement process. First, choose from over 15+ professional-grade smoothing algorithms to create a crystal-clear signal. Then, activate the intelligent Filter Module to scale the RSI's output based on trend, volatility, or momentum regimes.
The Quantum Horizon & Temporal Wave: This is a revolutionary leap in data visualization. The indicator projects the historical momentum waves from higher timeframes directly onto your main price chart as a futuristic, holographic overlay. You can now see the alignment (or divergence) of macro momentum without ever looking away from price action. This is multi-timeframe analysis evolved into an art form.
Dynamic, Volatility-Adaptive Zones: Static 70/30 levels are obsolete. Evolved's "Quantum Zones" are alive; they "breathe" with market volatility. They automatically widen during powerful trends to keep you in a winning trade and tighten during choppy consolidation to help you catch reversals with greater precision.
Comprehensive Analytical Modules: This is a full suite of institutional-grade tools, including a powerful regular and hidden Divergence Engine , a multi-timeframe Consensus Dashboard , and dynamic RSI Bands (Bollinger, Keltner, etc.) plotted directly on the oscillator.
█ THE QUANTUM HORIZON & TEMPORAL WAVE: SEEING MOMENTUM IN 4D
This groundbreaking feature fundamentally changes how you interact with multi-timeframe momentum data. The Quantum Horizon is a dedicated visualization module that projects up to three "Temporal Waves" directly onto your main price chart. Each wave is a historical representation of a momentum oscillator (RSI, MFI, or Stoch RSI) pulled from a higher timeframe of your choice. Instead of flipping between charts or cluttering your screen with multiple indicators, you get an immediate, intuitive, and aesthetically stunning view of the market's complete momentum structure.
Each Temporal Wave is a self-contained universe, rendered as a glowing, flowing line within its own gridded channel. This channel is not just for show; it represents the 0-100 scale of the oscillator, with key 30, 50, and 70 levels marked for reference. You can see the history of momentum, its peaks, its troughs, and its crossovers with its own signal line. This allows you to visually identify macro divergences, trend alignment, and exhaustion points on your primary trading chart, transforming your analysis from a fragmented process into a single, unified experience. This is no longer just an indicator; it is a true Heads-Up Display for the flow of time and momentum.
█ THE ARSENAL: A DEEP DIVE INTO THE RSI & SMOOTHING ENGINES
This is your library of mathematical DNA. Understanding your tools is the first step to mastery. The 30+ RSI types are grouped into distinct families, each with a unique philosophy.
THE RSI ENGINE FAMILIES
The Classics (Wilder's, Cutler's, EMA, WMA): These are the foundational building blocks of momentum analysis. They provide a reliable, time-tested baseline. Wilder's uses the RMA for a unique smoothing characteristic, while Cutler's uses the SMA for a more direct, arithmetic average of gains and losses. The EMA and WMA versions offer increased responsiveness by weighting recent price action more heavily.
The Low-Lag Warriors (DEMA, TEMA, Hull, ZLEMA): This family is engineered specifically to combat the inherent lag of classical averages. The Double and Triple EMA (DEMA, TEMA) use a composite of multiple EMAs to reduce latency. The Zero-Lag EMA (ZLEMA) attempts to remove lag by adjusting the source price with its own past data. The Hull RSI is a standout, using a weighted moving average calculation to achieve a remarkable balance of extreme smoothness and near-zero lag, making it ideal for scalping.
The Exotics (Laguerre, Connors, Fisher, KAMA): These engines employ advanced mathematical concepts to view momentum through a different lens. The Laguerre RSI , based on John Ehlers' work, uses a time-warping, non-linear filter that can be extremely responsive to changes in trend. The Fisher Transform RSI normalizes the output to a Gaussian distribution, making peaks and troughs sharper and more defined for clearer signals. The KAMA Adaptive RSI is a "smart" algorithm that automatically slows its calculation in choppy markets and speeds it up in strong trends.
The Volume-Based (Volume-Weighted, MFI, VWAP-Weighted): This family infuses price momentum with volume data, providing a measure of conviction. They answer not just "how fast is price moving?" but "how much participation is behind the move?". The Money Flow RSI (MFI) is a classic, while the Volume-Weighted and VWAP-Weighted versions directly incorporate volume into the gain/loss calculation, giving more weight to high-volume bars.
The DAFE Proprietary Engines (The "God Mode" Algos): The crown jewels of the Laboratory, these are custom-built, proprietary algorithms you will not find anywhere else.
DAFE Quantum Fusion: This engine calculates RSI on three harmonic timeframes simultaneously (based on the Golden Ratio) and "superimposes" them using a dynamic weighting system based on volume and momentum confidence. It is the most robust and balanced all-rounder.
DAFE Kinetic Energy: Based on the physics principle that Momentum = Mass × Velocity. Standard RSI only sees Velocity (price change). Kinetic RSI weights every price move by Relative Volume (Mass), measuring the true "force" of the market.
DAFE Spectral: This engine uses concepts from Digital Signal Processing to analyze the frequency of price moves. It automatically differentiates between the "Signal" (the underlying trend) and the "Noise" (the chop), and adapts its calculation speed accordingly.
DAFE Entropy Flow: A unique engine that uses Information Theory to measure market "disorder." In chaotic, high-entropy markets, it automatically dampens its own signal to avoid whipsaws. In orderly, low-entropy trends, it sharpens its signal to be more responsive.
THE POST-SMOOTHING FILTERS
After your primary RSI is calculated, you can pass it through one of over 15 advanced filters for unparalleled clarity.
Low-Lag (Hull, DEMA, TEMA): Ideal for responsive smoothing that tracks the raw RSI closely.
Adaptive (KAMA, VIDYA): Perfect for smart, regime-aware smoothing that is slow in chop and fast in trends.
DSP & Scientific (SuperSmoother, Butterworth, Gaussian, Jurik-Style): The pinnacle of signal processing. These filters provide the absolute cleanest signal with minimal lag, leveraging advanced digital signal processing techniques to surgically remove noise.
█ THE ANALYTICAL MODULES: BEYOND THE LINE
Dynamic Zones: Your overbought/oversold levels (e.g., 70/30) are no longer static lines. They are living, breathing zones that respond to market volatility. They automatically widen during powerful, high-volatility trends to prevent you from selling a strong uptrend too early. Conversely, they tighten during low-volatility consolidation, allowing you to catch smaller, mean-reverting moves with greater precision. This is a crucial evolution for trading in modern, dynamic markets.
Divergence Engine: The automated engine works tirelessly in the background to detect critical disconnects between price and momentum. It automatically identifies and plots both Regular Divergences (which often signal major trend reversals) and Hidden Divergences (which often signal trend continuations after a pullback) with clear on-chart and in-pane markers and lines.
MTF Dashboard: Context is everything. This module provides an instant read on the momentum across three higher timeframes of your choice. The "Consensus" reading tells you if all timeframes are aligned ("ALL BULL" or "ALL BEAR"), providing powerful contextual confirmation for your trades and helping you avoid taking signals that go against the macro flow.
RSI Bands: This module applies a full-fledged band methodology (Bollinger Bands, Keltner Channels, etc.) directly to the RSI line itself. A pierce of the upper or lower band is a powerful sign of a statistical extreme, often preceding a sharp reversion back to the mean. A "squeeze" in the RSI bands often precedes an explosive move in momentum.
Signal Line & Histogram: The fast-moving RSI line is paired with a slower, smoother Signal Line of your choice. Crossovers between these two lines can be used as effective entry/exit triggers that are often more reliable than simple overbought/oversold levels. The histogram visually represents the momentum (the velocity and acceleration) of the RSI itself, turning from light to dark green in a strengthening uptrend, for example.
█ DEVELOPMENT PHILOSOPHY
RSI: Evolved was forged from a single, guiding principle: momentum is not a fixed property; it is a dynamic, multi-faceted force with a unique character in every market. This tool was designed for the trader who is no longer satisfied with a one-size-fits-all indicator. It is for the analyst, the tinkerer, the scientist—the individual who seeks to deconstruct, understand, and master the hidden physics of market momentum. This is a tool for forging your own alpha, not just following a lagging line.
RSI: Evolved is designed to give you that patience and discipline, providing a crystal-clear, multi-dimensional view of momentum so you can act with precision when the perfect setup finally arrives.
█ DISCLAIMER AND BEST PRACTICES
THIS IS AN ADVANCED ANALYTICAL TOOL: This indicator provides intelligence on momentum, not financial advice. It should be used as a core component of a complete trading strategy.
RISK MANAGEMENT IS PARAMOUNT: All trading involves substantial risk. Never risk more capital than you are prepared to lose.
START WITH A ROBUST BASE: The "DAFE Quantum Fusion" engine with the "SuperSmoother" is an exceptionally powerful and well-balanced starting point for most markets.
USE CONFLUENCE: The highest probability signals occur when multiple modules agree. For example: a Regular Bullish Divergence, as the RSI crosses up from an Extreme Oversold Dynamic Zone, while the Quantum Horizon shows the higher timeframes are also starting to turn up.
"The hard part is not making the decision to buy or sell, but having the patience and discipline to wait for the right setup."
— Mark Weinstein
Taking you to school. - Dskyz, Trade with Anticipation. Trade with Strength. Trade with RSI: Evolved

Smart Trader, Episode 04, by Ata Sabanci, Candles and Z ScoresSmart Trader, Episode 04
Candles and Z-Scores: A Statistical Approach to Market Analysis
━━━━━━━━━━━━━━━━━━━━━━━━━━━━━━━━━━━━━━━━━━━
OVERVIEW
This indicator applies Z-Score statistical analysis to measure how unusual current market conditions are compared to historical norms. It simultaneously analyzes five key metrics: Price, Total Volume, Buy Volume, Sell Volume, and Delta (Buy minus Sell) . The system detects 60 academically-researched market scenarios and provides visual feedback through Z-Lines (support/resistance levels), Event Markers, Trend Channels, and a comprehensive Dashboard.
━━━━━━━━━━━━━━━━━━━━━━━━━━━━━━━━━━━━━━━━━━━
CORE CONCEPT: WHY Z-SCORE?
A Z-Score measures how many standard deviations a value is from its mean. In financial markets, extreme Z-Scores indicate statistically rare events that often precede significant price movements.
Mathematical Formula:
Z = (Current Value - Mean) / Standard Deviation
Interpretation:
• Z ≥ +2.0: Extremely high (occurs approximately 2.5% of the time)
• Z ≥ +1.0: Above average
• Z ≈ 0: Normal (near the mean)
• Z ≤ -1.0: Below average
• Z ≤ -2.0: Extremely low (occurs approximately 2.5% of the time)
━━━━━━━━━━━━━━━━━━━━━━━━━━━━━━━━━━━━━━━━━━━
ACADEMIC FOUNDATION
This indicator is inspired by / grounded in market microstructure literature (abbreviated citations in-script) from market microstructure literature:
• Price-Volume Relationship - Karpoff (1987), Journal of Financial and Quantitative Analysis, Cambridge
Volume is positively correlated with price change magnitude
• Order Flow Imbalance - Cont, Kukanov, Stoikov (2014), Journal of Financial Econometrics
Order imbalance drives price more reliably than raw volume
• Informed Trading (PIN Model) - Easley, Kiefer, O'Hara, Paperman (1996), Journal of Finance
Buy/Sell imbalance reveals informed trader activity
• Mixture of Distributions - Tauchen & Pitts (1983), Clark (1973)
Volume clusters with volatility regimes
• Volume Predictability - Gervais, Kaniel, Mingelgrin (2001)
Volume shocks predict future returns
• Liquidity & Order Imbalance - Chordia, Roll, Subrahmanyam (2002)
Order imbalance affects short-term returns
• Volume-Return Dynamics - Llorente, Michaely, Saar, Wang (2002)
Speculation vs. risk-sharing patterns
• Reversal vs. Continuation - Campbell, Grossman, Wang (MIT)
High volume predicts lower autocorrelation
━━━━━━━━━━━━━━━━━━━━━━━━━━━━━━━━━━━━━━━━━━━
VOLUME ENGINE
The indicator offers two methods for decomposing total volume into Buy and Sell components:
Method 1: Geometry (Approximation)
Uses candle structure to estimate buying and selling pressure:
Buy Volume = Total Volume × (Close - Low) / (High - Low)
Sell Volume = Total Volume × (High - Close) / (High - Low)
• Works on all instruments without additional data requirements
• Fast calculation
• Less precise than intrabar method
Method 2: Intrabar (Precise)
Uses Lower Timeframe (LTF) tick/second data to aggregate actual up-ticks versus down-ticks:
• More accurate volume decomposition
• Requires LTF data availability
• Configurable LTF: 1T (tick), 1S, 15S, 1M
Delta Calculation:
Delta = Buy Volume - Sell Volume
━━━━━━━━━━━━━━━━━━━━━━━━━━━━━━━━━━━━━━━━━━━
Z-SCORE SYSTEM
The system calculates Z-Scores for five metrics simultaneously, using a configurable lookback period (default: 20 bars):
• Zp (Price Z-Score): Measures price deviation from its mean
• Zv (Volume Z-Score): Measures total volume deviation
• Zbuy (Buy Volume Z-Score): Measures buying pressure deviation
• Zsell (Sell Volume Z-Score): Measures selling pressure deviation
• ZΔ (Delta Z-Score): Measures order flow imbalance deviation
Threshold Constants:
• ZH (Z High) = 2.0: Extreme threshold
• ZM (Z Medium) = 1.0: Moderate threshold
• Z0 (Z Zero) = 0.5: Near-zero threshold
Group System:
The analysis window is divided into groups (default: 5 groups × 20 bars = 100 bar total window). Group numbers (1, 2, 3...) are displayed above candles when enabled, helping identify the relative age of detected levels.
━━━━━━━━━━━━━━━━━━━━━━━━━━━━━━━━━━━━━━━━━━━
Z-LINES (SUPPORT/RESISTANCE LEVELS)
When any metric reaches an extreme Z-Score, the system marks that price level as a significant support or resistance zone.
Detection Logic:
• Upper Z-Line: Drawn from the HIGH when Z ≥ upper threshold (default +2.0)
• Lower Z-Line: Drawn from the LOW when Z ≤ lower threshold (default -2.0)
Multi-Metric Detection:
Z-Lines can be triggered by any of the five metrics (Price, Volume, Buy, Sell, Delta). When multiple metrics trigger at similar price levels, they are clustered together into a single combined label showing all contributing metrics.
Persistence:
Z-Lines persist for the entire analysis window (Period × Groups bars) and are NOT removed when price touches them. This allows traders to see historical support/resistance levels that may still be relevant.
Anti-Overlap System:
Labels are automatically repositioned to prevent overlap. The "Label Min Gap (%)" setting controls minimum vertical separation between ALL labels (both upper and lower), ensuring readability even when multiple levels cluster together.
━━━━━━━━━━━━━━━━━━━━━━━━━━━━━━━━━━━━━━━━━━━
EVENT DETECTION ENGINE (60 SCENARIOS)
The system analyzes 60 distinct market scenarios based on Z-Score combinations. Each scenario is derived from academic research and assigned a confidence score based on signal strength and alignment.
Notation:
• Zp = Price Z-Score
• Zv = Total Volume Z-Score
• Zbuy = Buy Volume Z-Score
• Zsell = Sell Volume Z-Score
• ZΔ = Delta Z-Score
• dirP = Price direction (+1 if Zp > 0.5, -1 if Zp < -0.5, else 0)
• = Previous bar value
• ZH = 2.0 (High threshold)
• ZM = 1.0 (Medium threshold)
• Z0 = 0.5 (Zero threshold)
─────────────────────────────────────────────────────────────
CATEGORY A: PRICE-VOLUME (Events 1-10)
Based on: Karpoff (1987), Tauchen-Pitts (1983), Clark (1973)
─────────────────────────────────────────────────────────────
Event 1: Breakout Confirmed
|Zp| ≥ ZH AND Zv ≥ ZH AND sign(ZΔ) = dirP AND dirP ≠ 0
Direction: Bullish/Bearish (follows price direction)
Event 2: Trend Strength Confirmed
|Zp| ≥ ZH AND Zv ≥ ZH
Direction: Follows price direction
Event 3: Fragile Move
|Zp| ≥ ZH AND Zv ≤ -ZM
Direction: Warning (price move without volume support)
Event 4: Weak Rally
Zp ≥ ZH AND Zv ≤ -ZH
Direction: Warning (price up without volume)
Event 5: Weak Selloff
Zp ≤ -ZH AND Zv ≤ -ZH
Direction: Warning (price down without volume)
Event 6: Momentum Build
ZM ≤ |Zp| < ZH AND Zv ≥ ZH
Direction: Follows price direction
Event 7: Churn
|Zp| ≤ Z0 AND Zv ≥ ZH
Direction: Neutral (high volume, low price movement)
Event 8: Quiet Compression
|Zp| ≤ Z0 AND Zv ≤ -ZH
Direction: Neutral (low volume, low price movement)
Event 9: High Volume Regime
Zv ≥ ZH
Direction: Neutral
Event 10: Low Volume Regime
Zv ≤ -ZH
Direction: Neutral
─────────────────────────────────────────────────────────────
CATEGORY B: ORDER-FLOW / DELTA (Events 11-16)
Based on: Cont, Kukanov, Stoikov (2014), Easley, Kiefer, O'Hara, Paperman (1996)
─────────────────────────────────────────────────────────────
Event 11: Imbalance Drives Price
|ZΔ| ≥ ZH AND sign(ZΔ) = dirP AND dirP ≠ 0
Direction: Follows price direction (dirP), with delta alignment required
Event 12: Divergence Top
Zp ≥ ZH AND ZΔ ≤ -ZH
Direction: Warning (distribution at top)
Event 13: Divergence Bottom
Zp ≤ -ZH AND ZΔ ≥ ZH
Direction: Warning (accumulation at bottom)
Event 14: Absorption Positive
|Zp| ≤ Z0 AND Zv ≥ ZH AND ZΔ ≥ ZH
Direction: Bullish (buy absorption, support forming)
Event 15: Absorption Negative
|Zp| ≤ Z0 AND Zv ≥ ZH AND ZΔ ≤ -ZH
Direction: Bearish (sell absorption, resistance forming)
Event 16: Depth Wall
Zv ≥ ZH AND |ZΔ| ≥ ZH AND |Zp| ≤ Z0
Direction: Neutral (market depth absorbing)
─────────────────────────────────────────────────────────────
CATEGORY C: BUY VS SELL (Events 17-23)
Based on: Easley, Kiefer, O'Hara, Paperman (1996), Chordia, Roll, Subrahmanyam (2002)
─────────────────────────────────────────────────────────────
Event 17: Aggressive Buy Dominance
Zbuy ≥ ZH AND ZΔ ≥ ZH AND Zsell ≤ -ZM
Direction: Bullish
Event 18: Aggressive Sell Dominance
Zsell ≥ ZH AND ZΔ ≤ -ZH AND Zbuy ≤ -ZM
Direction: Bearish
Event 19: Two-Sided Battle
Zbuy ≥ ZH AND Zsell ≥ ZH AND |ZΔ| ≤ Z0
Direction: Neutral (buyers and sellers equally strong)
Event 20: Battle with Buy Edge
Zbuy ≥ ZH AND Zsell ≥ ZH AND ZM ≤ ZΔ < ZH
Direction: Bullish
Event 21: Battle with Sell Edge
Zbuy ≥ ZH AND Zsell ≥ ZH AND -ZH < ZΔ ≤ -ZM
Direction: Bearish
Event 22: Hidden Accumulation
Zbuy ≥ ZH AND |Zp| ≤ Z0 AND Zv ≥ ZH
Direction: Bullish (buy shock without price movement)
Event 23: Hidden Distribution
Zsell ≥ ZH AND |Zp| ≤ Z0 AND Zv ≥ ZH
Direction: Bearish (sell shock without price movement)
─────────────────────────────────────────────────────────────
CATEGORY D: PREDICTABILITY (Events 24-26)
Based on: Gervais, Kaniel, Mingelgrin (2001), Karpoff (1987)
─────────────────────────────────────────────────────────────
Event 24: Volume Shock Positive Drift
Zv ≥ ZH AND |Zp| ≤ ZM
Direction: Follows price direction
Event 25: Volume Shock Negative Drift
Zv ≤ -ZH AND |Zp| ≤ ZM
Direction: Opposite to price direction
Event 26: Abnormal Volume Info Arrival
Zv ≥ ZH
Direction: Neutral
─────────────────────────────────────────────────────────────
CATEGORY E: REVERSAL VS CONTINUATION (Events 27-30)
Based on: Campbell, Grossman, Wang (MIT), Llorente, Michaely, Saar, Wang (2002)
─────────────────────────────────────────────────────────────
Event 27: High Vol Reversal Risk
Zv ≥ ZH
Direction: Warning (high volume implies lower positive autocorrelation)
Event 28: Low Vol Continuation Risk
Zv ≤ -ZH
Direction: Follows price direction (trend likely continues)
Event 29: Speculation Continuation
Zv ≥ ZH AND |ZΔ| ≥ ZM AND sign(ZΔ) = dirP AND dirP ≠ 0
Direction: Follows price direction
Event 30: Risk Sharing Reversal
Zv ≥ ZH AND |ZΔ| ≤ Z0
Direction: Warning (potential reversal)
─────────────────────────────────────────────────────────────
CATEGORY F: IMBALANCE LAG (Events 31-33)
Based on: Chordia, Roll, Subrahmanyam (2002)
─────────────────────────────────────────────────────────────
Event 31: Persistent Imbalance Push
|ZΔ| ≥ ZM AND |ZΔ | ≥ ZM AND sign(ZΔ) = sign(ZΔ )
Direction: Follows delta direction (persistent pressure)
Event 32: Imbalance Pressure Decay
(ZΔ ≥ ZM AND ZΔ ≤ -ZM) OR (ZΔ ≤ -ZM AND ZΔ ≥ ZM)
Direction: Warning (imbalance sign flip)
Event 33: Intraday Imbalance Predicts
|ZΔ| ≥ ZM
Direction: Follows delta direction
─────────────────────────────────────────────────────────────
CATEGORY G: SUPPORT/RESISTANCE (Events 34-36)
Based on: Peskir (Manchester)
─────────────────────────────────────────────────────────────
Event 34: SR Barrier Event
|Zp| ≤ Z0 AND Zv ≥ ZH
Direction: Neutral (price stalls with high volume)
Event 35: Volume Backed SR Level
|Zp| ≤ Z0 AND Zv ≥ ZH AND |ZΔ| ≥ ZM
Direction: Follows delta direction
Event 36: Volume Poor SR Level
|Zp| ≤ Z0 AND Zv ≤ -ZM
Direction: Warning (weak S/R without volume)
─────────────────────────────────────────────────────────────
CATEGORY H: EXTENDED ANALYSIS (Events 37-50)
Based on: Extended market microstructure analysis
─────────────────────────────────────────────────────────────
Event 37: Climax Buy
Zbuy ≥ ZH AND Zp ≥ ZH AND Zv ≥ ZH
Direction: Warning (extreme buying exhaustion, potential top)
Event 38: Climax Sell
Zsell ≥ ZH AND Zp ≤ -ZH AND Zv ≥ ZH
Direction: Warning (extreme selling exhaustion, potential bottom)
Event 39: Stealth Accumulation
Zbuy ≥ ZM AND |Zp| ≤ Z0 AND Zv ≤ Z0
Direction: Bullish (quiet buying)
Event 40: Stealth Distribution
Zsell ≥ ZM AND |Zp| ≤ Z0 AND Zv ≤ Z0
Direction: Bearish (quiet selling)
Event 41: Volume Divergence Bull
Zp ≤ -ZM AND Zv ≤ -ZM
Direction: Bullish (price down but volume declining)
Event 42: Volume Divergence Bear
Zp ≥ ZM AND Zv ≤ -ZM
Direction: Bearish (price up but volume declining)
Event 43: Delta Price Alignment
|Zp| ≥ ZM AND |ZΔ| ≥ ZM AND sign(Zp) = sign(ZΔ)
Direction: Follows price direction (strong trend confirmation)
Event 44: Extreme Compression
|Zp| ≤ Z0 AND Zv ≤ -ZH
Direction: Neutral (very low volatility)
Event 45: Volatility Expansion
|Zp| ≥ ZH AND Zv ≥ ZH
Direction: Follows price direction (breakout from compression)
Event 46: Buy Exhaustion
Zbuy ≥ ZH AND Zp ≤ Z0
Direction: Warning (high buy but price fails)
Event 47: Sell Exhaustion
Zsell ≥ ZH AND Zp ≥ -Z0
Direction: Warning (high sell but price holds)
Event 48: Trend Acceleration
|Zp| ≥ ZM AND |Zp| > |Zp | AND Zv ≥ ZM
Direction: Follows price direction (increasing momentum)
Event 49: Trend Deceleration
|Zp| ≥ ZM AND |Zp| < |Zp | AND sign(Zp) = sign(Zp )
Direction: Warning (decreasing momentum)
Event 50: Multi Divergence
(Zp ≥ ZM AND ZΔ ≤ -ZM) OR (Zp ≤ -ZM AND ZΔ ≥ ZM) + |Zp| ≥ ZM AND Zv ≤ -ZM
Direction: Warning (multiple divergence signals)
─────────────────────────────────────────────────────────────
CATEGORY I: TREND-INTEGRATED (Events 51-60)
Based on: Combined price-volume-delta trend analysis
─────────────────────────────────────────────────────────────
Event 51: Trend Breakout Confirmed
|Zp| ≥ ZH AND Zv ≥ ZH AND |ZΔ| ≥ ZM AND sign(ZΔ) = dirP AND dirP ≠ 0
Direction: Follows price direction
Event 52: Trend Support Test
Zp ≥ ZM AND Z0 ≤ Zp < ZM AND ZΔ ≥ Z0
Direction: Bullish (pullback in uptrend)
Event 53: Trend Resistance Test
Zp ≤ -ZM AND -ZM < Zp ≤ -Z0 AND ZΔ ≤ -Z0
Direction: Bearish (rally in downtrend)
Event 54: Trend Reversal Signal
sign(Zp) ≠ sign(Zp ) AND |Zp| ≥ ZM AND |Zp | ≥ ZM
Direction: Follows new price direction (momentum flip)
Event 55: Channel Absorption
|Zp| ≤ Z0 AND Zv ≥ ZH
Direction: Neutral (range-bound with volume)
Event 56: Trend Continuation Volume
|Zp| ≥ ZM AND Zv ≥ ZM AND sign(ZΔ) = dirP AND dirP ≠ 0
Direction: Follows price direction (healthy trend with volume)
Event 57: Trend Exhaustion
|Zp| ≥ ZM AND Zv ≤ -ZM AND |Zp| < |Zp |
Direction: Warning (trend losing steam)
Event 58: Range Breakout Pending
|Zp| ≤ Z0 AND Zv ≤ -ZH AND |ZΔ| ≥ ZM
Direction: Follows delta direction (compression with imbalance)
Event 59: Trend Quality High
|Zp| ≥ ZM AND sign(ZΔ) = dirP AND Zv ≥ Z0 AND dirP ≠ 0
Direction: Follows price direction (strong aligned signals)
Event 60: Trend Quality Low
|Zp| ≥ ZM AND sign(ZΔ) ≠ dirP AND dirP ≠ 0
Direction: Warning (conflicting signals)
━━━━━━━━━━━━━━━━━━━━━━━━━━━━━━━━━━━━━━━━━━━
TREND CHANNEL SYSTEM
The trend channel system is adapted from Smart Trader Episode 03 to provide consistent visual context for price action analysis.
How It Works:
• Divides the chart into blocks based on Z-Score groups
• Calculates OHLC (Open, High, Low, Close) for each block
• Detects Higher Highs/Higher Lows (uptrend) or Lower Highs/Lower Lows (downtrend) patterns
• Draws channel lines connecting block extremes
• Classifies by angle: steep angles indicate trends, flat angles indicate ranges
Channel Classifications:
• UPTREND: Higher highs and higher lows detected
• DOWNTREND: Lower highs and lower lows detected
• RANGE: Channel angle below threshold (default 10 degrees)
Label Information:
• Trend direction (UPTREND/DOWNTREND/RANGE)
• Channel boundary prices
• Distance from current price (absolute and percentage)
• Channel angle in degrees
━━━━━━━━━━━━━━━━━━━━━━━━━━━━━━━━━━━━━━━━━━━
DASHBOARD
The dashboard provides a comprehensive real-time view of all Z-Score metrics and detected events.
Dashboard Sections:
1. Header Row
Displays indicator name and current calculation mode (CLOSED or LIVE).
2. Metric Rows (Price, Total Volume, Buy Volume, Sell Volume, Delta)
Each row displays:
• Value: Current metric value
• Z: Calculated Z-Score
• Visual: Graphical Z-bar showing position relative to mean
• Status: Interpretation (Extreme High, Above Avg, Normal, Below Avg, Extreme Low)
• Upper: Oldest active upper Z-Line in window (Label Mirror)
• Lower: Oldest active lower Z-Line in window (Label Mirror)
3. Event Detection Section
• Count of triggered events out of 60 total scenarios
• Market Bias: Bull/Bear/Neutral percentage with visual bar
• Strongest Event: Highest confidence event currently triggered
• #2 Event: Second highest confidence event
4. Footer
Shows engine type (Geometry/Intrabar), Z-Score period, calculation basis, and number of valid bars.
━━━━━━━━━━━━━━━━━━━━━━━━━━━━━━━━━━━━━━━━━━━
ALERT SYSTEM
The indicator uses native alertcondition() functions, keeping the settings menu clean while providing comprehensive alert options in TradingView's alert dialog.
Available Alert Categories:
• Master Alerts: Any event, Any bullish, Any bearish, Any warning
• Single Event Alerts: Individual alerts for key events (Breakout, Climax, Divergence, etc.)
• Category Alerts: Alerts by event category (Price-Volume, Order-Flow, etc.)
• Confluence Alerts: 2+, 3+, 4+, or 5+ aligned events
• Bias Shift Alerts: 10%, 20%, or 30% shifts in market bias
• High Confidence Alerts: Events with 60%+, 70%+, 80%+, or 90%+ confidence
• Divergence Alerts: Price vs Volume or Price vs Delta divergences
━━━━━━━━━━━━━━━━━━━━━━━━━━━━━━━━━━━━━━━━━━━
DATA ACCURACY AND LIMITATIONS
This indicator is 100% VOLUME-BASED and requires Lower Timeframe (LTF) intrabar data for accurate calculations when using the Intrabar method.
Data Accuracy Levels:
• 1T (Tick): Most accurate, real volume distribution per tick
• 1S (1 Second): Reasonably accurate approximation
• 15S (15 Seconds): Good approximation, longer historical data available
• 1M (1 Minute): Rough approximation, maximum historical data range
Backtest and Replay Limitations:
• Replay mode results may differ from live trading due to data availability
• For longer backtest periods, use higher LTF settings (15S or 1M)
• Not all symbols/exchanges support tick-level data
• Crypto and Forex typically have better LTF data availability than stocks
A Note on Data Access:
Higher TradingView plans provide access to more historical intrabar data, which directly impacts the accuracy of volume-based calculations. More precise volume data leads to more reliable calculations.
━━━━━━━━━━━━━━━━━━━━━━━━━━━━━━━━━━━━━━━━━━━
LANGUAGE SUPPORT (TRI-LINGUAL UI)
This indicator includes a built-in language switch with three interface languages :
• English (EN)
• Türkçe (TR)
• 한국어 (KO)
The selected language updates key interface text such as the Dashboard headers/rows , tooltips , and the Event Engine outputs (event names, category names, and direction labels). Turkish diacritics and Korean Hangul are supported for clean, native readability.
Why only three languages?
Each additional language requires duplicating strings throughout the code, which increases script size/memory usage and compilation time. To keep the indicator optimized and responsive, language options are intentionally limited to three.
━━━━━━━━━━━━━━━━━━━━━━━━━━━━━━━━━━━━━━━━━━━
⚠️ DISCLAIMER
FOR EDUCATIONAL AND RESEARCH PURPOSES ONLY
This indicator is designed as an educational and research tool based on academic market microstructure literature. It is NOT financial advice and should NOT be used as the sole basis for trading decisions.
Important Notices:
• Past performance does not guarantee future results
• All trading involves risk of substantial loss
• The indicator's signals are statistical probabilities, not certainties
• Always conduct your own research and consult qualified financial advisors
• The creator assumes no responsibility for trading losses
Research Sources:
This indicator is built upon peer-reviewed academic research from:
• Journal of Financial and Quantitative Analysis (Cambridge University Press)
• Journal of Finance
• Journal of Financial Econometrics
• MIT Working Papers
• arXiv Financial Mathematics

[LJ] HTF Candles with Volume POC [Highly Optimized]Welcome to the ultimate Higher Timeframe (HTF) fusion tool.
This indicator seamlessly merges Higher Timeframe price action with precise volume profiling on Lower Timeframe (LTF) charts. By utilizing advanced array memory management, it bypasses TradingView's drawing limits to render clean HTF candle boxes and their exact Volume Point of Control (POC), ensuring peak performance and accuracy even on extreme timeframe combinations.
🔎 Visual Guide: What's on Your Chart?
The Big Boxes (Wick & Body): These represent the Open, High, Low, and Close of your selected Higher Timeframe (e.g., a 1-Hour candle projected onto your 5-Minute chart). Color-coded for bullish/bearish momentum.
The Midline: A horizontal line dividing the HTF candle perfectly in half. Useful for gauging if LTF price is in a "premium" or "discount" zone relative to the HTF.
The Yellow Box (The POC): This is the Point of Control. When an HTF candle closes, this yellow box locks in place, showing the exact price zone that saw the highest volume accumulation during that period, calculated using precise LTF hlc3 price data.
⚙️ Key Settings & Configuration
To get the most out of this indicator, check these inputs in the settings menu:
Box Time Interval: Set this to your desired HTF (e.g., "1H", "4H", "D").
Tip: A good rule of thumb is an HTF that is 5x to 12x higher than your current chart.
POC Resolution (Levels): This is your fine-tuning dial.
Set to 50 - 100: Creates a very thin, precise POC line. Great for exact support/resistance levels.
Set to 15 - 35: Creates a thicker POC "Zone". Great for capturing broader areas of high liquidity.
Max Historical Boxes: Controls how far back the indicator draws. Keep this at 50 for a clean chart and fast loading times.
📈 Trading Strategies: How to Trade the HTF POC
1. The "Magnet" Mean Reversion High volume nodes (POCs) act as price magnets. If the current LTF price is far away from the previous HTF candle's POC, look for setups that trade back toward that yellow box.
2. The Break & Retest The POC box acts as a heavy Support/Resistance wall. If price breaks through the yellow POC box with strong momentum, look to enter on the retest of that box in the direction of the breakout.
3. Trend Continuation In a strong uptrend, look for the current LTF price to bounce off the Midline or the previous candle's POC to join the dominant HTF trend.
⚡ Performance Note
This indicator uses advanced Pine Script Array Management. Unlike standard volume profile scripts that crash when calculating big timeframes, this indicator guarantees zero lag and no disappearing boxes, even when looking at a Daily HTF on a 1-Minute chart.
🙏 Credits
This is a refactored and heavily optimized fusion of two great concepts:
Original HTF Box logic by © krollo041
Original Volume Thermometer concept by © ChartPrime
Merged, debugged, and optimized for v6 Array Management by ©Luki_eR
Disclaimer: This script is for educational and informational purposes only and does not constitute financial advice.

Bulkowski Breakout vPRO (5m) - Runtime FixedHere is the English translation of your strategy guide, tailored for international traders while maintaining your encouraging tone.Strategy Guide: Bulkowski Breakout vPROFor Aspiring "Golden Traders"This strategy is designed for beginners to trade with the "flow of power." In short, it is a momentum-following strategy that enters a trade when a strong price move (Long Body Candle + High Volume) breaks through a key psychological level (200 EMA).1. Core Concept: "The High-Energy Breakout"Based on the principles of Thomas Bulkowski, a legendary master of chart patterns, this strategy prioritizes high-energy moves over simple price touches. A signal (LONG or SHORT) is only generated when these three conditions align:200 EMA Break (The Baseline): The 200-period Exponential Moving Average is the "life-line" of the market. Price breaking above this line indicates a powerful shift from a bearish to a bullish trend.Long Body Candle (Volatility): The candle body must be at least 2x larger than the recent average. This serves as evidence of institutional or "whale" buying/selling.Volume Surge (Reliability): Trading volume at the moment of breakout must be 1.5x higher than the recent average. This confirms the move is genuine and not a "fake-out."2. Session Filter (Optimized for Peak Volatility)To avoid "choppy" sideways markets, this strategy only operates during the first two hours of the major global market opens, when liquidity is at its highest.MarketTime (KST / UTC+9)Market CharacteristicsAsia Session09:00 ~ 11:00Opening of Korean, Japanese, and Chinese markets.Europe Session16:00 ~ 18:00Volatility spikes as the London market opens.US Session22:00 ~ 24:00Peak global liquidity as New York opens.Signals only appear when the chart background is shaded blue. All other times are "resting periods" to protect your capital.3. Execution GuideEntryLONG (Buy): Enter when a large green candle breaks above the yellow 200 EMA with high volume. (Green triangle label appears).SHORT (Sell): Enter when a large red candle breaks below the yellow 200 EMA with high volume. (Red triangle label appears).Take Profit (TP) & Stop Loss (SL)Lines are automatically drawn on your chart once you enter:Orange Line (Stop Loss): Automatically set at the low (or high) of the last 3 candles. If the price touches this, the trade closes to prevent further loss.Green Line (Take Profit): Automatically set at 1.5x your risk. This ensures a healthy 1:1.5 Risk-to-Reward ratio.4. Pro-Tips for BeginnersOptimized for 5m: This strategy works best on the 5-minute (5m) timeframe. 1m is often too noisy, and 15m can be too slow for scalping.Watch Bitcoin: Even if an altcoin gives a LONG signal, be cautious if Bitcoin is currently crashing. BTC dictates the overall market direction.Adjusting Sensitivity: If signals are too rare, go to "Settings" and lower the Long Body Multiplier from 2.0 to 1.5.This indicator is built to help you trade based on statistical advantages, not emotions. We strongly recommend practicing with Paper Trading first to get a feel for the signals.To everyone dreaming of becoming a Golden Trader—Success is a marathon, not a sprint!

EMA Combo BKEMA Combo – Multi-Timeframe Trend & Momentum Indicator
EMA Combo is a clean and efficient multi-Exponential Moving Average (EMA) indicator designed to help traders quickly identify trend direction, momentum strength, and dynamic support/resistance zones across all timeframes.
This indicator plots a structured set of five EMAs (10, 20, 50, 100, 200) on the price chart, with intelligent default visibility to keep the chart uncluttered while still allowing deeper analysis when needed.
⸻
Default EMA Structure
By default, the indicator displays only the two most actionable EMAs:
• EMA 20 (Blue) – Short-term momentum EMA
• EMA 50 (Red) – Core trend EMA
The following EMAs are hidden by default and can be enabled manually from the indicator settings:
• EMA 10 (Teal) – Ultra-fast EMA for scalping and very short-term momentum
• EMA 100 (Purple) – Medium-term trend filter
• EMA 200 (Orange) – Long-term trend and institutional bias EMA
This default visibility ensures a clean chart for day trading, while still supporting swing and positional analysis when required.
⸻
How to Use the Indicator
1. Trend Identification
• Price above EMA 50 & EMA 200 → Bullish market structure
• Price below EMA 50 & EMA 200 → Bearish market structure
• EMA 20 above EMA 50 → Short-term bullish momentum
• EMA 20 below EMA 50 → Short-term bearish momentum
⸻
2. Momentum & Pullback Trading
• In strong trends, price often pulls back to EMA 20 or EMA 50 before continuing
• EMA 20 acts as a dynamic momentum line
• EMA 50 acts as a trend support / resistance zone
⸻
3. Scalping & Short-Term Trading (EMA 10)
• Enable EMA 10 for:
• High-frequency scalping
• Momentum bursts
• Early trend acceleration
• Best used on lower timeframes (1m–5m)
⸻
4. Swing & Positional Trading (EMA 100 & 200)
• EMA 100 helps filter mid-term trend strength
• EMA 200 defines:
• Institutional bias
• Long-term support & resistance
• Bull vs Bear market zones
A market is considered structurally strong when:
EMA 20 > EMA 50 > EMA 100 > EMA 200

Crypto RSI AdvancedThe Crypto RSI Advanced Indicator: A Multi-Dimensional Market Assessment Tool
This document outlines the unique features, functionality, implementation, and theoretical foundation of the "Crypto RSI Advanced" indicator. It is designed to be far more than a simple oscillator; it is a comprehensive analytical suite that enhances the classic Relative Strength Index (RSI) by incorporating trend-filtered signals, visual context, and real-time market state diagnostics.
Core Originality & Unique Value Proposition
The primary innovation of this script lies in its multi-layered, context-aware approach to momentum analysis. While traditional RSI indicators often generate signals based solely on crossing static levels (like 30/70), leading to false signals in strong trends, this script synthesizes four critical dimensions of information:
Momentum Value: The raw RSI reading.
Momentum Trend: The direction of the RSI itself, determined by its short-term trajectory.
Zone Persistence: Whether the RSI is coming from an overbought/oversold condition, adding conviction to breakouts.
Integrated Signal Confirmation: The use of a smoothed signal line (EMA of RSI) for additional validation.
This synthesis transforms the RSI from a standalone oscillator into a cohesive trading system framework that helps distinguish between potential reversal points and mere pauses within a strong trend.
What It Does & How It Achieves It
The indicator performs several interconnected functions, presented in a single pane below the price chart:
Enhanced RSI & Signal Line Plotting:
It calculates the standard RSI based on a user-defined source and length.
It plots a smoothed Signal Line (an EMA applied to the RSI values), which acts as a dynamic filter. Crosses between the RSI and this signal line can provide earlier or more refined entry clues than static level crosses alone.
Dynamic Visual Context and Alerts:
Colored Background Bands: The plot area is dynamically shaded to visually telegraph the market state at a glance: blue for oversold, orange for overbought, and white for the neutral zone.
Conditional RSI Line Coloring: The RSI line itself changes color based on its zone and position relative to the 50 mid-line, providing instant visual feedback on momentum strength and bias.
Multi-Tiered Signal Detection: The script identifies four distinct signal types:
Buy/Sell Signal: Triggered when the RSI crosses back inside the oversold/overbought band from an extreme. This aims to catch early reversals as momentum exits an extreme state.
Strong Buy/Strong Sell Signal: A higher-conviction signal triggered when the RSI crosses the oversold/overbought level from within the extreme zone. This suggests a more powerful shift in momentum as the market exits a deeply overextended condition.
Integrated Market Intelligence Panel:
A key original feature is the fixed information table in the top-right corner. This panel synthesizes all calculations into a concise, actionable snapshot for the latest bar, including:
Current precise RSI value.
Market State (e.g., Overbought, Bullish Bias, Neutral).
RSI Trend (Rising, Falling, Consolidating), assessing the oscillator's own momentum.
Active Signal Status (e.g., "Strong Buy", "No Signal").
Zone Intensity (e.g., "Extreme Overbought", "Normal").
Clear Level Annotation:
On the final bar, it draws labeled markers at the key levels (Oversold, Mid, Overbought) for a clean and permanent reference on the chart.
How to Use It
Application: This tool is designed for momentum confirmation, divergence spotting, and identifying potential reversal zones within a broader trend context. It is particularly useful for swing traders and position traders looking for higher-probability entry points, rather than for pure, high-frequency scalping.
Usage Guidelines:
Parameter Setup: Adjust the core RSI Length and Signal Length to match the volatility of your asset and trading timeframe. The default (14, 9) offers a balanced approach.
Signal Hierarchy: Prioritize "Strong" signals over regular signals, as they carry the added context of a zone breakout. A "Strong Buy" signal appearing in an overall uptrend on the higher timeframe presents a high-conviction scenario.
Synthesize Information: Do not trade on signals alone. Use the Information Panel for context. For example, a "Buy Signal" occurring while the panel shows "Market State: Oversold" and "RSI Trend: Rising" offers a congruent, multi-factor setup.
Visual Context: Use the colored bands and line colors for quick assessment. A blue (bullish) RSI line forming in the blue (oversold) shaded area provides immediate visual congruence for a potential long setup.
Confirmation: As with any oscillator, use this tool in conjunction with price action analysis (support/resistance, chart patterns) and other non-correlated indicators (e.g., a trend-following indicator like a moving average) to filter trades and avoid whipsaws in ranging markets.
Underlying Computational Philosophy
The script's logic is built upon the principle of "Contextual Momentum Analysis." The core premise is that the absolute value of the RSI is less important than its behavior relative to its recent state and trajectory.
Trend-Filtered Momentum: By analyzing the RSI's own trend (rsi_trend_up/down), the script introduces a crucial filter. A sell signal occurring while the RSI's internal trend is still rising may be less reliable, warning of a potential false signal.
Zone-Based Conviction: The distinction between a regular and a "Strong" signal is philosophically significant. It applies the concept of "impulse from an extreme." A reversal signal that originates from deep inside an extreme zone is considered to have more kinetic energy (conviction) than one that forms near the boundary.
Synthesis Over Isolation: The script deliberately avoids providing a single "answer." Instead, it presents multiple, simultaneous data points (value, trend, zone, signal line interaction, historical state) and presents them together in the information panel. This empowers the trader to make a reasoned decision based on a confluence of factors, mimicking the analytical process of a seasoned chartist.
In essence, this indicator automates and visualizes a sophisticated, multi-step analytical process that a trader would otherwise have to perform manually, thereby enhancing speed, consistency, and depth of market analysis.

Optimal Day Trading System🚥 How to Trade with ODTS
The indicator provides visual cues on the chart (triangles) and a real-time Status Table to help you make decisions.
Signal Definitions
Buy Signal (Green Triangle): Price is above the Sunya line and the Primary Cycle is trending up.
Strong Buy (Lime Triangle): All criteria are met, plus the Secondary Cycle has also turned bullish. This indicates "confluence".
Sell Signal (Red Triangle): Price is below the Sunya line and the Primary Cycle is trending down.
Strong Sell (Maroon Triangle): Both Primary and Secondary cycles are aligned with a price break below the Sunya line.
Real-Time Status Table
Located at the top right, this table gives you an instant "health check" of the current asset:
Price > Sunya: Confirms if the current price is above or below the FLD.
Cycle Dir: Shows the slope of the primary trend.
Position: Tells you if price is "Inside" the envelope (ranging) or "Above/Below" (overextended).
📈 Best Practices
Confluence is Key: The strongest trades occur when the Signal column in the table shows "STRONG BUY" or "STRONG SELL," meaning multiple cycles are in agreement.
Envelope Extremes: If the Status Table shows the Position as "ABOVE" or "BELOW" the envelope, be cautious about entering new trades, as the price may be overextended and due for a reversion to the Basis (mean).
Timeframe Synergy: Use the 15-minute timeframe for swing trade entries and the 1-minute or 5-minute for precise day trading executions.

Ripster EMA Clouds with MTFCredits & Origins:
This script is a modification of the widely popular EMA Clouds system originally created by @Ripster47. Full credit goes to him for the strategy and original concept. This version simply adds a quality-of-life feature for traders who use multi-timeframe analysis.
What is this Indicator?
The Ripster EMA Clouds system uses overlapping Exponential Moving Averages (EMAs) to visualize trends, momentum, and dynamic support/resistance zones. The "clouds" differ in color to indicate bullish or bearish trends, acting as a visual guide for keeping you on the right side of the trade.
What is New in This Version? (MTF Capability)
The standard version of this indicator calculates EMAs based on your current chart timeframe. If you switch from a 10-minute chart to a 1-minute chart, the clouds change completely.
I have added a "Fixed Timeframe" variable/input that allows you to "lock" the clouds to a specific timeframe, regardless of what chart you are viewing.
Why is this useful? This allows for true Multi-Timeframe (MTF) scalping.
Example: You can set the clouds to look at the 10-minute trend (identifying major support levels) but execute your entries on a 1-minute chart.
The clouds will remain locked to the 10-minute data, giving you the "big picture" view while you trade the micro-movements.
How to Use
Open the indicator settings.
Go to the Inputs tab.
Find the "Fixed Timeframe" option at the top.
Leave Empty (Default): The indicator behaves exactly like the original (adjusts to your chart).
Select a Timeframe (e.g., 10 Minutes): The clouds will lock to the 10-minute EMAs, even if you switch your chart to 1-minute or 5-seconds.
Note on Visuals When viewing Higher Timeframe (HTF) clouds on a Lower Timeframe (LTF) chart, the clouds will appear to have a "stepped" or "ladder-like" appearance. This is normal and accurate. It represents the single EMA value holding constant for that entire higher-timeframe period. This helps you see the true support level rather than a smoothed, repainted line.

Smart Trader, Episode 03, by Ata Sabanci, Candles and TradelinesA volume-based multi-block analysis system designed for educational purposes. This indicator helps traders understand their current market situation through aggregated block analysis, volumetric calculations, trend detection, and an AI-style narrative engine.
━━━━━━━━━━━━━━━━━━━━━━━━━━━━━━━━━━━━━━━━━━━
DESIGN PHILOSOPHY: CLEAN CHART, RICH DASHBOARD
Traditional indicators often clutter charts with dozens of support/resistance lines, making it difficult to see price action clearly. This indicator takes a different approach:
The Chart:
Displays only the most meaningful, nearest levels (1 up, 1 down) that have not been consumed by price. This keeps your chart clean and focused on what matters right now.
The Dashboard:
Contains all detailed metrics, calculations, and analysis. Instead of drawing 20 lines on your chart, you get comprehensive data in an organized table format.
Why this approach?
• A clean chart allows you to see price action without visual noise
• Fewer but more meaningful levels help focus attention on immediate reference points
• The dashboard provides depth without sacrificing chart clarity
• Beginners can learn chart reading with an uncluttered view while accessing detailed analysis when needed
━━━━━━━━━━━━━━━━━━━━━━━━━━━━━━━━━━━━━━━━━━━
1. BLOCK SEGMENTATION
What it does:
Divides the analysis window into fixed-size blocks. Each block contains multiple bars that are analyzed as a single unit.
Why:
Individual bars contain noise. A single red candle in an uptrend might cause unnecessary concern, but when you view 5-10 bars as one block, the overall direction becomes clear. Block segmentation filters out bar-to-bar noise and reveals the underlying structure.
Benefit:
• Clearer view of market structure at a higher aggregation level
• Enables comparison between time periods (Block 1 vs Block 2 vs Block 3)
• Creates the foundation for composite candles and trend detection
• Reduces emotional reaction to single-bar movements
━━━━━━━━━━━━━━━━━━━━━━━━━━━━━━━━━━━━━━━━━━━
2. COMPOSITE CANDLES (FRACTAL CONCEPT)
What it does:
Each block generates a "ghost candle" representing aggregated OHLC:
• Open: First bar's open in the block
• High: Highest high across all bars in the block
• Low: Lowest low across all bars in the block
• Close: Last bar's close in the block
Why:
This is essentially a FRACTAL view of the market. The same candlestick patterns that appear on a daily chart also appear on hourly charts, and on 5-minute charts. By aggregating bars into composite candles, you create a synthetic higher timeframe view without changing your actual timeframe.
Benefit:
• See higher timeframe patterns while staying on your preferred timeframe
• Identify block-level candlestick patterns (Doji, Hammer, Marubozu, Engulfing, etc.)
• Compare composite candle relationships: Does Block 1 engulf Block 2? Is Block 1 an inside bar relative to Block 2?
• Recognize patterns that individual bars obscure due to noise
Fractal Nature:
A hammer pattern means the same thing whether it appears on a 1-minute chart or a weekly chart: price tested lower levels and was rejected. Composite candles let you see these patterns at your chosen aggregation level, providing a multi-scale view of market behavior.
━━━━━━━━━━━━━━━━━━━━━━━━━━━━━━━━━━━━━━━━━━━
3. VOLUME ENGINE
What it does:
This indicator is 100% VOLUME-BASED. It separates total volume into buying volume and selling volume using two methods:
Method 1 - Geometric (Approximation):
• Buy Volume = Total Volume × ((Close - Low) / Range)
• Sell Volume = Total Volume × ((High - Close) / Range)
Method 2 - Intrabar LTF (Precise):
Uses actual tick-level or lower timeframe data to determine real buy/sell distribution.
Why:
Raw volume tells you HOW MUCH was traded, but not WHO was aggressive. A large volume bar could mean heavy buying, heavy selling, or both. By separating buy and sell volume, you can identify which side is driving the market.
Benefit:
• Identify whether buyers or sellers are more aggressive
• Detect when volume contradicts price direction (divergence)
• Measure accumulation (buying into weakness) vs distribution (selling into strength)
• Quantify the delta (buy minus sell) to see net pressure
Why Delta Matters:
If price is rising but delta is negative, sellers are actually more aggressive despite the price increase. This divergence often precedes reversals because the price movement lacks volume confirmation.
━━━━━━━━━━━━━━━━━━━━━━━━━━━━━━━━━━━━━━━━━━━
4. PIN ANALYSIS (WICK MEASUREMENT)
What it does:
Calculates average upper pin (wick) and lower pin sizes for each block, then tracks how these change across consecutive blocks.
Why:
Upper pins represent price levels that were tested but rejected by sellers. Lower pins represent price levels that were tested but rejected by buyers. The size and direction of pins reveal rejection strength at specific price zones.
Benefit:
• Large upper pins = strong selling pressure at higher levels
• Large lower pins = strong buying support at lower levels
• Increasing upper pins across blocks = intensifying selling pressure
• Decreasing lower pins across blocks = weakening buying support
Why Track Pin Changes:
Pin behavior often changes before price direction changes. If lower pins are shrinking while price is still rising, the buying support that was defending dips is weakening. This is observable data, not prediction.
━━━━━━━━━━━━━━━━━━━━━━━━━━━━━━━━━━━━━━━━━━━
5. TREND CHANNEL DETECTION
What it does:
Identifies trend direction using block-level price structure:
• UPTREND: Block highs are higher than previous block highs, AND block lows are higher than previous block lows (HH/HL pattern)
• DOWNTREND: Block highs are lower than previous block highs, AND block lows are lower than previous block lows (LH/LL pattern)
• RANGE: No consistent directional pattern
Once detected, the system draws upper and lower channel boundaries by connecting extreme points within each trend segment.
Why:
HH/HL and LH/LL are the classical definitions of trend. By applying this logic to composite candles (blocks) rather than individual bars, the trend detection becomes more stable and less prone to whipsaws from single-bar noise.
Benefit:
• Clear visual boundaries showing the current trend channel
• Upper channel line = dynamic resistance based on actual price structure
• Lower channel line = dynamic support based on actual price structure
• Channel angle indicates trend strength (steeper = stronger)
• Channel width indicates volatility
Why Lock Trend States:
Once a block's trend classification is determined, it locks and does not change on subsequent recalculations. Without locking, the same block could flip between UP and DOWN repeatedly, creating inconsistent analysis. Locking ensures stability.
Why Project Lines Forward:
Channel lines can be projected into the future to show where support/resistance would be if the current trend continues at the same angle. This is not a prediction; it is a visual reference showing the trend's trajectory.
━━━━━━━━━━━━━━━━━━━━━━━━━━━━━━━━━━━━━━━━━━━
6. CORE LEVELS: POC, MAX BUY, MAX SELL
What it does:
Identifies key price levels within each block based on volume data:
POC (Point of Control):
The price level where the highest total volume occurred within the block.
MAX BUY Level:
The bar with the highest buying volume. The HIGH of this bar marks the level.
MAX SELL Level:
The bar with the highest selling volume. The LOW of this bar marks the level.
MIN BUY/SELL Levels:
Optional levels showing where minimum buy/sell volume occurred.
Why:
High volume at a specific price means many participants entered positions there. These participants have a vested interest in that price level. If price returns to that area, those same participants may act to defend their positions.
Benefit:
• POC acts as a volume-based magnet; price tends to revisit high-volume areas
• MAX BUY level shows where buyers committed most aggressively
• MAX SELL level shows where sellers committed most aggressively
• These levels are based on actual transaction data, not arbitrary calculations
Why Consumed Levels Disappear:
When price crosses through a level, that level has been "tested." Keeping consumed levels on the chart creates visual clutter and suggests they are still relevant when they may no longer be. Removing them keeps focus on levels that have not yet been tested.
Why Show Only Nearest Levels:
If you have 20 blocks, you could have 60+ potential levels (POC, MAX BUY, MAX SELL for each). Displaying all of them makes the chart unreadable. Showing only the nearest untested level above and below current price keeps the chart clean while providing immediate reference points.
━━━━━━━━━━━━━━━━━━━━━━━━━━━━━━━━━━━━━━━━━━━
7. QUALITY SCORE AND TREND INTELLIGENCE
What it does:
Calculates a quality score (0-100) for the current trend based on multiple factors:
• Angle steepness (stronger trends have steeper angles)
• Delta consistency (does volume support the trend direction?)
• Volume momentum (is participation increasing or decreasing?)
• Body expansion (are candle bodies growing or shrinking?)
• Pin alignment (do pins support the trend direction?)
• Contradiction count (how many factors disagree?)
Why:
Not all trends are equal. A trend with consistent volume support, expanding bodies, and aligned pins is healthier than a trend with contradicting signals. The quality score quantifies this.
Benefit:
• HIGH quality (80+): Multiple factors confirm the trend
• MEDIUM quality (60-79): Some factors confirm, some neutral
• LOW quality (below 60): Multiple contradictions exist
• Strength rating based on channel angle: VERY STRONG, STRONG, MODERATE, WEAK
━━━━━━━━━━━━━━━━━━━━━━━━━━━━━━━━━━━━━━━━━━━
8. NARRATIVE ENGINE
What it does:
Generates a text-based market analysis by synthesizing all calculated data into readable sentences.
How it works:
1. Analyzes current candle: pattern type (Doji, Hammer, Marubozu, etc.), body/wick ratios, range vs ATR
2. Analyzes composite candle: Block 1 pattern and relationship to Block 2 (Engulfing, Inside, Outside)
3. Evaluates trend context: direction, duration, quality, transitions
4. Examines volume data: delta, dominance, momentum direction
5. Checks proximity to key levels: channel boundaries, POC, core levels
6. Identifies divergences: when price and volume directions contradict
7. Produces a coherent narrative describing the current situation
Why:
Numbers and charts require interpretation. The narrative engine translates calculated data into plain language, helping traders understand what the data means in context. This is especially valuable for beginners learning to read charts.
Benefit:
• Synthesizes multiple data points into a coherent story
• Explicitly flags divergences and contradictions
• Describes the current situation without making predictions
• Educational: shows how different factors relate to each other
What the Narrative Does NOT Do:
The narrative describes what IS, not what WILL BE. It does not predict future price movement. It reports the current candle pattern, the current trend state, the current volume situation, and the current proximity to levels.
━━━━━━━━━━━━━━━━━━━━━━━━━━━━━━━━━━━━━━━━━━━
9. SMART DASHBOARD
What it does:
Displays all metrics in an organized table with multiple sections.
Sections:
• Volume Engine: Calculation method, data availability, current candle buy/sell/delta
• Trend Volumetrics: Aggregated buy/sell/delta across the current trend, trend type
• Pressure and Momentum: Average pins, pin change percentages, body expansion status
• Trend Channel Boundaries: Upper/lower levels with exact prices, distances, percentages
• Trend Intelligence: Quality score, confidence level, strength rating, volume momentum
Why:
All the detailed calculations need to live somewhere without cluttering the chart. The dashboard provides comprehensive data in a structured format.
Benefit:
• All metrics in one place
• Organized by category for easy reference
• Hover over any label to see a tooltip explaining that metric
• No need to draw dozens of lines on the chart
TIP: Hover over dashboard headers and labels to see tooltips explaining each metric.
━━━━━━━━━━━━━━━━━━━━━━━━━━━━━━━━━━━━━━━━━━━
10. LANGUAGE SUPPORT
The indicator supports three languages:
• English
• Türkçe (Turkish)
• हिन्दी (Hindi)
Why only three languages?
Each additional language requires duplicate strings throughout the code, increasing memory usage and compilation time. To keep the script optimized and responsive, language options are limited to these three.
━━━━━━━━━━━━━━━━━━━━━━━━━━━━━━━━━━━━━━━━━━━
11. DATA ACCURACY AND LIMITATIONS
This indicator is 100% VOLUME-BASED and requires Lower Timeframe (LTF) intrabar data for accurate calculations.
DATA ACCURACY LEVELS:
• 1T (Tick): Most accurate, real volume distribution per tick
• 1S (1 Second): Reasonably accurate approximation
• 15S (15 Seconds): Good approximation, longer historical data available
• 1M (1 Minute): Rough approximation, maximum historical data range
BACKTEST AND REPLAY LIMITATIONS:
• Replay mode results may differ from live trading due to data availability
• For longer backtest periods, use higher LTF settings (15S or 1M)
• Not all symbols/exchanges support tick-level data
• Crypto and Forex typically have better LTF data availability than stocks
A NOTE ON DATA ACCESS:
Higher TradingView plans provide access to more historical intrabar data, which directly impacts the accuracy of volume-based calculations. More precise volume data leads to more reliable calculations.
━━━━━━━━━━━━━━━━━━━━━━━━━━━━━━━━━━━━━━━━━━━
12. SETTINGS OVERVIEW
Main Settings:
• Window Bars: Total bars to analyze
• Group Count: Number of blocks to create
• Calculation Basis: Current bar (live updates) or Closed bar (stable, no repaint)
Block Analytics:
• Show Composite Candle: Toggle ghost candles on/off
• Composite Candle Transparency: Adjust visibility
• Dim Original Candles: Fade original candles when composites are shown
Volume Engine:
• Calculation Method: Geometric (approx) or Intrabar (precise)
• Lower Timeframe: Select LTF for intrabar calculations
Multi-Segment Trend:
• Enable Trend Detection: Toggle trend channels on/off
• Range Angle Threshold: Angle below which trend is classified as RANGE
• Line colors, width, and style
• Project to Future: Extend trend lines forward
Core Calculation:
• Enable Core Calculation: Toggle POC and core levels
• Show POC Nearest Up/Down: Display nearest untested POC levels
• Include MAX/MIN Buy/Sell Levels: Toggle extremes display
• Nearest Only: Show only the closest level above and below price
Market Narrative:
• Enable Market Narrative: Toggle narrative text
• Language selection
• Show Educational Disclaimer: Toggle disclaimer in dashboard
━━━━━━━━━━━━━━━━━━━━━━━━━━━━━━━━━━━━━━━━━━━
EDUCATIONAL PURPOSE
This indicator is designed to help traders:
1. Understand their current market situation at a glance
2. Learn chart reading through block analysis and composite candles
3. See how volume relates to price movement
4. Recognize when technical factors align or contradict
5. Focus on meaningful levels without chart clutter
Whether you are a beginner learning to read charts or an experienced trader seeking a cleaner analytical view, this tool provides structured data to support your analysis.
━━━━━━━━━━━━━━━━━━━━━━━━━━━━━━━━━━━━━━━━━━━
IMPORTANT DISCLAIMER
This indicator is for EDUCATIONAL PURPOSES ONLY and does not constitute investment advice. Always conduct your own research and consult with a qualified financial advisor before making investment decisions.
This disclaimer is also displayed within the indicator itself. If you prefer a cleaner chart, you can disable it in Settings under Market Narrative by unchecking Show Educational Disclaimer.

Penny Stock Short Signal Pro# Penny Stock Short Signal Pro (PSSP) v1.0
## Complete User Guide & Documentation
---
# 📋 TABLE OF CONTENTS
1. (#introduction)
2. (#why-short-penny-stocks)
3. (#the-7-core-detection-systems)
4. (#installation--setup)
5. (#understanding-the-dashboard)
6. (#input-settings-deep-dive)
7. (#visual-elements-explained)
8. (#alert-configuration)
9. (#trading-strategies)
10. (#risk-management)
11. (#best-practices)
12. (#troubleshooting)
13. (#changelog)
---
# Introduction
**Penny Stock Short Signal Pro (PSSP)** is a comprehensive Pine Script v6 indicator specifically engineered for identifying high-probability short-selling opportunities on low-priced, high-volatility stocks. Unlike generic indicators that apply broad technical analysis, PSSP is purpose-built for the unique characteristics of penny stock price action—where parabolic moves, retail FOMO, and violent reversals create predictable patterns for prepared traders.
## Key Features
- **7 Independent Detection Systems** working in concert to identify exhaustion points
- **Composite Signal Engine** that requires multiple confirmations before triggering
- **Real-Time Dashboard** displaying all signal states and market metrics
- **Automatic Risk Management** with dynamic stop-loss and profit target calculations
- **Customizable Sensitivity** for different trading styles (scalping vs. swing)
- **Built-in Alert System** for all major signal types
## Who Is This For?
- **Active Day Traders** looking to capitalize on intraday reversals
- **Short Sellers** who specialize in penny stocks and small caps
- **Momentum Traders** who want to identify when momentum is exhausting
- **Risk-Conscious Traders** who need clear entry/exit levels
---
# Why Short Penny Stocks?
## The Penny Stock Lifecycle
Penny stocks follow a remarkably predictable lifecycle that creates shorting opportunities:
```
PHASE 1: ACCUMULATION
└── Low volume, tight range
└── Smart money quietly building positions
PHASE 2: MARKUP / PROMOTION
└── News catalyst or promotional campaign
└── Volume increases, price begins rising
└── Early momentum traders enter
PHASE 3: DISTRIBUTION (YOUR OPPORTUNITY)
└── Parabolic move attracts retail FOMO buyers
└── Smart money selling into strength
└── Volume climax signals exhaustion
└── ⚠️ PSSP SIGNALS FIRE HERE ⚠️
PHASE 4: DECLINE
└── Support breaks, panic selling
└── Price returns toward origin
└── Short sellers profit
```
## Why Shorts Work on Penny Stocks
1. **No Fundamental Support**: Most penny stocks have no earnings, revenue, or assets to justify elevated prices
2. **Promotional Nature**: Many rallies are driven by promoters who will eventually stop
3. **Retail Exhaustion**: Retail buying power is finite—when it's exhausted, gravity takes over
4. **Float Dynamics**: Low float stocks move fast in both directions
5. **Technical Levels Matter**: VWAP, round numbers, and prior highs become self-fulfilling resistance
---
# The 7 Core Detection Systems
PSSP employs seven independent detection algorithms. Each identifies a specific type of exhaustion or reversal signal. When multiple systems fire simultaneously, the probability of a successful short dramatically increases.
---
## 1. PARABOLIC EXHAUSTION DETECTOR
### What It Detects
Identifies when price has moved too far, too fast and is likely to reverse. This system looks for the classic "blow-off top" pattern common in penny stock runners.
### Technical Logic
```
Parabolic Signal = TRUE when:
├── Consecutive green candles ≥ threshold (default: 3)
├── AND price extension from VWAP ≥ threshold ATRs (default: 1.5)
└── OR shooting star / upper wick rejection pattern forms
```
### Visual Representation
```
╱╲ ← Shooting star / upper wick
╱ ╲ (Parabolic exhaustion)
╱
╱
╱
══════════════ VWAP
╱
╱
```
### Why It Works on Penny Stocks
Penny stocks are notorious for parabolic moves driven by retail FOMO. When everyone who wants to buy has bought, there's no one left to push prices higher. The shooting star pattern shows that sellers are already stepping in at higher prices.
### Key Settings
| Parameter | Default | Range | Description |
|-----------|---------|-------|-------------|
| Lookback Period | 10 | 3-30 | Bars to analyze for pattern |
| Extension Threshold | 1.5 ATR | 0.5-5.0 | How far above VWAP is "parabolic" |
| Consecutive Green Bars | 3 | 2-10 | Minimum green bars for exhaustion |
---
## 2. VWAP REJECTION SYSTEM
### What It Detects
Volume Weighted Average Price (VWAP) is the single most important level for institutional traders. This system identifies when price tests above VWAP and gets rejected back below—a powerful short signal.
### Technical Logic
```
VWAP Rejection = TRUE when:
├── Candle high pierces above VWAP
├── AND candle closes below VWAP
├── AND candle is bearish (close < open)
└── AND rejection distance is within sensitivity threshold
```
### Visual Representation
```
High ──→ ╱╲
╱ ╲
VWAP ════════╱════╲═══════════
Close ←── Rejection
```
### Extended VWAP Signals
The system also tracks VWAP standard deviation bands. Rejection from the upper band (2 standard deviations above VWAP) is an even stronger signal.
### Why It Works on Penny Stocks
- Algorithms and institutions use VWAP as their benchmark
- Failed attempts to reclaim VWAP often lead to waterfall selling
- VWAP acts as a "magnet" that price tends to revert toward
### Key Settings
| Parameter | Default | Range | Description |
|-----------|---------|-------|-------------|
| Rejection Sensitivity | 0.5 ATR | 0.1-2.0 | How close to VWAP for valid rejection |
| Show VWAP Line | True | - | Display VWAP on chart |
| Show VWAP Bands | True | - | Display standard deviation bands |
| Band Multiplier | 2.0 | 0.5-4.0 | Standard deviations for bands |
---
## 3. VOLUME CLIMAX DETECTOR
### What It Detects
Identifies "blow-off tops" where extreme volume accompanies a price spike. This often marks the exact top as it represents maximum retail participation—after which buying power is exhausted.
### Technical Logic
```
Volume Climax = TRUE when:
├── Current volume ≥ (Average volume × Climax Multiple)
├── AND one of:
│ ├── Selling into the high (upper wick > lower wick on green bar)
│ └── OR post-climax weakness (red bar following climax bar)
```
### Visual Representation
```
Price: ╱╲
╱ ╲
╱ ╲
╱ ╲
╱
Volume:
▂▃▅▇██▇▅▃▂▁
↑
Volume Climax (3x+ average)
```
### Why It Works on Penny Stocks
- Retail traders pile in at the top, creating volume spikes
- Market makers and smart money use this liquidity to exit
- Once the volume spike passes, there's no fuel left for higher prices
- The "smart money selling into dumb money buying" creates the top
### Key Settings
| Parameter | Default | Range | Description |
|-----------|---------|-------|-------------|
| Volume MA Length | 20 | 5-50 | Period for average volume calculation |
| Climax Volume Multiple | 3.0x | 1.5-10.0 | Multiple of average for "climax" |
| Show Volume Bars | True | - | Visual volume representation |
---
## 4. RSI DIVERGENCE ANALYZER
### What It Detects
Bearish divergence occurs when price makes higher highs but RSI (momentum) makes lower highs. This indicates that momentum is weakening even as price pushes higher—a warning of imminent reversal.
### Technical Logic
```
Bearish Divergence = TRUE when:
├── RSI is in overbought territory (> threshold)
├── AND RSI is declining (current < previous < prior)
└── Indicates momentum exhaustion before price catches up
```
### Visual Representation
```
Price: /\ /\
/ \ / \ ← Higher high
/ \/
/
/
RSI: /\
/ \ /\
/ \/ \ ← Lower high (DIVERGENCE)
/ \
════════════════════ Overbought (70)
```
### Why It Works on Penny Stocks
- Penny stocks often push to new highs on weaker and weaker momentum
- Divergence signals that fewer buyers are participating at each new high
- Eventually, the lack of buying pressure leads to collapse
### Key Settings
| Parameter | Default | Range | Description |
|-----------|---------|-------|-------------|
| RSI Length | 14 | 5-30 | Standard RSI calculation period |
| Overbought Level | 70 | 60-90 | RSI level considered overbought |
| Divergence Lookback | 14 | 5-30 | Bars to look back for swing highs |
---
## 5. KEY LEVEL REJECTION TRACKER
### What It Detects
Identifies rejections from significant price levels where shorts are likely to be concentrated: High of Day (HOD), premarket highs, and psychological levels (whole and half dollars).
### Technical Logic
```
Level Rejection = TRUE when:
├── Price touches key level (within 0.2% tolerance)
├── AND candle is bearish (close < open)
├── AND close is in lower portion of candle range
│
├── Key Levels Tracked:
│ ├── High of Day (HOD)
│ ├── Premarket High
│ └── Psychological levels ($1.00, $1.50, $2.00, etc.)
```
### Visual Representation
```
HOD ─────────────────────────────────
╱╲ ← Rejection
╱ ╲
╱ ╲
╱
─────────────────────────────────
PM High ─────────────────────────────
```
### Why It Works on Penny Stocks
- **HOD**: The high of day is where the most traders are trapped long. Failure to break HOD often triggers stop-loss cascades
- **Premarket High**: Represents overnight enthusiasm; failure to exceed often means the "news" is priced in
- **Psychological Levels**: Round numbers ($1, $2, $5) attract orders and act as natural resistance
### Key Settings
| Parameter | Default | Range | Description |
|-----------|---------|-------|-------------|
| Track HOD Rejection | True | - | Monitor high of day |
| Track Premarket High | True | - | Monitor premarket resistance |
| Track Psychological Levels | True | - | Monitor round numbers |
---
## 6. FAILED BREAKOUT DETECTOR
### What It Detects
Identifies "bull traps" where price breaks above resistance but immediately fails and closes back below. This traps breakout buyers and often leads to accelerated selling.
### Technical Logic
```
Failed Breakout = TRUE when:
├── Price breaks above recent high (lookback period)
├── AND one of:
│ ├── Same bar closes below the breakout level
│ └── OR following bars show consecutive red candles
```
### Visual Representation
```
╱╲
╱ ╲ ← False breakout
Recent High ══╱════╲════════════════
╱ ╲
╱ ╲
╱ ╲ ← Trapped longs panic sell
```
### Why It Works on Penny Stocks
- Breakout traders enter on the break, providing exit liquidity for smart money
- When the breakout fails, these traders become trapped and must exit
- Their forced selling accelerates the decline
- Penny stocks have thin order books, making failed breakouts especially violent
### Key Settings
| Parameter | Default | Range | Description |
|-----------|---------|-------|-------------|
| Breakout Lookback | 5 | 2-15 | Bars to define "recent high" |
| Confirmation Bars | 2 | 1-5 | Bars to confirm failure |
---
## 7. MOVING AVERAGE BREAKDOWN SYSTEM
### What It Detects
Monitors exponential moving averages (EMAs) for bearish crossovers and price rejections. EMA crosses often signal trend changes, while rejections from EMAs indicate resistance.
### Technical Logic
```
MA Breakdown = TRUE when:
├── Bearish EMA cross (fast crosses below slow)
└── OR EMA rejection (price tests EMA from below and fails)
```
### Visual Representation
```
╱╲ ← Rejection from EMA
╱ ╲
EMA 9 ═══════════╱════╲═══════════
╲
EMA 20 ═══════════════════╲════════
╲
Bearish cross ↓
```
### Why It Works on Penny Stocks
- EMAs smooth out the noise and show underlying trend direction
- When fast EMA crosses below slow EMA, it signals momentum shift
- Rejected attempts to reclaim EMAs show sellers are in control
### Key Settings
| Parameter | Default | Range | Description |
|-----------|---------|-------|-------------|
| Fast EMA | 9 | 3-20 | Short-term trend |
| Slow EMA | 20 | 10-50 | Medium-term trend |
| Show EMAs | True | - | Display on chart |
---
# Installation & Setup
## Step 1: Access Pine Editor
1. Open TradingView (tradingview.com)
2. Open any chart
3. Click "Pine Editor" at the bottom of the screen
## Step 2: Create New Indicator
1. Click "Open" → "New blank indicator"
2. Delete any existing code
3. Paste the entire PSSP code
## Step 3: Save and Add to Chart
1. Click "Save" (give it a name like "PSSP")
2. Click "Add to chart"
3. The indicator will appear with default settings
## Step 4: Configure Settings
1. Click the gear icon (⚙️) on the indicator
2. Adjust settings based on your trading style (see Settings section)
3. Click "OK" to apply
## Recommended Chart Setup
- **Timeframe**: 1-minute or 5-minute for scalping, 15-minute for swing shorts
- **Chart Type**: Candlestick
- **Extended Hours**: Enable if trading premarket/afterhours
- **Volume**: Can disable default volume since PSSP tracks it
---
# Understanding the Dashboard
The real-time dashboard provides at-a-glance status of all systems:
```
┌─────────────────────────────────────────┐
│ 📊 SHORT SIGNAL DASHBOARD │
├─────────────────────────────────────────┤
│ Signal Strength: 5/7 │
├─────────────────────────────────────────┤
│ ─── ACTIVE SIGNALS ─── │
│ │
│ Parabolic Exhaustion 🔴 2.1 ATR │
│ VWAP Rejection 🔴 Above │
│ Volume Climax 🔴 4.2x Avg │
│ RSI Divergence ⚪ RSI: 68 │
│ Level Rejection 🔴 @ HOD │
│ Failed Breakout 🔴 │
│ MA Breakdown ⚪ Bullish │
├─────────────────────────────────────────┤
│ ─── RISK LEVELS ─── │
│ Stop: $2.45 T1: $2.10 T2: $1.85 │
└─────────────────────────────────────────┘
```
## Dashboard Elements Explained
### Signal Strength Indicator
| Rating | Signals | Color | Interpretation |
|--------|---------|-------|----------------|
| STRONG | 5-7 | Red | High-confidence short opportunity |
| MODERATE | 3-4 | Orange | Decent setup, consider other factors |
| WEAK | 1-2 | Gray | Insufficient confirmation |
| NONE | 0 | Gray | No short signals active |
### Signal Status Icons
- 🔴 = Signal is ACTIVE (condition met)
- ⚪ = Signal is INACTIVE (condition not met)
### Contextual Metrics
Each signal row includes relevant metrics:
- **Parabolic**: Shows ATR extension from VWAP
- **VWAP**: Shows if price is Above/Below VWAP
- **Volume**: Shows current volume as multiple of average
- **RSI**: Shows current RSI value
- **Level**: Shows which level was touched (HOD, PM High, etc.)
- **MA**: Shows EMA relationship (Bullish/Bearish)
### Risk Levels
When a composite short signal fires:
- **Stop**: Suggested stop-loss level (high + ATR multiple)
- **T1**: First profit target (1:1 risk/reward)
- **T2**: Second profit target (user-defined R:R)
---
# Input Settings Deep Dive
## Group 1: Parabolic Exhaustion
| Setting | Default | Conservative | Aggressive | Description |
|---------|---------|--------------|------------|-------------|
| Enable | True | True | True | Turn system on/off |
| Lookback Period | 10 | 15 | 5 | Bars analyzed for pattern |
| Extension Threshold | 1.5 | 2.0 | 1.0 | ATRs above VWAP for "parabolic" |
| Consecutive Green Bars | 3 | 4 | 2 | Minimum green bars required |
**Tuning Tips:**
- Lower thresholds = more signals but more false positives
- Higher thresholds = fewer signals but higher quality
- For very volatile penny stocks, consider higher thresholds
## Group 2: VWAP Rejection
| Setting | Default | Conservative | Aggressive | Description |
|---------|---------|--------------|------------|-------------|
| Enable | True | True | True | Turn system on/off |
| Rejection Sensitivity | 0.5 | 0.3 | 0.8 | ATR distance for valid rejection |
| Show VWAP Line | True | True | True | Display VWAP |
| Show VWAP Bands | True | True | True | Display deviation bands |
| Band Multiplier | 2.0 | 2.5 | 1.5 | Standard deviations for bands |
**Tuning Tips:**
- Tighter sensitivity (lower number) = must reject very close to VWAP
- Wider bands = less frequent upper band rejections but more significant
## Group 3: Volume Climax
| Setting | Default | Conservative | Aggressive | Description |
|---------|---------|--------------|------------|-------------|
| Enable | True | True | True | Turn system on/off |
| Volume MA Length | 20 | 30 | 10 | Baseline volume period |
| Climax Volume Multiple | 3.0 | 4.0 | 2.0 | Multiple for "climax" status |
| Show Volume Profile | True | True | True | Visual volume bars |
**Tuning Tips:**
- Higher multiple = only extreme volume spikes trigger
- Shorter MA = more responsive to recent volume changes
- For highly liquid stocks, consider higher multiples
## Group 4: Momentum Divergence
| Setting | Default | Conservative | Aggressive | Description |
|---------|---------|--------------|------------|-------------|
| Enable | True | True | True | Turn system on/off |
| RSI Length | 14 | 21 | 7 | RSI calculation period |
| Overbought Level | 70 | 75 | 65 | Threshold for "overbought" |
| Divergence Lookback | 14 | 20 | 10 | Bars for swing high detection |
**Tuning Tips:**
- Lower overbought threshold = more frequent signals
- Shorter RSI length = more responsive but noisier
## Group 5: Key Level Rejection
| Setting | Default | Description |
|---------|---------|-------------|
| Enable | True | Master toggle for level system |
| Track Premarket High | True | Monitor premarket resistance |
| Track HOD Rejection | True | Monitor high of day |
| Track Psychological Levels | True | Monitor round numbers |
**Tuning Tips:**
- Disable premarket tracking if stock doesn't have significant premarket activity
- Psychological levels work best on stocks under $10
## Group 6: Failed Follow-Through
| Setting | Default | Conservative | Aggressive | Description |
|---------|---------|--------------|------------|-------------|
| Enable | True | True | True | Turn system on/off |
| Breakout Lookback | 5 | 8 | 3 | Bars defining "recent high" |
| Confirmation Bars | 2 | 3 | 1 | Bars to confirm failure |
**Tuning Tips:**
- Shorter lookback = more breakouts detected but smaller significance
- More confirmation bars = higher confidence but later entry
## Group 7: Moving Average Signals
| Setting | Default | Conservative | Aggressive | Description |
|---------|---------|--------------|------------|-------------|
| Enable | True | True | True | Turn system on/off |
| Fast EMA | 9 | 12 | 5 | Short-term trend |
| Slow EMA | 20 | 26 | 13 | Medium-term trend |
| Show EMAs | True | True | True | Display on chart |
**Tuning Tips:**
- Standard 9/20 works well for most penny stocks
- Faster EMAs (5/13) for scalping, slower (12/26) for swing trading
## Group 8: Composite Signal
| Setting | Default | Conservative | Aggressive | Description |
|---------|---------|--------------|------------|-------------|
| Minimum Signals | 3 | 4-5 | 2 | Signals needed for trigger |
| Show Dashboard | True | True | True | Display signal table |
| Dashboard Position | top_right | - | - | Screen location |
**Tuning Tips:**
- **Minimum Signals is the most important setting**
- Higher minimum = fewer trades but higher win rate
- Lower minimum = more trades but more false signals
## Group 9: Risk Management
| Setting | Default | Conservative | Aggressive | Description |
|---------|---------|--------------|------------|-------------|
| Show Stop Levels | True | True | True | Display stop loss |
| Stop ATR Multiple | 1.5 | 2.0 | 1.0 | Stop distance in ATRs |
| Show Targets | True | True | True | Display profit targets |
| Target R:R | 2.0 | 1.5 | 3.0 | Risk:Reward for Target 2 |
**Tuning Tips:**
- Tighter stops (lower ATR multiple) = less risk but more stop-outs
- Higher R:R targets = bigger winners but fewer targets hit
## Group 10: Visual Settings
| Setting | Default | Description |
|---------|---------|-------------|
| Bullish Color | Green | Color for bullish elements |
| Bearish Color | Red | Color for bearish/short signals |
| Warning Color | Orange | Color for caution signals |
| Neutral Color | Gray | Color for inactive elements |
---
# Visual Elements Explained
## Chart Overlays
### VWAP Line (Blue)
- **Solid blue line** = Volume Weighted Average Price
- Price above VWAP = bullish bias
- Price below VWAP = bearish bias
- **Use**: Short when price rejects from above VWAP
### VWAP Bands (Purple circles)
- Upper band = 2 standard deviations above VWAP
- Lower band = 2 standard deviations below VWAP
- **Use**: Extreme extension to upper band signals potential reversal
### EMAs (Orange and Red)
- **Orange line** = Fast EMA (9-period default)
- **Red line** = Slow EMA (20-period default)
- **Use**: Bearish cross or price rejection from EMAs confirms short
### HOD Line (Red, dashed)
- Shows the current day's high
- **Use**: Rejection from HOD is a key short signal
### Premarket High (Orange, dashed)
- Shows premarket session high
- **Use**: Failure to break PM high often signals weakness
## Signal Markers
### Individual Signal Markers (Small)
| Shape | Color | Signal |
|-------|-------|--------|
| ▼ Triangle | Purple | Parabolic Exhaustion |
| ✕ X-Cross | Blue | VWAP Rejection |
| ◆ Diamond | Yellow | Volume Climax |
| ● Circle | Orange | RSI Divergence |
| ■ Square | Red | Failed Breakout |
### Composite Short Signal (Large)
- **Large red triangle** with "SHORT" text
- Only appears when minimum signal threshold is met
- This is your primary trading signal
## Risk Level Lines
### Stop Loss (Red line)
- Calculated as: Entry + (ATR × Stop Multiple)
- Represents maximum acceptable loss
- **RESPECT THIS LEVEL**
### Target 1 (Light green line)
- First profit target at 1:1 risk/reward
- Consider taking partial profits here
### Target 2 (Dark green line)
- Second profit target at user-defined R:R
- Let winners run to this level
## Background Coloring
### Light Red Background
- Appears when composite short signal is active
- Indicates you should be looking for shorts, not longs
### Light Purple Background
- Appears during extreme parabolic extension
- Warning of potential imminent reversal
---
# Alert Configuration
## Available Alerts
### 1. Composite Short Signal
**Best for**: Primary trading signal
```
Condition: Composite short signal fires
Message: "PSSP: Short Signal Triggered - {ticker} at {close}"
```
### 2. Parabolic Exhaustion
**Best for**: Early warning of potential top
```
Condition: Parabolic exhaustion detected
Message: "PSSP: Parabolic exhaustion detected on {ticker}"
```
### 3. Volume Climax
**Best for**: Blow-off top identification
```
Condition: Volume climax occurs
Message: "PSSP: Volume climax / blow-off top on {ticker}"
```
### 4. Strong Short Setup (5+ Signals)
**Best for**: High-confidence opportunities only
```
Condition: 5 or more signals active
Message: "PSSP: STRONG short setup on {ticker}"
```
### 5. Very Strong Short Setup (6+ Signals)
**Best for**: Maximum confidence trades
```
Condition: 6 or more signals active
Message: "PSSP: VERY STRONG short setup on {ticker}"
```
### 6. Failed Breakout
**Best for**: Bull trap identification
```
Condition: Failed breakout detected
Message: "PSSP: Failed breakout detected on {ticker}"
```
### 7. Key Level Rejection
**Best for**: Resistance level plays
```
Condition: Key level rejection occurs
Message: "PSSP: Key level rejection on {ticker}"
```
## Setting Up Alerts in TradingView
1. Right-click on the chart
2. Select "Add Alert"
3. Set Condition to "Penny Stock Short Signal Pro"
4. Choose your desired alert condition
5. Configure notification method (popup, email, webhook, etc.)
6. Set expiration (or "Open-ended" for permanent)
7. Click "Create"
## Alert Strategy Recommendations
### For Active Day Traders
- Enable: Composite Short Signal, Volume Climax
- Set to: Popup + Sound
- Check frequently during market hours
### For Swing Traders
- Enable: Strong Short Setup (5+), Very Strong Short Setup (6+)
- Set to: Email + Mobile Push
- Review at key times (open, lunch, close)
### For Part-Time Traders
- Enable: Very Strong Short Setup (6+) only
- Set to: Email + SMS
- Only trade highest-conviction setups
---
# Trading Strategies
## Strategy 1: The Parabolic Fade
**Setup Requirements:**
- Parabolic Exhaustion signal ACTIVE
- Extension from VWAP ≥ 2.0 ATR
- Volume climax or declining volume on push
**Entry:**
- Short on first red candle after signal
- Or short on break below prior candle's low
**Stop Loss:**
- Above the high of the parabolic move
- Maximum: 1.5 ATR above entry
**Targets:**
- T1: VWAP (take 50% off)
- T2: Lower VWAP band or LOD
**Best Time:** 9:30-10:30 AM (morning runners)
---
## Strategy 2: VWAP Rejection Short
**Setup Requirements:**
- VWAP Rejection signal ACTIVE
- Price came from below VWAP
- Rejection candle has significant upper wick
**Entry:**
- Short on close below VWAP
- Or short on break below rejection candle low
**Stop Loss:**
- Above VWAP + 0.5 ATR
- Or above rejection candle high
**Targets:**
- T1: Lower VWAP band
- T2: Prior support or LOD
**Best Time:** Midday (11:00 AM - 2:00 PM)
---
## Strategy 3: HOD Failure Short
**Setup Requirements:**
- Level Rejection signal ACTIVE (HOD)
- Multiple tests of HOD without breakthrough
- Volume declining on each test
**Entry:**
- Short on confirmed HOD rejection
- Wait for close below the rejection candle
**Stop Loss:**
- Above HOD + 0.25 ATR (tight)
- Clear invalidation if HOD breaks
**Targets:**
- T1: VWAP
- T2: Morning support levels
**Best Time:** 10:30 AM - 12:00 PM
---
## Strategy 4: Volume Climax Fade
**Setup Requirements:**
- Volume Climax signal ACTIVE
- Volume ≥ 3x average on green candle
- Followed by bearish candle or upper wick
**Entry:**
- Short on first red candle after climax
- Or short on break below climax candle low
**Stop Loss:**
- Above climax candle high
- Give room for volatility spike
**Targets:**
- T1: 50% retracement of the run
- T2: VWAP or start of the run
**Best Time:** First hour of trading
---
## Strategy 5: The Full Composite (High Conviction)
**Setup Requirements:**
- Composite Short signal ACTIVE
- Minimum 4-5 individual signals
- Clear visual of signal markers clustering
**Entry:**
- Short immediately on composite signal
- Use market order for fast-moving stocks
**Stop Loss:**
- Use indicator's automatic stop level
- Do not deviate from system
**Targets:**
- T1: Indicator's T1 level (1:1)
- T2: Indicator's T2 level (2:1)
**Best Time:** Any time with sufficient signals
---
# Risk Management
## Position Sizing Formula
```
Position Size = (Account Risk %) / (Stop Loss %)
Example:
- Account: $25,000
- Risk per trade: 1% = $250
- Entry: $2.00
- Stop: $2.20 (10% stop)
- Position Size: $250 / 10% = $2,500 worth
- Shares: $2,500 / $2.00 = 1,250 shares
```
## Risk Rules
### The 1% Rule
Never risk more than 1% of your account on any single trade. For a $25,000 account, max risk = $250.
### The 2x Stop Rule
If your stop gets hit twice on the same stock, stop trading it for the day. The pattern isn't working.
### The Daily Loss Limit
Set a maximum daily loss (e.g., 3% of account). Stop trading if hit.
### The Size-Down Rule
After a losing trade, reduce your next position size by 50%. Rebuild after a winner.
## Short-Specific Risks
### The Short Squeeze
- Penny stocks can squeeze violently
- ALWAYS use stops
- Never "hope" a position comes back
- Size appropriately for volatility
### The Hard-to-Borrow
- Check borrow availability before trading
- High borrow fees eat into profits
- Some stocks become HTB mid-trade
### The Halt Risk
- Penny stocks can halt on volatility
- Position size for worst-case halt against you
- Halts can open significantly higher
---
# Best Practices
## DO's
✅ **Wait for multiple signals** - Single signals have lower accuracy
✅ **Trade with the trend** - Short when daily trend is down
✅ **Use the dashboard** - Check signal count before entering
✅ **Respect stops** - The indicator calculates them for a reason
✅ **Size appropriately** - Penny stocks are volatile; position small
✅ **Trade liquid stocks** - Volume ≥ 500K daily average
✅ **Know the catalyst** - Understand why the stock is moving
✅ **Take partial profits** - Secure gains at T1
✅ **Journal your trades** - Track what works and what doesn't
✅ **Time your entries** - Best shorts often come 10:30-11:30 AM
## DON'Ts
❌ **Don't short strong stocks** - If it won't go down, don't force it
❌ **Don't fight the tape** - A stock going up can keep going up
❌ **Don't average up on losers** - Adding to losing shorts is dangerous
❌ **Don't ignore the dashboard** - It exists to help you
❌ **Don't overtrade** - Quality over quantity
❌ **Don't short into news** - Wait for the reaction first
❌ **Don't trade the first 5 minutes** - Too chaotic for reliable signals
❌ **Don't hold overnight** - Penny stock gaps can destroy accounts
❌ **Don't trade without stops** - Ever.
❌ **Don't trade on tilt** - After losses, take a break
## Optimal Trading Windows
| Time (ET) | Quality | Notes |
|-----------|---------|-------|
| 9:30-9:35 | ⭐ | Too volatile, avoid |
| 9:35-10:30 | ⭐⭐⭐⭐⭐ | Best shorts, morning runners exhaust |
| 10:30-11:30 | ⭐⭐⭐⭐ | Secondary exhaustion, HOD rejections |
| 11:30-2:00 | ⭐⭐ | Midday lull, lower quality |
| 2:00-3:00 | ⭐⭐⭐ | Afternoon setups develop |
| 3:00-3:30 | ⭐⭐⭐⭐ | End of day momentum |
| 3:30-4:00 | ⭐⭐ | Closing volatility, risky |
---
# Troubleshooting
## Common Issues
### "Signals aren't appearing"
- Check that the relevant system is enabled in settings
- Ensure minimum signals threshold isn't too high
- Verify the stock has sufficient volume for calculations
### "Too many false signals"
- Increase minimum signals threshold
- Use more conservative settings (see Settings section)
- Focus on stocks with cleaner price action
### "Dashboard not showing"
- Ensure "Show Signal Dashboard" is enabled
- Check that your chart has enough space
- Try a different dashboard position
### "VWAP line is missing"
- VWAP requires intraday timeframes (1m, 5m, 15m, etc.)
- VWAP resets daily; won't show on daily+ charts
- Ensure "Show VWAP Line" is enabled
### "Stop loss seems too tight/wide"
- Adjust Stop ATR Multiple in Risk Management settings
- Lower multiple = tighter stop
- Higher multiple = wider stop
### "Alerts not triggering"
- Verify alert is set to the correct indicator
- Check that alert hasn't expired
- Ensure notification settings are configured in TradingView
## Performance Optimization
If the indicator is slow:
1. Reduce the number of visual elements shown
2. Disable unused signal systems
3. Use on fewer simultaneous charts
4. Close unused browser tabs
---
# Changelog
## Version 1.0 (Initial Release)
- 7 core detection systems implemented
- Real-time signal dashboard
- Automatic risk management calculations
- 7 alert conditions
- Full visual overlay system
- Comprehensive input settings
## Planned Features (Future Updates)
- Scanner integration for multi-stock screening
- Machine learning signal weighting
- Backtesting statistics panel
- Volume profile analysis
- Level 2 data integration (if available)
- Custom timeframe VWAP options
---
# Support & Feedback
## Reporting Issues
When reporting issues, please include:
1. TradingView username
2. Stock symbol and timeframe
3. Screenshot of the issue
4. Your indicator settings
5. Steps to reproduce
## Feature Requests
We welcome suggestions for improving PSSP. Consider:
- What specific pattern are you trying to catch?
- How would this help your trading?
- Any reference examples?
---
# Disclaimer
**IMPORTANT: This indicator is for educational and informational purposes only.**
- Past performance does not guarantee future results
- Short selling carries unlimited risk potential
- Always use proper position sizing and stop losses
- Paper trade before using real capital
- The creator assumes no liability for trading losses
- Consult a financial advisor before trading
**Trade at your own risk.**
---
*Penny Stock Short Signal Pro v1.0*
*Pine Script v6*
*© 2025*

Apex Wallet - Ultimate Multi-Oscillator (9-in-1) & Market TrendThe Apex Wallet Multi-Oscillator is a powerful "All-in-One" technical analysis tool designed to clean up your charts by combining nine of the most effective momentum and trend indicators into a single workspace. This script is engineered to adapt to different trading styles—Scalping, Day-Trading, or Swing-Trading—with a single click.
+4
Whether you are looking for trend exhaustion, momentum shifts, or volatility breakouts, this indicator provides a clear, visual summary of market dynamics.
+1
Key Features
9 Indicators in 1: Access RSI, Stochastic, StochRSI, MACD, Zero-Lag MACD, Andean Oscillator, and the Traders Dynamic Index (TDI).
+1
Smart Layout Modes:
Raw (Brut): Classic view with original values.
+1
Stacked (Empilé): Organizes indicators into fixed vertical zones to prevent overlapping.
+1
Proportional Stacking: Automatically calculates and adjusts the height of blocks based on active oscillators.
+2
Trading Presets: Switch between Scalping, Day-Trading, and Swing-Trading modes. The script automatically adjusts periods and lengths (e.g., RSI 7 for Scalping vs. 21 for Swing) to match the market speed.
+3
Included Oscillators
Stochastic & RSI: Standard momentum tools with color-coded signals.
Traders Dynamic Index (TDI): A full suite including the RSI Price Line, Signal Line, and Market Base Line with optional Bollinger Bandwidth columns.
+1
MACD & Zero-Lag MACD: Includes histogram fills and trend-colored lines for faster reaction to price movement.
+2
Andean Oscillator: An advanced tool to identify Bull/Bear dominance and market "Range" or "Reversal" states.
Visual Signals & Alerts
Market Trend: Optional visual coloring based on indicator crosses to quickly spot bullish or bearish momentum.
+3
Customizable UI: High-fidelity rendering with dashed levels and proportional fills for a professional, clean interface.
+1
Integrated Alerts: Pre-configured alerts for Andean Oscillator trend changes (Bullish, Bearish, or Reversal).
How to use
Select your Trading Mode in the settings based on your timeframe.
Toggle the indicators you want to see.
Use the Stacked mode if you want to keep your sub-window organized without lines crossing each other.
