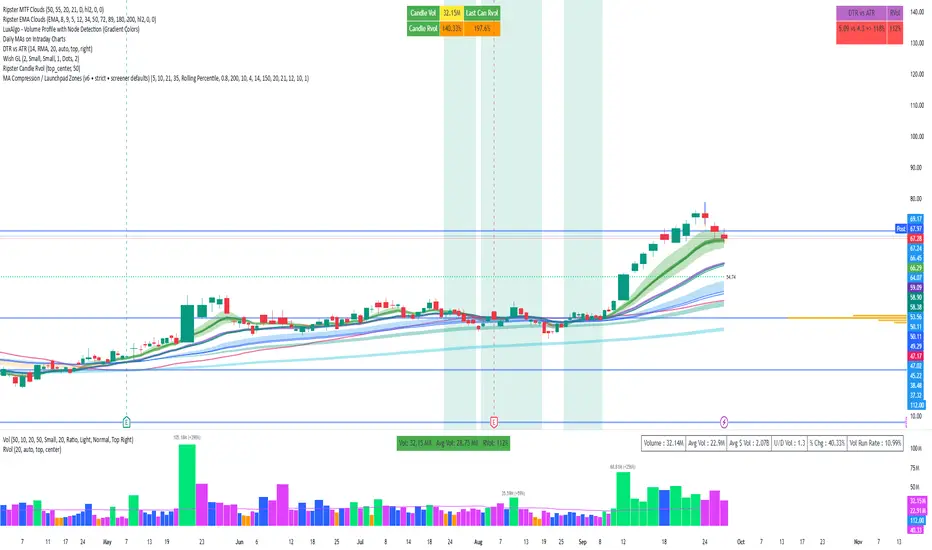
MA Compression / Launchpad Zones v6MA Compression / Launchpad Zones (v6 • strict • screener defaults)Pine Script®指標由tarun1042004提供22
Scenario Screener — Consolidation → Bullish SetupThe script combines multiple indicators to filter out false signals and only highlight strong conditions: Consolidation Check Uses ATR % of price → filters out stocks in tight ranges. Uses Choppiness Index → confirms sideways/non-trending behavior. Momentum Shift (Bullish Bias) MACD Histogram > 0 → bullish momentum starting. RSI between 55–70 → strength without being overbought. Stochastic %K & %D > 70 → confirms strong momentum. Volume & Accumulation Chaikin Money Flow (CMF > 0) → buying pressure. Chaikin Oscillator > 0 (debug only) → accumulation phase. Trend Direction +DI > -DI (from DMI) → buyers stronger than sellers. ADX between 18–40 → healthy trend strength (not too weak, not overheated). Breakout Filter (Optional) If enabled, requires price to cross above 20 SMA before signal confirmation. 📈 Outputs ✅ Green label (“MATCH”) below the bar when all bullish conditions align. ✅ Background highlight (light green) when signal appears. ✅ Info Table (top-right) summarizing key values: Signal = True/False MACD, CMF, Chaikin valuesPine Script®指標由vaibhavchotaliya1990提供13
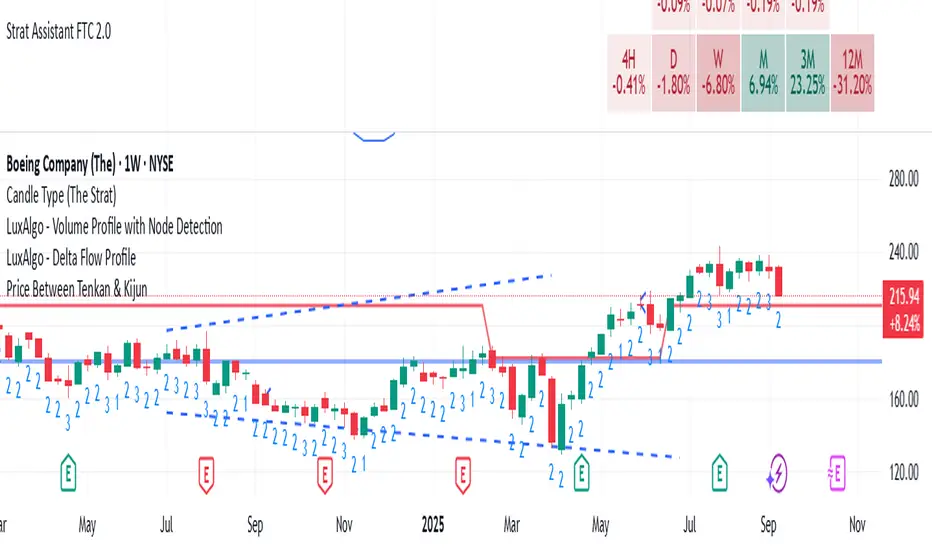
Price Between Tenkan & KijunThis is to find stocks that either breaking up or down from a large screener listPine Script®指標由smiley1963提供5
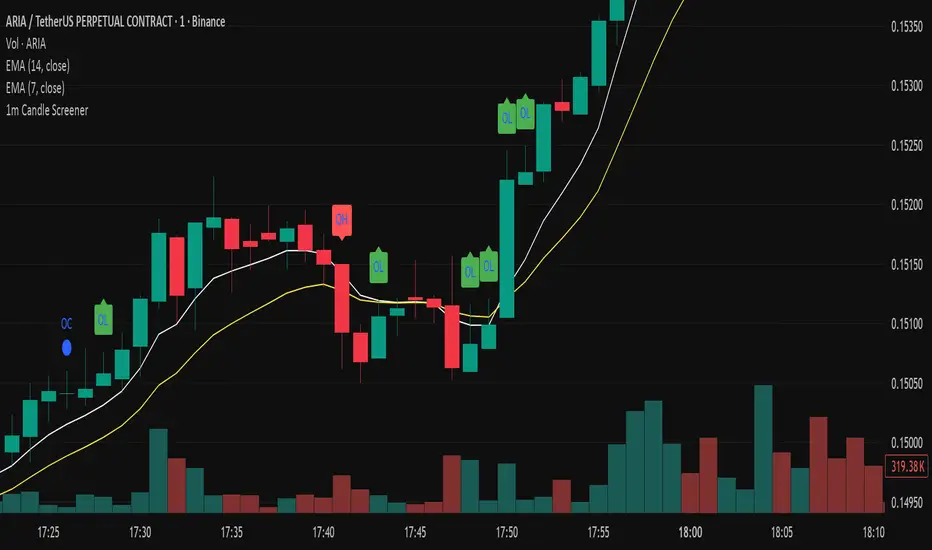
Precision Candle Marker – OL/OH/OC ScreenerThis indicator highlights high-probability precision candles on any perpetual contract, designed especially for scalpers and short-term traders. It marks three unique candle setups on the 1-minute chart (works on other timeframes too): 🟢 Open = Low (OL) → Strong bullish momentum, buyers took control instantly. 🔴 Open = High (OH) → Strong bearish momentum, sellers took control instantly. 🔵 Open = Close (OC) → Doji / indecision candle, potential reversal or continuation signal. Use cases: Identify breakout entry points in uptrend/downtrend. Filter noise and focus on precision candles. Combine with trend indicators (EMA, VWAP, RSI) for confirmation. This tool is best suited for scalping perpetual contracts (e.g., BTCUSDT, ETHUSDT) but works on any symbol and timeframe.Pine Script®指標由popularStar56kwb提供31
MA20 & MA50 RisingMA20 & MA50 Rising Scanner Detects when both the 20-period and 50-period simple moving averages turn upward on the most recent bar. Designed as a lightweight screener column for TradingView’s watchlists. Overview This indicator plots a binary flag (0 or 1) per symbol, where - 1 means SMA(20) > SMA(20) and SMA(50) > SMA(50) - 0 means one or both moving averages did not rise Add it as a custom column in your watchlist to instantly surface stocks with both short- and medium-term trend acceleration. How It Works - Calculates ma20 = simple moving average of the last 20 closes - Calculates ma50 = simple moving average of the last 50 closes - Compares each with its prior value (ma20 and ma50 ) - Sets flag to 1 only when both are higher than yesterday’s values When you filter your watchlist for flag == 1, you see only symbols whose 20- and 50-period SMAs both rose on the latest bar. Pine Script®指標由tkw001提供9
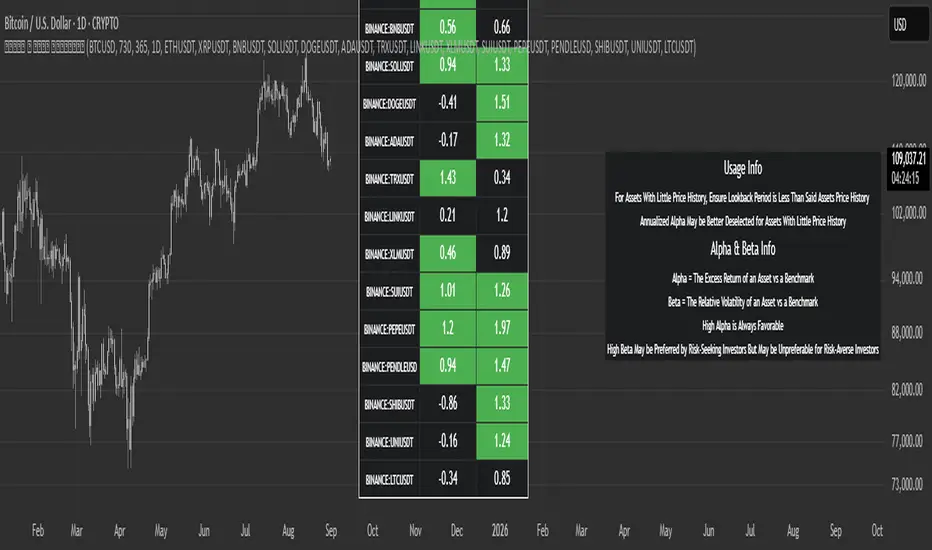
Alpha & Beta ScreenerScreen up to 15 assets and obtain Alpha and Beta values vs a benchmark.Pine Script®指標由JPTRW提供6
Strat Failed 2-Up/2-Down Scanner v2**Strat Failed 2-Up/2-Down Scanner** The Strat Failed 2-Up/2-Down Scanner is designed for traders using The Strat methodology, developed by Rob Smith, to identify key reversal patterns in any market and timeframe. This indicator detects two specific candlestick patterns: Failed 2-Up (bearish) and Failed 2-Down (bullish), which signal potential reversals when a directional move fails to follow through. **What It Does** - **Failed 2-Up**: Identifies a bearish candle where the low and high are higher than the previous candle’s low and high, but the close is below the open, indicating a failed attempt to continue an uptrend. These are marked with a red candlestick, a red downward triangle above the bar, and a table entry. - **Failed 2-Down**: Identifies a bullish candle where the high and low are lower than the previous candle’s high and low, but the close is above the open, signaling a failed downtrend. These are marked with a green candlestick, a green upward triangle below the bar, and a table entry. - A table in the top-right corner displays the signal type ("Failed 2-Up" or "Failed 2-Down") and the ticker symbol for quick reference. - Alerts are provided for both patterns, making the indicator compatible with TradingView’s screener for automated scanning. **How It Works** The indicator analyzes each candlestick’s high, low, and close relative to the previous candle: - Failed 2-Up: `low > low `, `high > high `, `close < open`. - Failed 2-Down: `high < high `, `low < low `, `close > open`. When these conditions are met, the indicator applies visual markers (colored bars and triangles) and updates the signal table. Alert conditions trigger notifications for integration with TradingView’s alert system. **How to Use** 1. Apply the indicator to any chart (stocks, forex, crypto, etc.) on any timeframe (e.g., 1-minute, hourly, daily). 2. Monitor the chart for red (Failed 2-Up) or green (Failed 2-Down) candlesticks with corresponding triangles. 3. Check the top-right table for the latest signal and ticker. 4. Set alerts by selecting “Failed 2-Up Detected” or “Failed 2-Down Detected” in TradingView’s alert menu to receive notifications (e.g., via email or app). 5. Use the signals to identify potential reversal setups in conjunction with other Strat-based analysis, such as swing levels or time-based strategies. **Originality** Unlike other Strat indicators that may focus on swing levels or complex candlestick combinations, this scanner specifically targets Failed 2-Up and Failed 2-Down patterns with clear, minimalist visualizations (bars, triangles, table) and robust alert functionality. Its simplicity makes it accessible for both novice and experienced traders using The Strat methodology. **Ideal For** Day traders, swing traders, and scalpers looking to capitalize on reversal signals in trending or ranging markets. The indicator is versatile for any asset class and timeframe, enhancing trade decision-making with The Strat’s pattern-based approach.Pine Script®指標由SmartGatorTrader提供108
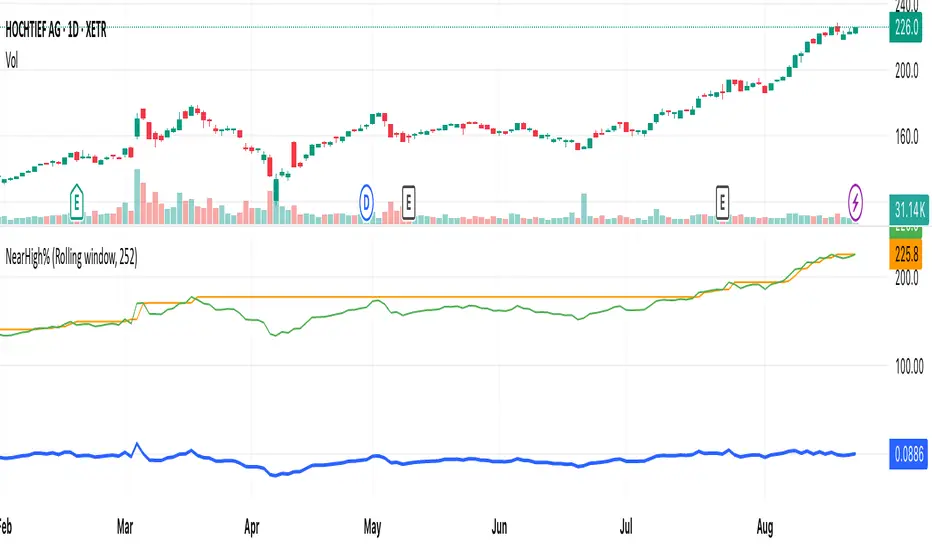
Near New High ScreenerA simple indicator intended to be used in a pinescript scanner to find stocks that are re reaching highs after a pullback or base formation. To use add it as a favourite indicator so it can be selected in a pinescript scanner. In the settings you can select whether to use the highest high or highest close for the previous high (defaults to close) and whether to use the all time high or the high from the last X days (defaults to 252 days). Once opened in a pine scanner apply to a watchlist and scan. Stocks with a positive % have broken out from a previous high today, those with a negative % are that % away from the previous high. You can sort by the “Pct from Prev High%” column or use the scanner filter to filter for stocks between two values, for example between 0 and -5% to find stocks near a new high, or >0 to find stocks that have broken out today.Pine Script®指標由ldnandrew提供6
Reversal Radars — Berk v2.0 (Bottom & Top)1) Combined script (Dip+Tepe) Title: Reversal Radars — Berk v2.0 (Bottom & Top) Description (EN): What it does Two high-probability reversal detectors in one indicator: a Bottom Reversal Radar (long bias) and a Top Reversal Radar (short/hedge bias). Each radar aggregates multiple conditions into a single score and triggers when Score ≥ Threshold. How it works RSI regime shift: Bottom = recovery after oversold (touched 30, crosses up 35). Top = roll-over from overbought (touched 70, crosses down 65). MACD cross: Bull (up) for bottoms, Bear (down) for tops. EMA8 filter: Close above (bottom) / below (top) EMA(8). Structure break (BOS): Close above recent swing high / below recent swing low (lookbackBars, using precomputed highest/lowest to avoid inconsistencies). EMA200 proximity: Price within a configurable band (default −5% … +2%). Volume expansion: Volume ≥ SMA(20) × multiplier (default 1.5×). Divergence: Pivot-confirmed (3/3) bullish (bottom) or bearish (top) RSI divergence. Scoring: RSI shift +2, divergence +2, MACD +1, EMA8 +1, BOS +1, Volume +1, EMA200 band +1. Signals & Alerts Bottom: label “DÖNÜŞ↑” and alert “Dipten Dönüş — Ana Sinyal” when scoreLong ≥ thrLong. Top: label “DÖNÜŞ↓” and alert “Tepeden Dönüş — Ana Sinyal” when scoreShort ≥ thrShort. Use Once per bar close for stable alerts. Inputs lenRSI, rsiOS=30, rsiRecover=35, rsiOB=70, rsiFall=65, volLen=20, volMult=1.5, lookbackBars=5, ema200 band (−5…+2%), thrLong/thrShort, toggles for Bottom/Top. Timeframes & tips Best on Daily/4H. Tighten thresholds (e.g., 4) and raise volume multiplier (1.8–2.0×) on lower TFs or thin liquidity. No-repaint note Evaluated on bar close; pivot divergences confirm with a natural ~3-bar delay. Disclaimer Educational use only. Not financial advice. Tags: reversal, divergence, rsi, macd, ema, volume, trend, screener, stocks, crypto, bist 2) Bottom-only (Dip) Title: Bottom Reversal Radar — Berk v1.4 Description (EN): Purpose Scores bottoming conditions and triggers when Score ≥ Threshold (default 3). Components RSI recovery after oversold (30→35), MACD bull cross, close above EMA8, BOS above recent swing high, near-EMA200 band (−5…+2%), volume ≥ SMA(20)×1.5, and pivot-confirmed (3/3) bullish RSI divergence. Weights: RSI +2, Divergence +2, others +1. Usage Add to chart, set alert “Dipten Dönüş — Ana Sinyal”, Once per bar close. Works on any timeframe (need ≥200 bars for EMA200). Daily/4H recommended. No-repaint Bar-close evaluation; divergence confirms with ~3 bars. Tags: bottom, reversal, rsi, macd, ema, volume, divergence 3) Top-only (Tepe) Title: Top Reversal Radar — Berk v1.0 Description (EN): Purpose Detects topping risk and triggers when Score ≥ Threshold (default 3) for exits/hedges. Components RSI roll-over from overbought (70→65), MACD bear cross, close below EMA8, BOS below recent swing low, near-EMA200 band, volume ≥ SMA(20)×1.5, and pivot-confirmed (3/3) bearish RSI divergence. Weights: RSI +2, Divergence +2, others +1. Usage Add to chart, set alert “Tepeden Dönüş — Ana Sinyal”, Once per bar close. Daily/4H preferred; tighten thresholds on lower TFs. No-repaint Bar-close evaluation; divergence confirms with ~3 bars. Tags: top, reversal, rsi, macd, ema, volume, divergencePine Script®指標由berkyuo2提供30
Quarterly Midpoint ScreenerIndicator will identify stocks above the 50 Percent of quarterly candlePine Script®指標由smiley1963提供5
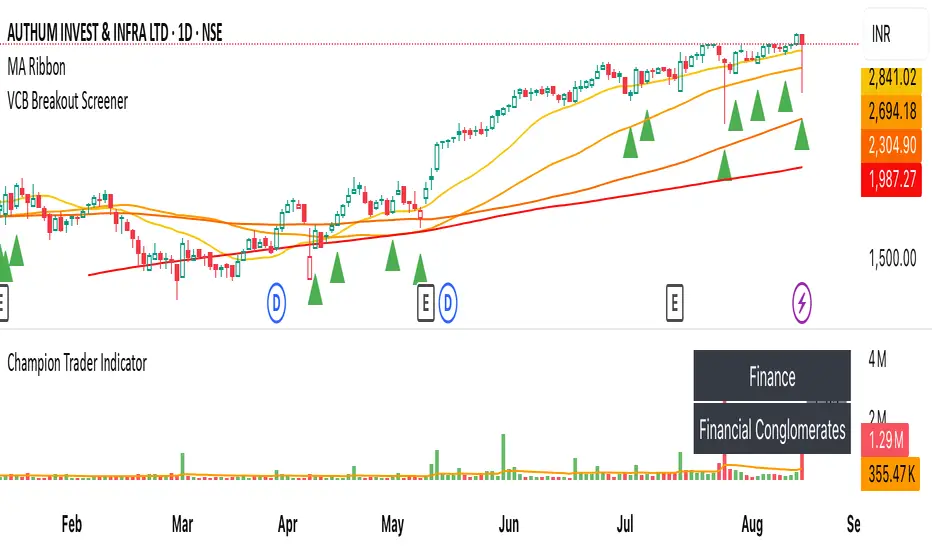
VCB Breakout Screener -PrajaktVCP Breakout Scanner 🔹 How it works ✅ Checks liquidity (vol * price > 100Cr). ✅ Ensures price > SMA50 and SMA100 or SMA200. ✅ ATR filter (short-term > 85% of longer-term). ✅ Price near 40–70% range of the candle. ✅ PGO (close vs SMA/ATR) < 2.5. ✅ RSI(7) < 60. ✅ Plots a green triangle below candles that qualify. ✅ You can set alerts with VCB Breakout condition met!.Pine Script®指標由prajaktk提供已更新 12
Confluence HunterUnlock powerful trade setups with our custom BBWP + RSI Oversold Screener! This indicator combines Bollinger Band Width Percentile (BBWP) to detect periods of extreme low volatility with RSI oversold signals, helping you pinpoint high-probability breakout opportunities before they happen. When the market’s energy is compressed and price is sitting in oversold territory, it often signals a sharp move is coming—this tool lets you spot those moments instantly. Perfect for swing traders and crypto scalpers who want to catch explosive moves early, it’s your edge in spotting volatility squeezes before the crowd. Pine Script®指標由murray_kerr提供6
EMA Cross Approach ScreenerWorks best on D/4H. Signals when the price of a stock is below the 200ema and the 9 and 20 are sloping up approaching the 200 while being 5% or less than from the 200. Helps the trader find a good buying point while keeping risk minimum.Pine Script®指標由SuigetsuPain提供7
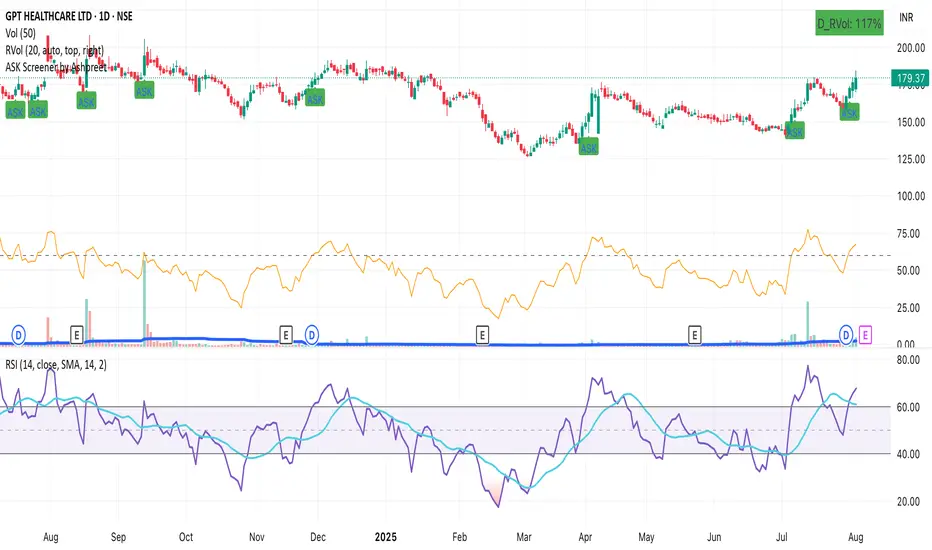
ASK Screener by AshpreetThe ASK Indicator is a custom-built breakout and trend continuation system designed for swing traders seeking high-probability entries with strong risk-reward ratios. Built using a combination of moving averages, momentum filters, volume confirmation, and price structure, this indicator helps identify stocks poised for explosive moves. It uses three key moving averages: the 44-period SMA (medium trend), 20-period DEMA (short-term strength, custom-coded), and 50-period WEMA (institutional trendline). Trades are only triggered when the price is above 50 WEMA, and the 20 DEMA is above the 44 SMA. Momentum is confirmed using RSI(14) within a healthy zone of 40–60, ensuring the stock is not overbought or oversold. To focus on breakout candidates, the stock must be trading within 10% of its 52-week high, and the weekly candle range must be under 10%, signaling compression before expansion. A valid ASK Signal occurs when these conditions are met along with a breakout above the previous day’s high and volume exceeding 1.5× the 20-day average. Once triggered, the indicator auto-plots the stop-loss (1× ATR) and two profit targets: 1:2 (TP1) and 1:4 (TP2). Additionally, the system detects a narrow range setup, where the last 3 daily candles are inside the previous 3-day range — a powerful consolidation signal. Alerts for both ASK entries and narrow ranges are included. This system is ideal for positional and short-term swing traders who want to combine structure, momentum, and volume in one powerful tool.Pine Script®指標由ASKTraderKing13提供8
Open Interest Screener (Fixed Zones)📌 Purpose This indicator scans Open Interest (OI) changes across selected exchanges and highlights significant spikes or drops directly on the chart using dynamic shaded zones. It is designed to help traders detect unusual market positioning changes that may precede volatility events. 🧠 How It Works 1. Data Sources Supports multiple exchanges: BitMEX USD, BitMEX USDT, Kraken USD (toggle on/off in settings). Automatically adapts symbol prefix based on the chart’s base asset. 2. Spike / Drop Detection OI % Change is calculated over a configurable lookback (Bars to look back). Spike Up: OI increases by more than Threshold %. Spike Down: OI decreases by more than Threshold %. 3. Dynamic Zones When a spike occurs, a green zone (increase) or red zone (decrease) is drawn on the chart. Zone height is dynamic, based on price high/low ± 5%, preventing chart distortion. Minimum spacing (Zone Spacing) prevents clustering. 📈 How to Use Green Zones: Large OI increase can signal fresh positioning (possible breakout setups). Red Zones: Large OI decrease can signal liquidation events or position unwinds. Combine with price action, funding rates, or volatility measures for higher confidence. Recommended Timeframes: Works best on 15m, 1h, 4h. Markets: Crypto derivatives (OI data available). ⚙️ Inputs Bars to Look Back OI % Change Threshold Zone Width Exchange toggles (BitMEX USD/USDT, Kraken USD) ⚠️ Disclaimer This script is for educational purposes only and does not constitute financial advice. Always test thoroughly before live trading. Pine Script®指標由artemka3091提供26
IDKFAIDKFA - Advanced Order Blocks & Volume Profile with Market Structure Analysis Why IDKFA? Named after the legendary DOOM cheat code that gives players "all weapons and full ammo," IDKFA provides traders with a comprehensive arsenal of market analysis tools. Just as the cheat code arms players with everything needed for combat, this indicator equips traders with essential market structure tools: Order Blocks, Volume Profile, LVN/HVN areas, Fibonacci retracements, and intelligent buy/sell signals - all in one unified system. Core Features Order Blocks Detection Automatically identifies institutional order blocks using pivot high/low analysis Extends blocks dynamically until price interaction occurs Bullish blocks (demand zones) and bearish blocks (supply zones) Customizable opacity and extend functionality Advanced Volume Profile Real-time volume profile calculation for multiple session types Point of Control (POC), Value Area High (VAH), and Value Area Low (VAL) Mode 1: Side-by-side bull/bear volume display Mode 2: Overlapped volume display with percentage analysis Shows buying vs selling pressure at each price level LVN/HVN Area Detection Low Volume Nodes (LVN): Areas below VAL where price moves quickly High Volume Nodes (HVN): Areas above VAH with strong resistance NPOC (Naked Point of Control): Single print areas within Value Area Volume-based gradient coloring shows relative activity levels Smart Fibonacci Retracements Auto-detects trend direction for proper fibonacci orientation Dynamic color coding: Red levels in uptrends, Gold in downtrends Special 88.6% level turns lime green in downtrends Key levels: 23.6%, 38.2%, 50%, 61.8%, 65%, 78.6%, 88.6% Intelligent Signal System Works best on higher timeframes Identifies high-probability reversal setups at key levels Buy signals: Large bearish rejection followed by bullish reclaim Sell signals: Large bullish rejection followed by bearish breakdown Signals only trigger near significant support/resistance areas Signal Analysis & Usage Guidelines Buy Signal Mechanics The buy signal triggers when: Previous candle shows significant bearish movement (minimum ATR multiplier) Current candle reclaims a configurable percentage of the previous candle's range Price is near a key support level (order blocks, fibonacci, volume levels) Sell Signal Mechanics The sell signal triggers when: Previous candle shows significant bullish movement (minimum ATR multiplier) Current candle rejects below a configurable percentage of the previous candle's range Price is near a key resistance level (order blocks, fibonacci, volume levels) When to TAKE Signals High Probability Buy Signals: Signal appears AT or BELOW the VAL (Value Area Low) Signal occurs at bullish order block confluence Price is in LVN area below VAL (momentum acceleration zone) Signal aligns with fibonacci 61.8% or 78.6% support Multiple session POC levels provide support confluence Previous session's VAL acting as current support High Probability Sell Signals: Signal appears AT or ABOVE the VAH (Value Area High) Signal occurs at bearish order block confluence Price is in HVN area above VAH (heavy resistance zone) Signal aligns with fibonacci 61.8% or 78.6% resistance Multiple session POC levels provide resistance confluence Previous session's VAH acting as current resistance When to AVOID Signals Avoid Buy Signals When: Signal appears ABOVE the VAH (buying into resistance) Price is in HVN red zones (high volume resistance areas) No clear support structure below current price Volume profile shows heavy selling pressure (high bear percentages) Signal occurs during low-volume periods between major sessions Multiple bearish order blocks exist below current price Avoid Sell Signals When: Signal appears BELOW the VAL (selling into support) Price is in LVN green zones (momentum could continue) No clear resistance structure above current price Volume profile shows heavy buying pressure (high bull percentages) Signal occurs during Asian session ranges without clear direction Multiple bullish order blocks exist above current price Volume Profile Context for Signals Understanding Bull/Bear Percentages: 70%+ Bull dominance at a level = Strong support expected 70%+ Bear dominance at a level = Strong resistance expected 50/50 Split = Neutral zone, less predictable Use percentages to gauge conviction behind moves POC (Point of Control) Interactions: Signals above POC in uptrend = Higher probability Signals below POC in downtrend = Higher probability Signals against POC bias require extra confirmation POC often acts as magnetic level for price return Trading Strategies Strategy 1: VAL/VAH Bounce Strategy Wait for price to approach VAL (support) or VAH (resistance) Look for signal confirmation at these critical levels Enter with tight stops beyond the Value Area Target opposite boundary or next session's levels Strategy 2: Order Block + Volume Confluence Identify order block alignment with VAL/VAH Wait for signal within the confluence zone Enter on signal with stop beyond order block Use LVN areas as acceleration zones for targets Strategy 3: LVN/HVN Strategy LVN (Green) Areas: "Go Zones" - expect quick price movement through low volume HVN (Red) Areas: "Stop Zones" - expect resistance and potential reversals NPOC Areas: "Fill Zones" - price often returns to fill single print gaps Strategy 4: Multi-Session Analysis Use Daily/Weekly for major structure context Use 4H for intermediate levels Use 1H for precise entry timing Ensure all timeframes align before taking signals Strategy 5: Fibonacci + Volume Profile Buy signals at 61.8% or 78.6% fibonacci near VAL Sell signals at 61.8% or 78.6% fibonacci near VAH Use 88.6% level as final support/resistance before major moves 50% level often aligns with POC for confluence Signal Quality Assessment Grade A Signals (Highest Probability): Signal at VAL/VAH with order block confluence Fibonacci level alignment (61.8%, 78.6%) Volume profile shows 70%+ dominance in signal direction Multiple timeframe structure alignment Signal occurs during high-volume sessions (London/NY) Grade B Signals (Moderate Probability): Signal near POC with some confluence Fibonacci 50% or 38.2% alignment Mixed volume profile readings (50-70% dominance) Some timeframe alignment present Signal during overlap sessions Grade C Signals (Lower Probability): Signal with minimal confluence Weak fibonacci alignment or none Volume profile neutral or against signal Conflicting timeframe signals Signal during low-volume periods Risk Management Guidelines Position Sizing Based on Signal Quality: Grade A: Standard position size Grade B: Reduced position size (50-75%) Grade C: Minimal position size (25%) or skip entirely Stop Loss Placement: Beyond order block boundaries Outside Value Area (VAL/VAH) Below/above fibonacci confluence levels Account for session volatility ranges Profit Targets: First target: Opposite VAL/VAH boundary Second target: Next session's key levels Final target: Major order blocks or fibonacci extensions Credits & Attribution Original components derived from: Market Sessions & Volume Profile by © Leviathan (Mozilla Public License 2.0) Volume Profile elements inspired by @LonesomeTheBlue's volume profile script Pivot Order Blocks by TradingWolf / © MensaTrader (Mozilla Public License 2.0) Auto Fibonacci Retracement code (public domain) Significant enhancements and modifications include: Advanced LVN/HVN detection and visualization Bull/Bear percentage analysis for Mode 2/3 Comprehensive alert system with market context Integrated buy/sell signals at key levels Performance optimizations and extended session support Enhanced Mode 2/3 with percentage pressure analysis Important Disclaimers This indicator is a technical analysis tool designed for educational purposes. It does not provide financial advice, investment recommendations, or trading signals that guarantee profits. All trading involves substantial risk of loss, and past performance does not guarantee future results. Users should conduct their own research, understand the risks involved, and consider consulting with qualified financial advisors before making trading decisions. The signals and analysis provided are based on historical price patterns and volume data, which may not predict future market movements accurately. Best Practices Never trade signals blindly - always consider volume profile context Wait for confluence between multiple tools before entering Respect the Value Area - avoid buying above VAH or selling below VAL Use session context - Asian ranges vs London/NY breakouts Practice proper risk management - position size based on signal quality Understand the bigger picture - use multiple timeframes for context Remember: Like the IDKFA cheat code, having all the tools doesn't guarantee success. The key is learning to use them together effectively and understanding when NOT to take a signal is often more important than knowing when to take one.Pine Script®指標由MessyJess提供已更新 77832
ATR Screener with Labels and ShapesWeekly Daily ATR Pine Scanner To find out tightness or contraction in a stock we needs to check if volatality is decreasing as well as compared to previous 14 or 10 bars volatility . we check this for weekly and then for Daily , so that we can enter in a stock which is tightest in recent times. Condition is : 1. Weekly Candle ATR x 0.8 < 10 Week ATR 2. Daily Candle ATR x 0.6 < 14 Day ATR When both of the conditions are met then they signifies that the stock has tightened in weekly and daily aswell . so now we can find ways to enter during max squeeze. How to scan in Pine Scanner ? FIrst add indicator as favourite and Go to pine scanner page in trading view and then scan your watchlist and there you will see 3 columns 1 with only Weekly conditions met , 2 with only Daily and 3rd with Both conditions met . Select stocks and move to new watchlist and now you have those stocks which has contracted the most in recent times .Pine Script®指標由RohitNain提供28
Golden Crossover Momentum Check📊 Golden Cross Momentum Screener — Summary 🔍 What It Does This indicator identifies Golden Cross events — where the 50 EMA crosses above the 200 EMA, signaling a potential long-term trend reversal — and evaluates the momentum strength to help determine whether price is likely to: Surge immediately (Group B), or Retrace first (Group A) It uses 5 momentum-confirming conditions to score the quality of the breakout and display a single label on the chart with a classification. ✅ Momentum Conditions Validated RSI > 60 and rising – Indicates bullish buying pressure MACD Histogram > 0 and rising – Confirms increasing momentum Volume > 2× 20-day average – Validates participation on the breakout ADX > 25 – Measures trend strength Price is >5% above 200 EMA – Confirms price extension above long-term trend Each passing condition adds 1 point to the momentum score (0–5). 📈 How to Use Watch for a Golden Cross signal (triangle appears below candle) If momentum score ≥ 4, the script labels the setup as: "🚀 Surge Likely (Group B)" — consider immediate breakout entries If score is 2–3, labeled: "🔄 Pullback Likely (Group A)" — expect retest/consolidation before continuation If score < 2, labeled: "❌ No Momentum Confirmed" — avoid or wait for confirmationPine Script®指標由AlgoNostra提供已更新 36
5EMA_BB_ScalpingWhat? In this forum we have earlier published a public scanner called 5EMA BollingerBand Nifty Stock Scanner , which is getting appreciated by the community. That works on top-40 stocks of NSE as a scanner. Whereas this time, we have come up with the similar concept as a stand-alone indicator which can be applied for any chart, for any timeframe to reap the benifit of reversal trading. How it works? This is essentially a reversal/divergence trading strategy, based on a widely used strategy of Power-of-Stocks 5EMA. To know the divergence from 5-EMA we just check if the high of the candle (on closing) is below the 5-EMA. Then we check if the closing is inside the Bollinger Band (BB). That's a Buy signal. SL: low of the candle, T: middle and higher BB. Just opposite for selling. 5-EMA low should be above 5-EMA and closing should be inside BB (lesser than BB higher level). That's a Sell signal. SL: high of the candle, T: middle and lower BB. Along with we compare the current bar's volume with the last-20 bar VWMA (volume weighted moving average) to determine if the volume is high or low. Present bar's volume is compared with the previous bar's volume to know if it's rising or falling. VWAP is also determined using `ta.vwap` built-in support of TradingView. The Bolling Band width is also notified, along with whether it is rising or falling (comparing with previous candle). What's special? We love this reversal trading, as it offers many benifits over trend following strategies: Risk to Reward (RR) is superior. It _Does Hit_ stop losses, but the stop losses are tiny. Means, althrough the Profit Factor looks Nahh , however due to superior RR, end of day it ended up in green. When the day is sideways, it's difficult to trade in trending strategies. This sort of volatility, reversal strategies works better. It's always tempting to go agaist the wind. Whole world is in Put/PE and you went opposite and enter a Call/CE. And turns out profitable! That's an amazing feeling, as a trader :) How to trade using this? * Put any chart * Apply this screener from Indicators (shortcut to launch indicators is just type / in your keyboard). * It will show you the Green up arrow when buy alert comes or red down arrow when sell comes. * Also on the top right it will show the latest signal with entry, SL and target. Disclaimer * This piece of software does not come up with any warrantee or any rights of not changing it over the future course of time. * We are not responsible for any trading/investment decision you are taking out of the outcome of this indicator. Pine Script®指標由pradipandsuvra提供2290
SuperTrend Confluence Signals [AlgoAlpha]OVERVIEW This script enhances the classic SuperTrend indicator by integrating volume dynamics, retracement detection, and a multi-asset trend matrix—alongside an automatic mitigation-level drawing system. It's designed for traders who want to see not just trend direction, but the confluence of trend strength, volatility-adjusted retracements, and capital flow through volume pressure. It visually maps key transitions in market structure while offering a clean, color-coded overview of multiple symbols and timeframes in a single chart. CONCEPTS At the core is the traditional SuperTrend , which determines directional bias using Average True Range (ATR) with a volatility multiplier. This script overlays that with a dynamic volume histogram that scales relative to recent volume standard deviation, coloring volume bursts within the trend. Retracement signals are triggered when price pulls back toward the SuperTrend level but respects it—quantified through normalized distance sensitivity. On top of that, the indicator automatically draws and manages horizontal support/resistance zones that appear at key trend shifts. These levels persist and are cleared based on configurable rules such as wick/body sweeps or consecutive candle closes. A multi-asset, multi-timeframe table then gives an instant snapshot of trend status across five user-defined symbols and timeframes. FEATURES SuperTrend : Configurable ATR length and multiplier for flexible trend sensitivity. Volumetric Histogram : Gradient-filled candles anchored to SuperTrend bands, scaled by relative volume to indicate activity intensity during trends. Retracement Arrows : Signals printed when price nears the SuperTrend level without breaking it, allowing identification of high-probability continuation zones. Volume TP Markers : Diamond markers flag high-volume events, contextualizing price moves with liquidity bursts. Automatic Structure Levels : Draws clean horizontal lines at significant trend transitions, with optional volatility-based band fills. These levels self-update and clear based on price interaction logic. Trend Table : Displays trend direction (▲/▼) across five assets and five timeframes. Each cell is colored according to trend bias, providing a compact overview for multi-market confluence. USAGE Start by loading the indicator on your main chart and adjusting the ATR Length and Multiplier to match your strategy timeframe. Use lower values for scalping and higher values for swing trading. The histogram bars will appear as colored candles above or below the SuperTrend level, indicating how strong volume is within that trend. Arrow signals suggest minor pullbacks within the trend, which can act as entry opportunities. The level system will automatically plot key price zones during trend flips; if "Body" is selected for mitigation, price must close through the level to invalidate it. If "Wick" is chosen, a single wick breach is enough. Adjust expiry and rejection settings to fine-tune how long levels stay on chart. Finally, enable the Multi-Asset Table to view live trend signals across popular symbols like AAPL or NVDA in different timeframes, helping spot macro-to-micro alignment for higher-confidence trades.Pine Script®指標由AlgoAlpha提供已更新 2121 2.9 K
Consecutive Green Candles + 20% Move ScreenerConsecutive Green Candles Momentum Tracker This indicator identifies powerful bullish momentum streaks in stocks, highlighting opportunities where consistent buying pressure has driven significant price increases. The script tracks sequences of consecutive green (bullish) candles that collectively move a stock's price by more than 20%. It marks both the beginning of such streaks with a green label and their conclusion with a red arrow when price momentum finally reverses. Perfect for traders looking to: - Identify stocks experiencing strong directional momentum - Spot potential reversal points after extended rallies - Screen for securities with recent bullish strength - Understand the magnitude of recent price runs Simply adjust the minimum number of candles and percentage threshold to match your preferred momentum criteria.Pine Script®指標由eggubonda提供已更新 63
Absorption Lines Basic Indicator: Green support lines and red resistance lines will appear on your chart Numbers 1-7 will show up as triangles above and below bars Green triangles below bars are sell signals Red triangles above bars are buy signals For Scanning: In TradingView's Stock Screener, add a custom filter using this indicator Look for "New Level", "Signal Number", or "Bar Close At Level" conditions For specific signals, use "Buy Signal X" or "Sell Signal X" (where X is 1-7) For Alerts: Set up alerts using the three alert conditions in TradingView You'll be notified when new lines are printed, when bars close at levels, or when signals appearPine Script®指標由asharma77300提供1157
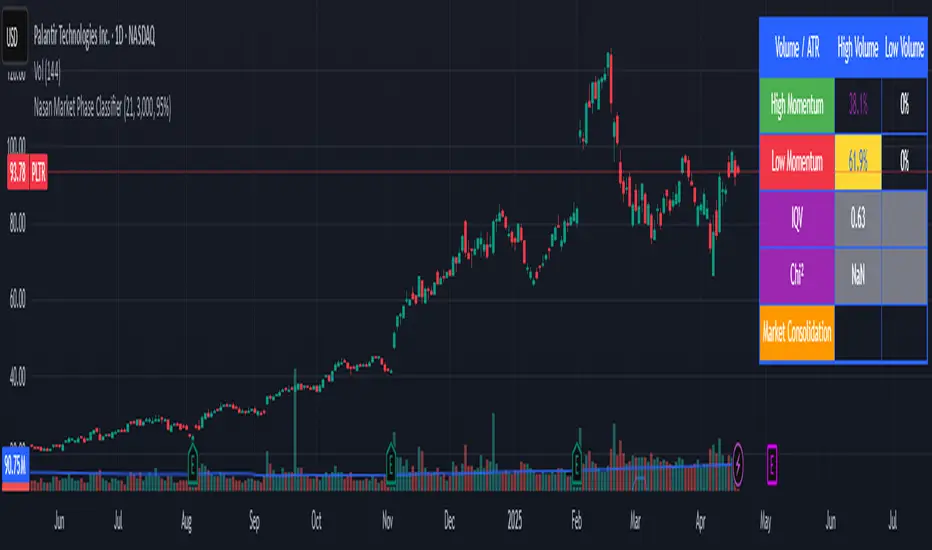
Nasan Market Phase ClassifierThe Nasan Market Phase Classifier indicator designed to classify market phases using volume, volatility (or momentum), and statistical analysis. Here's a summary of how it works and what it does: 🔍 Core Concept This indicator classifies the market into four phases based on volume and ATR (or optionally momentum): High Volume / High ATR or Momentum (HV/HATR): Strong Trend Low Volume / High ATR or Momentum (LV/HATR): False Breakout / Exhaustion High Volume / Low ATR or Momentum (HV/LATR): Consolidation Low Volume / Low ATR or Momentum (LV/LATR): Stagnation ⚙️ Key Settings Short-Term Length: Used for the active market phase. Long-Term Length: Used as the expected/benchmark distribution. Use Momentum: Replaces volatility (ATR) with momentum (custom ROC-based formula). Use Fixed Alpha: Toggles adaptive vs. fixed weighting in scoring (this is based on variation of the volatility - standard deviation of true range). 📊 How It Works Volatility or Momentum Scoring: Uses ATR-based or Momentum-based score depending on the setting. Applies weighing (alpha) which is based on variability of the volatility itself. Market Phase Count: Measures how often each of the 4 volume/volatility combinations occur in: Short-term window (observed phase) Long-term window (expected distribution) Category Proportions: Calculates percentage share of each category (e.g., % time in HV/HATR). Plots these on chart to visually see market phase dominance (can be used for screening of pine screener). Statistical Testing: IQV (Index of Qualitative Variation): Measures phase diversity (0 = focused, 1 = mixed). Chi-Squared Test: Compares current vs. historical phase distribution. Z-Test: Tests if current phase dominance is statistically significant. 📋 Outputs On-Chart Plots and Tabels: Strong Trend, False Breakout/Exhaustion, Consolidation, Stagnation Strength Quality Plot: Trend strength normalized by IQV. Dynamic Table (Top Right): Shows each phase’s proportion (the current phase cell is highlighted in yellow), IQV, Chi² value, and current dominant phase. The current candle classification (text) is in purple. Highlights the dominant phase classification and color-codes significance (the cell highlighted in green highly confident about the classification, orange intermediate confidence and red low confidence). This color coding is not just based on statistical significance it is based on IQV which takes into account how spread the proportions are. 🧠 Interpretation A dominant HV/HATR phase with low IQV and high Z-Score indicates a strong and statistically significant trend. High IQV suggests uncertainty or mixed market behavior. Chi² spike indicates a shift from historical behavior can be used to see is the market behavior changing by changing the long term length say to 252 and short term length to 21 this will tell if the short term behavior is different from the past 252 day behavior. Pine Script®指標由federalTacos5392b提供25