Moogroos session time linesthree session times plus 3 custom times where a line (or background) is cyclically plotted.
在腳本中搜尋"session"
One Trading Setup for Life ICT [TradingFinder] Sweep Session FVG🔵 Introduction
ICT One Trading Setup for Life is a trading strategy based on liquidity and market structure shifts, utilizing the PM Session Sweep to determine price direction. In this strategy, the market first forms a price range during the PM Session (from 13:30 to 16:00 EST), which includes the highest high (PM Session High) and lowest low (PM Session Low).
In the next session, the price first touches one of these levels to trigger a Liquidity Hunt before confirming its trend by breaking the Change in State of Delivery (CISD) Level. After this confirmation, the price retraces toward a Fair Value Gap (FVG) or Order Block (OB), which serve as the best entry points in alignment with liquidity.
In financial markets, liquidity is the primary driver of price movement, and major market participants such as institutional investors and banks are constantly seeking liquidity at key levels. This process, known as Liquidity Hunt or Liquidity Sweep, occurs when the price reaches an area with a high concentration of orders, absorbs liquidity, and then reverses direction.
In this setup, the PM Session range acts as a trading framework, where its highs and lows function as key liquidity zones that influence the next session’s price movement. After the New York market opens at 9:30 EST, the price initially breaks one of these levels to capture liquidity.
However, for a trend shift to be confirmed, the CISD Level must be broken.
Once the CISD Level is breached, the price retraces toward an FVG or OB, which serve as optimal trade entry points.
Bullish Setup :
Bearish Setup :
🔵 How to Use
In this strategy, the PM Session range is first identified, which includes the highest high (PM Session High) and lowest low (PM Session Low) between 13:30 and 16:00 EST. In the following session, the price touches one of these levels for a Liquidity Hunt, followed by a break of the Change in State of Delivery (CISD) Level. The price then retraces toward a Fair Value Gap (FVG) or Order Block (OB), creating a trading opportunity.
This process can occur in two scenarios : bearish and bullish setups.
🟣 Bullish Setup
In a bullish scenario, the PM Session High and PM Session Low are identified. In the following session, the price first breaks the PM Session Low, absorbing liquidity. This process results in a Fake Breakout to the downside, misleading retail traders into taking short positions.
After the Liquidity Hunt, the CISD Level is broken, confirming a trend reversal. The price then retraces toward an FVG or OB, offering an optimal long entry opportunity.
The initial take-profit target is the PM Session High, but if higher timeframe liquidity levels exist, extended targets can be set.
The stop-loss should be placed below the Fake Breakout low or the first candle of the FVG.
🟣 Bearish Setup
In a bearish scenario, the market first defines its PM Session High and PM Session Low. In the next session, the price initially breaks the PM Session High, triggering a Liquidity Hunt. This movement often causes a Fake Breakout, misleading retail traders into taking incorrect positions.
After absorbing liquidity, the CISD Level breaks, indicating a shift in market structure. The price then retraces toward an FVG or OB, offering the best short entry opportunity.
The initial take-profit target is the PM Session Low, but if additional liquidity exists on higher timeframes, lower targets can be considered.
The stop-loss should be placed above the Fake Breakout high or the first candle of the FVG.
🔵 Setting
CISD Bar Back Check : The Bar Back Check option enables traders to specify the number of past candles checked for identifying the CISD Level, enhancing CISD Level accuracy on the chart.
Order Block Validity : The number of candles that determine the validity of an Order Block.
FVG Validity : The duration for which a Fair Value Gap remains valid.
CISD Level Validity : The duration for which a CISD Level remains valid after being broken.
New York PM Session : Defines the PM Session range from 13:30 to 16:00 EST.
New York AM Session : Defines the AM Session range from 9:30 to 16:00 EST.
Refine Order Block : Enables finer adjustments to Order Block levels for more accurate price responses.
Mitigation Level OB : Allows users to set specific reaction points within an Order Block, including: Proximal: Closest level to the current price. 50% OB: Midpoint of the Order Block. Distal: Farthest level from the current price.
FVG Filter : The Judas Swing indicator includes a filter for Fair Value Gap (FVG), allowing different filtering based on FVG width: FVG Filter Type: Can be set to "Very Aggressive," "Aggressive," "Defensive," or "Very Defensive." Higher defensiveness narrows the FVG width, focusing on narrower gaps.
Mitigation Level FVG : Like the Order Block, you can set price reaction levels for FVG with options such as Proximal, 50% OB, and Distal.
Demand Order Block : Enables or disables bullish Order Block.
Supply Order Block : Enables or disables bearish Order Blocks.
Demand FVG : Enables or disables bullish FVG.
Supply FVG : Enables or disables bearish FVGs.
Show All CISD : Enables or disables the display of all CISD Levels.
Show High CISD : Enables or disables high CISD levels.
Show Low CISD : Enables or disables low CISD levels.
🔵 Conclusion
The ICT One Trading Setup for Life is a liquidity-based strategy that leverages market structure shifts and precise entry points to identify high-probability trade opportunities. By focusing on PM Session High and PM Session Low, this setup first captures liquidity at these levels and then confirms trend shifts with a break of the Change in State of Delivery (CISD) Level.
Entering a trade after a retracement to an FVG or OB allows traders to position themselves at optimal liquidity levels, ensuring high reward-to-risk trades. When used in conjunction with higher timeframe bias, order flow, and liquidity analysis, this strategy can become one of the most effective trading methods within the ICT Concept framework.
Successful execution of this setup requires risk management, patience, and a deep understanding of liquidity dynamics. Traders can enhance their confidence in this strategy by conducting extensive backtesting and analyzing past market data to optimize their approach for different assets.

Sessions By SaintSessions indicator for traders wanting to look for breakouts early. This tool will help you differentiate between Tokyo, London, New York and Sydney sessions on a daily basis with the option of a daily high and low view.

Market Sessions Open/Close LevelsThis indicator displays the market open and close price levels for the main trading sessions (Sydney, Tokyo, Frankfurt, London and New York). The Daily Line changes color depending on if price is trading above or below the level. Feel free to add or replace levels depending on your trading style and trading times.


Sum and Subtract Hours and Minutes to Sessions SampleThis indicators it's a programming sample of how to sum and subtract hours and minutes to sessions on Tradingview

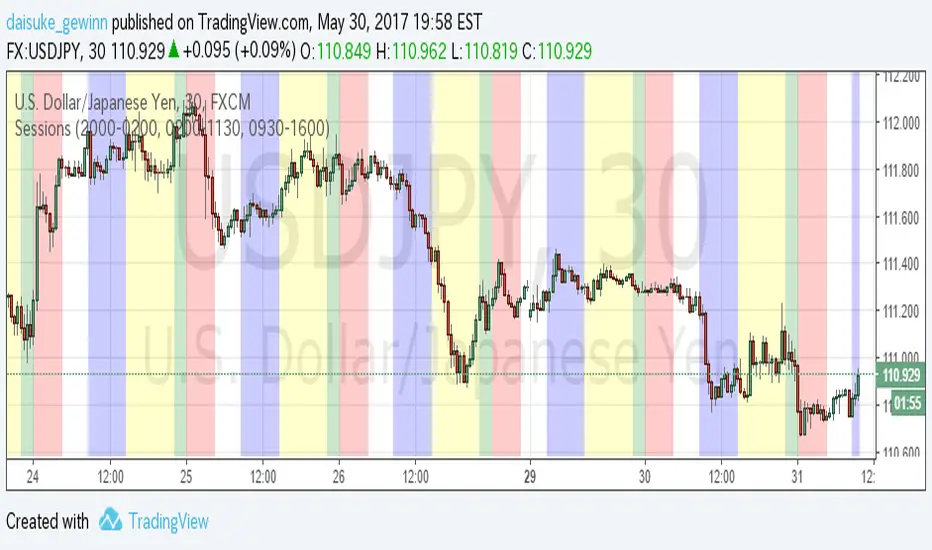
Time Sessions for FXCMThis indicator show Japan, EU and USA sessions for Currency.
The default parameters setting for FXCM summer time.(UTC-4)
英語の意味があっているか自信がないため、日本語でも書いておきます。
Trading Viewの通貨チャートで日本時間、EU時間、アメリカ時間を表示するインジケータです。
夏時間の自動判別などは入れていません。デフォルト設定はFXCMのUTC-4に合わせています。
もっと汎用的に作りたかったのですが、すごく面倒な感じになってしまったので、まずシンプルに
作成しました。
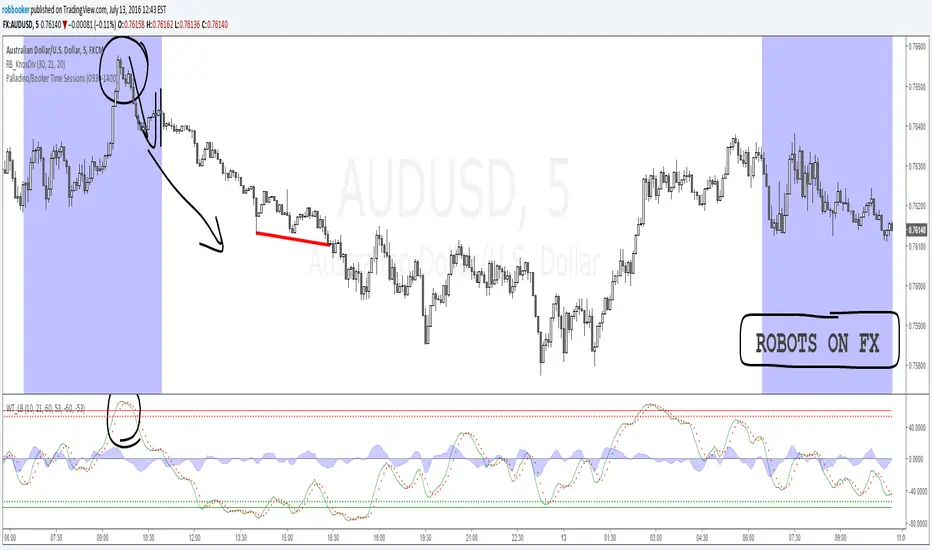
Palladino/Booker Time SessionsThe Palladino/Booker Time Sessions script will allow you to highlight certain periods of time during the day that are best suited to your trading. Add the script to your chart as many times as you like to highlight as many Time Sessions as you like.
Session Fibonacci Tracker with Dynamic Range FreezeSession Fibonacci Tracker with Dynamic Range Freeze
This indicator plots Fibonacci retracement and extension levels based on session high/low ranges with a unique "freeze" mechanism that locks levels during volatility and recalculates only when price returns to the established range.
How It Works:
The indicator uses a three-stage process to maintain stable Fibonacci levels:
Range Establishment: At the start of each session (default 1800 ET), the indicator tracks the session high and low. Fibonacci levels are calculated with dynamic anchoring - when price is above the session open, 0 anchors at the high with 1 at the low; when below, 0 anchors at the low with 1 at the high.
Freeze Mechanism: Once the range is established, it immediately freezes. If a candle closes outside this range, the Fibonacci levels remain locked at their current values even as new session highs or lows form. This prevents levels from constantly recalculating during trending moves.
Recalculation: The frozen range only updates when price action (high or low) touches back inside the established range. At this point, levels recalculate based on the current session high/low, then freeze again.
Key Features:
Customizable Fibonacci levels: All retracement (0.236, 0.382, 0.500, 0.618, 0.786) and extension levels (-1.0, -0.618, -0.272, 1.272, 1.618, 2.0) can be enabled/disabled and adjusted to custom values
Time-based line extension prevents historical buffer overflow errors
Works across all timeframes
Session start time fully customizable
Visual status indicator shows whether levels are frozen or active
All lines and labels are fully customizable (colors, width, labels, prices)
Use Cases:
This indicator is particularly useful for traders who want stable reference levels during volatile periods. Traditional Fibonacci tools recalculate with every new extreme, making them difficult to use as support/resistance during trends. This implementation keeps levels stable until price returns to consolidation, providing consistent reference points for entries, exits, and stop placement.
Settings:
Session Settings: Configure session start time (default 1800 ET)
Fibonacci Levels: Enable/disable and customize each retracement level value
Extension Levels: Enable/disable and customize each extension level value
Visual Settings: Adjust line extension, width, labels, and price display
Colors: Customize colors for open line, 0 level, 1 level, retracements, and extensions

Extended Session High/Low - Intraday and daily chartsThis script plots the extended session highest high and lowest low levels. It works on any time frame from 1 minute to daily.
Please note that during the extended session, TradingView stops updating the daily chart. This means that once the script is loaded on a daily chart, it will not be updated until the market opens, unless you manually reload the layout (Ctrl+R). For this reason, it is recommended to use a multi-timeframe layout, so when the pre/post market line is near the extended session high/low on the daily chart, you can compare these values with those on an intraday chart of the same ticker.
The extended session high/low are important for day traders because they represent the maximum and minimum limits within which the trades have taken place during the extended trading hours. This can make them levels of support/resistance that can be useful for planning trend following, reversal and range-bound strategies.
By displaying the extended session high/low on the daily chart, traders can also see if there are any significant levels nearby that are related to the daily time frame, such as trendlines, support/resistance levels, or moving averages. This can help the trader evaluate whether there is enough room for a price movement in the direction of his trading strategy.

ARX Killzone Session Flags (UK)This script provides minimal session time flags for London and New York, designed to offer time-based context only.
It marks the start and end of predefined session windows using small, non-intrusive labels directly on the chart.
The script automatically adjusts for UK daylight saving time (GMT / BST) using the Europe/London timezone, requiring no manual changes throughout the year.
This tool does not generate trade signals, does not analyse price, and does not provide execution guidance.
Educational and contextual use only.
Not financial advice.

Session Vertical Lines – WIB (Consistent)Session Line by farisradifana
Give the Session on Indonesian Time :
Asian Session : 6 A.M
London Session : 2 P.M
New York Session : 7 P.M

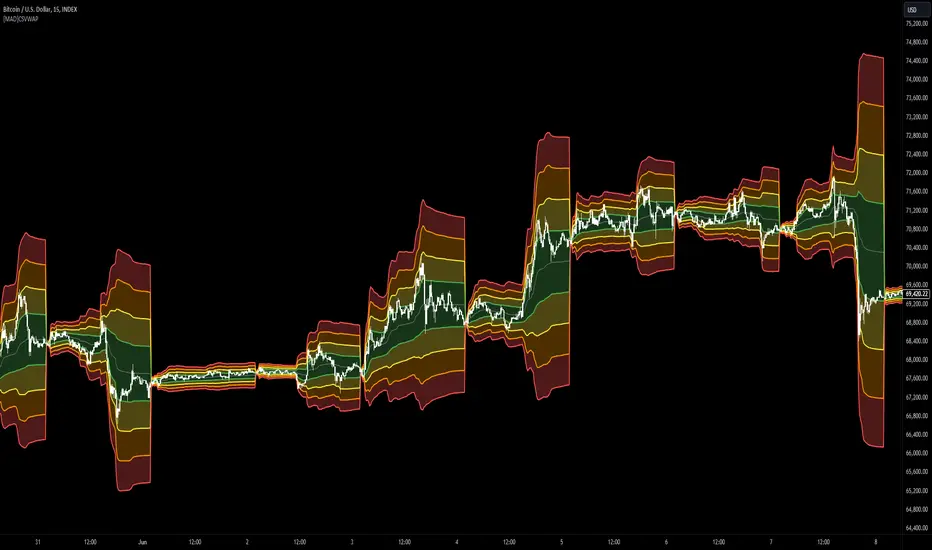
[MAD] Custom Session VWAP BandsOverview
This indicator helps visualize the Volume Weighted Average Price (VWAP) and its associated standard deviation bands over specified time periods, providing traders with a clear understanding of price trends, volatility, and potential support/resistance levels.
Inputs
Deviation
StDev mult 1: Multiplier for the first standard deviation band (Default: 1.0)
StDev mult 2: Multiplier for the second standard deviation band (Default: 2.0)
StDev mult 3: Multiplier for the third standard deviation band (Default: 3.0)
StDev mult 4: Multiplier for the fourth standard deviation band (Default: 4.0)
Line width: Width of the lines for the bands (Default: 2)
Custom Vwap session reset settings
Many different options are considered when a session is going to be reset.
Plot and Fill Options
Enable Fills: Enable/disable filling between bands.
Plot +4: Enable/disable plotting the +4 standard deviation band.
Plot +3: Enable/disable plotting the +3 standard deviation band.
Plot +2: Enable/disable plotting the +2 standard deviation band.
Plot +1: Enable/disable plotting the +1 standard deviation band.
Plot VWAP: Enable/disable plotting the VWAP line.
Plot -1: Enable/disable plotting the -1 standard deviation band.
Plot -2: Enable/disable plotting the -2 standard deviation band.
Plot -3: Enable/disable plotting the -3 standard deviation band.
Plot -4: Enable/disable plotting the -4 standard deviation band.
How to Use the Indicator
Adding the Indicator
Add the indicator to your chart through your trading platform's indicator menu.
Configuring the VWAP Reset
Specify reset intervals based on time, days of the week, or specific dates.
Adjust the time zone if necessary.
Customizing Standard Deviation Bands
Set the multipliers for the standard deviation bands.
Choose line width for better visualization.
Enabling Plots and Fills
Select which bands to display.
Enable or disable fills between the bands.
Practical Application of VWAP Bands
Understanding VWAP
VWAP is a trading benchmark that calculates the average price a security has traded at throughout the day based on volume and price. It is primarily used for intraday trading but can also offer insights during end-of-day reviews.
Using VWAP for Trading
Intraday Trading
Entry and Exit Points: VWAP can help identify optimal buy and sell points. Buy when the price is above VWAP and sell when it's below.
Support and Resistance: VWAP often acts as a dynamic support/resistance level. Prices tend to revert to VWAP, making it a crucial level for intraday traders.
Trend Confirmation
Uptrends and Downtrends: In an uptrend, the price will generally stay above VWAP. Conversely, in a downtrend, it will stay below. Use this to confirm market direction.
Combining with Other Indicators
Moving Averages and Bollinger Bands: Combining VWAP with these indicators can provide a more robust trading signal, confirming trends and potential reversals.
Setting Stop-Loss and Profit Targets
Conservative Stop Orders: Place stop orders at recent lows for pullback trades.
Profit Targets: Use daily highs or Fibonacci extension levels to set profit targets.
Strategies for Using VWAP
Pullback Strategy
Buy during pullbacks to VWAP in an uptrend, and sell during rallies to VWAP in a downtrend.
Breakout Strategy
Look for breakouts above/below VWAP after the market open to capitalize on new trends.
Momentum Trading
Use VWAP to confirm the strength of a trend. Buy when the price is consistently above VWAP and sell when it's consistently below.
Institutional Strategies
Institutional traders use VWAP to execute large orders without causing significant market impact, ensuring trades are made around the average price.
By incorporating these strategies, traders can better understand market dynamics, make informed trading decisions, and manage their risk effectively.
Some setup possibilities
Flexible timezone-aware session rangeAllows you to define session range with local time and its timezone, also can toggle session visibility any day of week.


Trading Session IndicatorFollowing time zones showing:
Asia Session - Red
London Open - White
London Session - Blue
NY Open - White

FxNeel Session (Lite)Here is light version. You can all types of ICT session like Asia, london, new york, Aisa kill zone, CBDR .
Happy trading. Please drop your feedback.

Session High-Low Box,
Session High-Low Box Session High-Low Box indicatorSession High-Low BoxSession High-Low BoxSession High-Low BoxSession High-Low BoxSession High-Low BoxSession High-Low BoxSession High-Low BoxSession High-Low BoxSession High-Low BoxSession High-Low BoxSession High-Low BoxSession High-Low BoxSession High-Low BoxSession High-Low BoxSession High-Low BoxSession High-Low BoxSession High-Low BoxSession High-Low BoxSession High-Low BoxSession High-Low BoxSession High-Low BoxSession High-Low Boxwrtvtrvwrtv4v2tr2Session High-Low Box24v2v2Session High-Low Box
Session times for London (UTC 07:00–16:00 UTC)Session times for London (UTC 07:00–16:00 UTC). Shows the trading hours for the London Session Mon-Fri

Forex Session High/Low TrackerThis indicator maps out each Forex session along with their relative highs and lows.
