Session TPO Market ProfileIntroduction
Wikipedia: A Market Profile is an intra-day charting technique (price vertical, time/activity horizontal) devised by J. Peter Steidlmayer, a trader at the Chicago Board of Trade (CBOT), ca 1959-1985. Steidlmayer was seeking a way to determine and to evaluate market value as it developed in the day time frame. The concept was to display price on a vertical axis against time on the horizontal, and the ensuing graphic generally is a bell shape--fatter at the middle prices, with activity trailing off and volume diminished at the extreme higher and lower prices. In this structure he recognized the 'normal', Gaussian distribution he had been introduced to in college statistics.
Important : The market profile tool is designed to be used on the 30min timeframe, however, you can modify its parameters and use it on lower timeframes (15/10/5min)
This indicators displays the following information
Session open
TPO
Value area calculation zone
POC
Highlight of Single prints
Session High/Low
The current price (TPO Profile is often used isolated without any candlesticks on it)
Parameters
Session beginning configuration (not coded with a session input yet)
Number of candles to use for calculation (default 13 for a single session)
Extend yesterday's levels (VAH/VAL/POC)
Show/Hide Market profile calculation area (background color)
Bars number (number of rows that will be used to draw the profile)
Show/Hide TPO's
TPO Colors customization (For in/out of VA, VAL/VAH/POC/High/Low levels and single prints)
Show/Hide High/Low levels
Show/Hide VAL/VAH/POC Levels as lines
Enable/Disable Single prints highlighting
Value area size (as percent)
Show/Hide current price (corresponding to a line scaled on the "close" price)
Additional Notes
Each session is drawn when the day is over
To use as much space as possible, TPO's are not directly drawn on the area of their calculation (which can be confusing if you use candlesticks directly over it)
This script will probably be updated in the future (especially concerning its implementation which is a bit spaghetti coded for now) .
If you have interesting suggestions about new features that are usual within market profile tools and missing from this script , don't hesitate to suggest it.
在腳本中搜尋"session"

Session Time Lines (NY Time)This clean indicator draws vertical dashed lines on the chart at key session times in New York time:
7:00 PM – Previous day session start
3:00 AM – Overnight session
9:30 AM – NY market open
It automatically removes the previous session’s lines when a new 7:00 PM occurs, keeping the chart clean. Lines are drawn directly on the price chart (overlay), making it easy to see market session transitions.
Works on intraday charts
Time-based vertical lines in New York time (DST-safe)
Shows only one cycle at a time for clarity
Non-intrusive, no calculations or trading signals

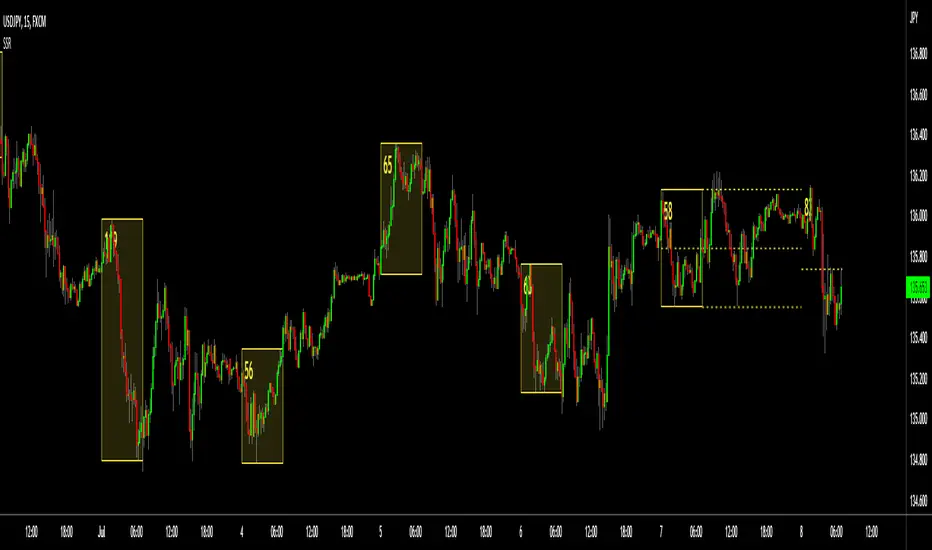
Session MidpointsGives you session time boxes and their midpoints.
Gives you session time boxes and their midpoints.
Gives you session time boxes and their midpoints.
Gives you session time boxes and their midpoints.
Gives you session time boxes and their midpoints.

Session OHLC (Daily-based)Displays the cash-session Open, High, Low, and Close levels on intraday charts using daily exchange data. Each trading day’s OHLC is marked with short color-coded lines for quick reference to session structure and key liquidity levels. Automatically hides on daily and higher timeframes. Ideal for intraday traders tracking session highs, lows, and equilibrium zones.

Session OpensThis Indicator Draws Session open labels for Asia Session-New York Session-London Session with Optional Alerts.

Sessions DRG FX & Indices This indicator highlights the major global trading sessions on the chart, helping traders identify periods of high liquidity and increased volatility in Forex and Indices markets.

Sessions Lines & BackgroundDisplay Asia, London & New York sessions as background colors or lines (for a cleaner chart).

Session Levels (3of3)This system is designed to strip away market noise and highlight the areas where institutional capital is actually active.
Most retail traders fail because they treat every price movement with equal importance. They often enter trades in the "middle of nowhere" or get trapped by "fakeouts" at standard support/resistance levels.
This tool solves:
Context Blindness: It defines the "playing field" by marking institutional session boundaries (Asia, London, NY), so you know exactly where liquidity resides.
Computation Lag: Standard Volume Profiles often slow down a chart. Our Optimized VPC provides the "Magnet" price without the lag.
Indecision: By requiring a Market Structure Shift (MSS) alongside a Fair Value Gap (FVG), it removes the guesswork of "Is this a reversal or a continuation?"
Why It Is Unique:
Unlike standard indicators that look at a single data point (like just price or just volume), this is a Holistic System.
Auto-Mitigation: Most FVG indicators clutter your screen with old boxes. This tool automatically deletes zones once price "fills" them, keeping your focus on live opportunities.
Institutional "Sweep" Logic: It specifically tracks if price has "stolen" the liquidity from a previous session before issuing a signal.
The "Vegas" Filter: It uses the 144 EMA (Vegas Floor) as a high-probability institutional trend filter, ensuring you aren't fighting the primary trend.
When testing this, track one specific stat: "Did price hit the VPC after the MSS?" You will likely find that even when the trade doesn't reach the far PRZ targets, it reaches the VPC Magnet over 70% of the time. Focusing on that "snap-back" to the orange line is the secret to a high win rate with this tool.

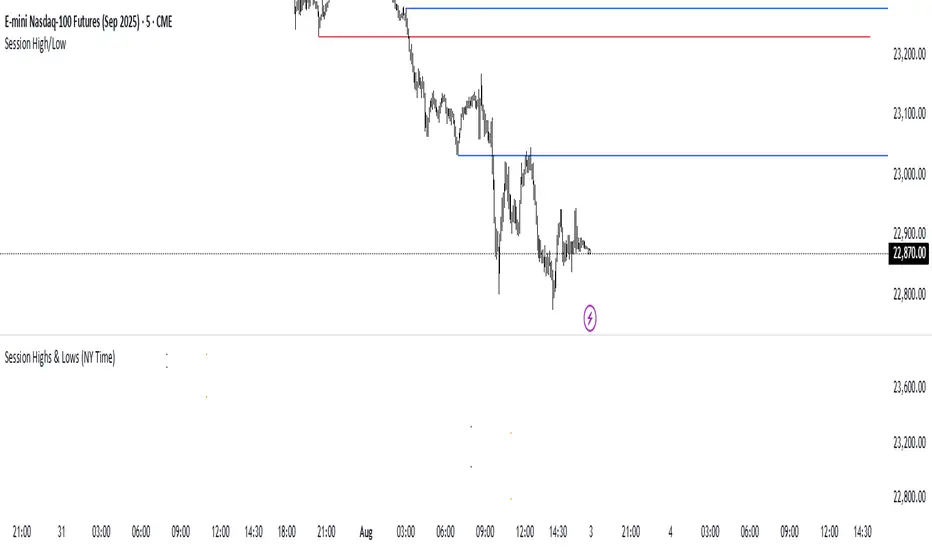
Session High and Lowmarks out previous NY session high/low, asian and london session high/low and updates automatically. Perfect indicator for overnight liquidity.

Session Highs & Lows (NY Time)Marks out Asian session high and low, and London session high and low, this makes it easier for you to easily marks out important highs and lows on the chart when trading.

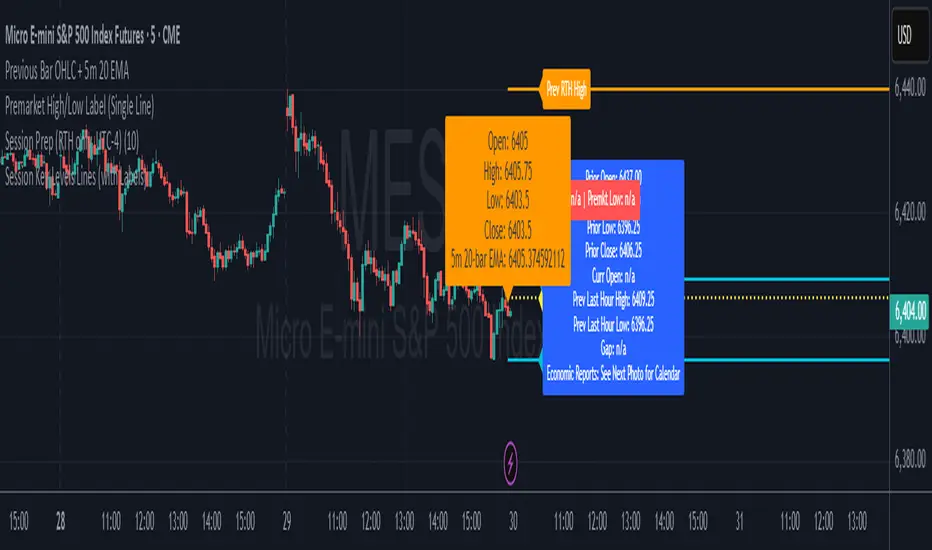
Session Prep (RTH only, UTC-4)This shows what you have to prepare before each session, including Previous session's OHLC, how much is being gapped up...etc. hope it helps :)
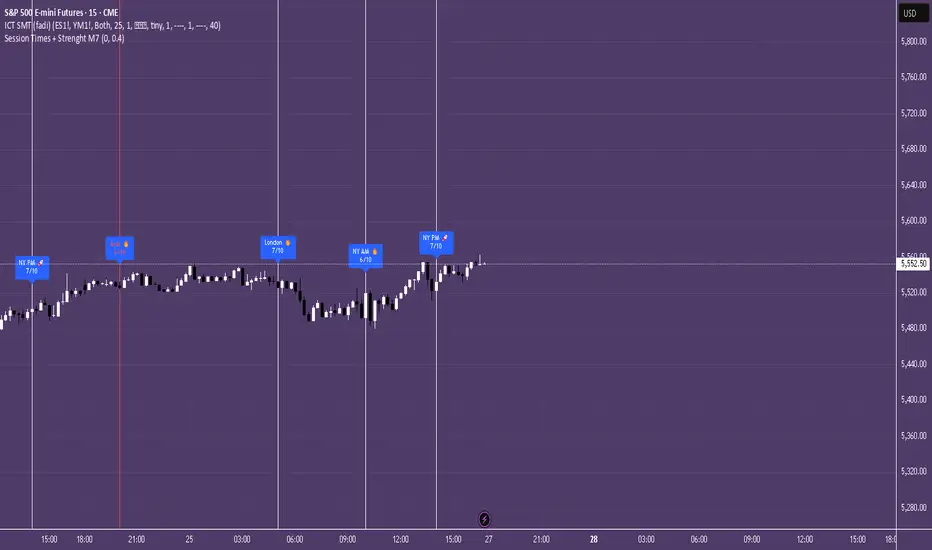
Session Times + Strenght M7This Script Aims to Define Session Times, and Rank those. It can help to adjust your Strategy to Higher Volatility, if you choose to use the Session Volatility and Strenght Index from 1-10. Your timezone on Trading View should be NY. You can customize the Following in Settings: Weight of Volatility & Narrative Regarding the ranking + Transparency of the Lines. SP:SPX FX:EURUSD OANDA:EURUSD CAPITALCOM:USDJPY AMEX:SPY NASDAQ:QQQ TVC:DXY CAPITALCOM:USDJPY CME_MINI:NQ1! OANDA:XAUUSD FX:GBPUSD
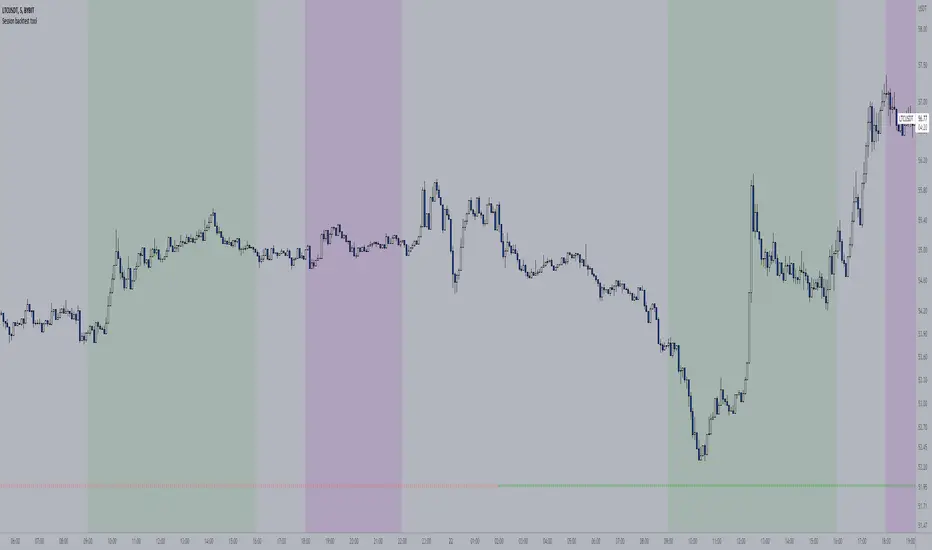
Session backtest toolWith this tool you can easily backtest your trading strategy. You can set the times of a day session and evening session separately. The days of the week were indicated at the bottom of the chart.
For me personally, this saves me a lot of time with back testing. Hopefully I can help you with this too
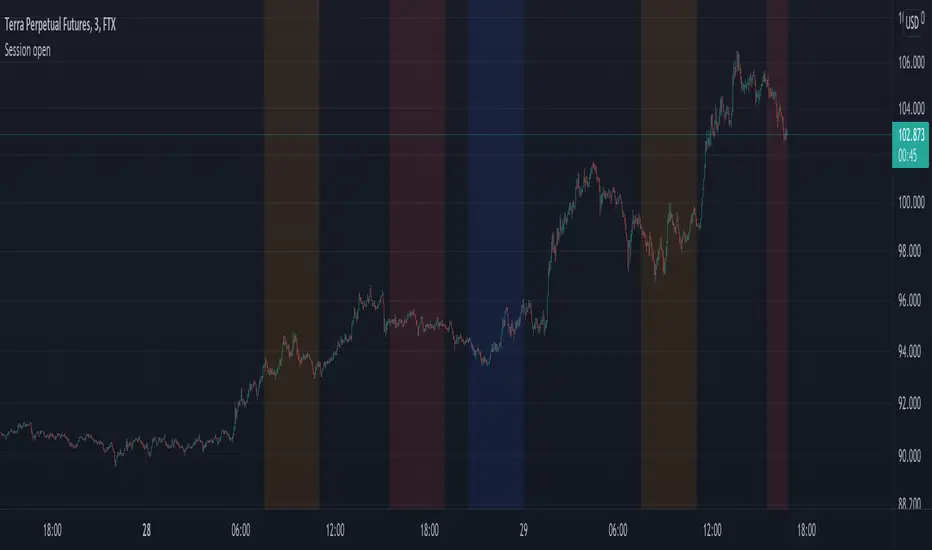
Session openJust a small update to the preset values of the session opening times. Adjusted to 0730-1100 for Tokyo, London and New York respectively.
Note, that if the exchange you view a chart from is not using the UTC time zone, the session open times will differ. Adjust accordingly in the settings.
Session RangesThis is session range indicator with CLEAN code and CLEAR data presentation. There are other range indicators available but when I looked I found them unreliable or making too much screen clutter. WIth mine you can have 3 ranges on screen, measure to bodies or wickes, customise the period, (set your timezone), colours, labels and all that good stuff...
I'm very happy to share it with everyone (and publishing is a great way to archive my code) but ultimately this indicator is by me, for me. Whilst i added a few bells and whistles for everyone this indicator is precisely designed to:
Show me EASILY see what happened in the Asia session and whether we are breaking out with MINIMAL screen clutter. I only use the 3, 15 and 60 - it won't work on the 1, 5, 120 etc because I dont need it to. How I use it is below.
Session High/Low (Last 7 Days, Auto Delete) CGNew York, London and aces session, highs and lows for seven days once price revisits The zones disappear.

Session Levels (Daily & Weekly Targets)This indicator provides market structure and contextual reference only. It does not generate trade signals, entries, or trading advice.
Plots rolling previous daily and weekly highs/lows as potential target levels. Levels automatically remove once touched (including wicks). Default visibility is NY session with optional toggles for London and Asia. Designed for intraday structure, confluence, and target identification.

Session ATP (Trend Colored)📌 Average Traded Price (ATP) – What It Means
ATP (Average Traded Price) is the weighted average price at which a stock has traded during the session, considering both price and volume.
It tells you where the majority of money has actually traded — not just the candle close.
If price stays above ATP → Buyers are in control
If price stays below ATP → Sellers dominate
ATP is like the intraday fair value of the stock.
📌 How ATP Helps in Trading
ATP gives three major insights:
1️⃣ Strength of Trend (Real Strength)
ATP rises only if strong volume enters at higher prices.
So, a rising ATP confirms genuine bullish strength, not fake moves.
ATP falling confirms real selling pressure, not random dips.
2️⃣ High-Probability Retests
Price often pulls back to ATP before taking the next direction.
Price above ATP → ATP becomes support
Price below ATP → ATP becomes resistance
This makes ATP extremely useful for intraday entries.
3️⃣ Identifying Where Big Players Are Positioned
Since ATP is volume-weighted, it reflects where institutions and big orders traded most.
If price stays above the level where institutions bought → trend is strong
If price stays below their cost → trend is weak
📌 How ATP Indicates Price Direction
In your improved version, ATP is trend-colored:
✔ Green → ATP rising → buyers dominating
✔ Red → ATP falling → sellers dominating
✔ Gray → sideways
Direction rule:
Bullish bias when price > ATP and ATP rising
Bearish bias when price < ATP and ATP falling
No-trade zone when price and ATP are flat / tangled
ATP often acts as:
Magnet in consolidation
Springboard in uptrend
Ceiling in downtrend
This helps you judge whether the move is:
A breakout with strength, or
A fake move without volume support.
🔥 Final Line
ATP is one of the few indicators that shows where the real money is trading, making it an excellent guide for intraday trend confirmation, support/resistance, and entry timing.

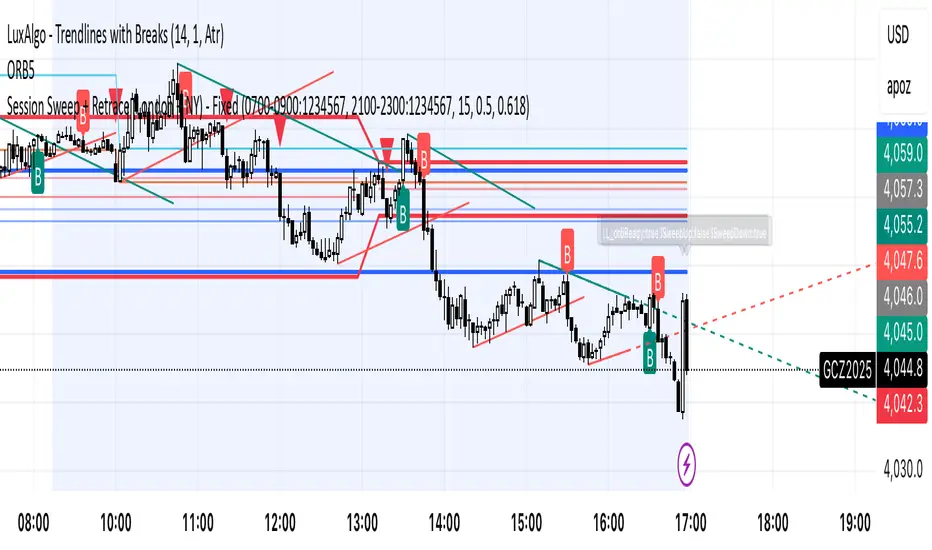
Session Sweep + Retrace (London + NY) - FixedORB Strategy with confluence. This sets out the 5 min session sweep from London and NY, and highlights a test back into the order zone with fib retracement.
Session High/Low by BKMarks all session highs and lows
Asia High/Low
London High/Low
New York High/Low

Session H/L + Mid + 25%/75% — EvolvingPlots Session High and Low + the Midpoint between the two and also plots at 25% and 75% (Good for initial and rolling up/down stops)

