在腳本中搜尋"session"

Session Anchor Lines (Asia, London, NY)futures relative to 4 HR chart ( it draws a line for each session open )

Session Anchor Lines (Asia, London, NY)it draws a line at each session open ( in relative to the 4 HR candle )
Session Highs and Lows - TWThis indicator plots the following:
- Previous day's high and low (based on previous daily candle) - purple
- Asia high and low (1800-0200) - red
- London high and low (0300-0930) - blue
Once a high or low is hit or passed during the NY session, the line reduces in thickness to show that this point of interest has been taken. The thinner lines remain on the chart as a reference so it's easy to discern POIs that are still in play vs. those that have been taken.

Session Highs and LowsThis indicator plots the following:
- Previous day high and low (based on previous daily candle) - purple lines
- Asian high and low (1800-0200) - red lines
- London high and low (0300-0930) - blue lines
During NY session, once one of these point of interest has been hit or passed, the line thickness reduces so you can tell at a glance which points have been taken, but they still remain on the chart for reference.


Session Prep (RTH only, UTC-4)corrected Session Prep (RTH only, UTC-4) now its working properly. hope it helps! :)

Session LiquidityDescribes if markets are liquid enough for institutions to manipulate. Its often difficult to determine if markets will trend or chop, but by looking at how much volume we have at the open, we can determine of the session will be choppy or trendy, and take trades based on that.
Settings predefined for 1m timeframe on SPY. May work with other tickers, but I have not tested it out yet.
Designed for stocks(as of now, may update later)

Session High Low TimestampDescription: Displays the timestamp of the session's high/low. Useful for finding a pattern to day dips/spikes.
Note: Most useful for ETH (extended hours timeframe)

Central Session Time LinesSession Breaks for Central Time Zone
1. Asian
2. London
3. New York
4. Frankfurt
5. Pre New York
6. Australian


Markets [SolQuant]The Markets indicator displays global trading session times with visual range boxes and highlights market maker activity zones. It maps the three major sessions — New York, London, and Asia — along with specialized zones that have been observed to correlate with specific market behaviors.
█ USAGE
Session Boxes
Colored boxes are drawn for each active trading session, spanning from the session open to the session close. The box height covers the price range traded during that session. Each session uses a distinct color for quick identification:
• New York: The primary session for US equities and crypto volume.
• London: Overlaps with New York for peak liquidity in forex and global markets.
• Asia: Tokyo/Hong Kong session, often setting the tone for the following London session.
Session boxes provide immediate visual context about which global market was active during any given price action.
Market Maker Zones
Two specialized time windows are highlighted:
• Reversal Session: A time window commonly associated with market reversals and directional shifts.
• Gap Session: A time window where gaps and displacement moves frequently occur.
These zones are derived from observed patterns in market maker behavior and are intended as awareness tools rather than predictive signals.
█ DETAILS
Sessions are defined by fixed time ranges in their respective timezones. The indicator uses daylight saving time-aware timezone strings to ensure accuracy year-round. Each session's price range (high/low) is tracked dynamically and the box height updates in real time as the session progresses.
Market maker zones use the same box-drawing mechanism but target narrower time windows. All boxes are automatically removed after a configurable maximum count to prevent chart clutter.
█ SETTINGS
• Show NY / London / Asia: Toggle each session's display.
• Show Reversal Session / Gap Session: Toggle market maker zones.
• Session Colors: Customizable colors for each session and zone.
• Max Boxes: Controls how many historical session boxes are kept on chart.
This indicator displays fixed time-based session zones and does not predict price direction. Market maker zones are based on observed patterns that may not persist. It does not constitute financial advice.

ICT ALL | TTRADES DAILY BIAS | AMD Session Bias & Dol [Pro]ICT ALL | TTRADES DAILY BIAS | AMD Session Bias & Draw on Liquidity
Introduction
The ICT TTRADES DAILY BIAS | AMD Session Bias & Draw on Liquidity is an all-in-one indicator built by professionals upon TTrades' Daily Bias Candle methodology and ICT's Power of Three (PO3) framework. This indicator transforms complex multi-session price action into an intuitive, actionable trading system by visualizing the accumulation, manipulation, and distribution phases across the Asia, London, and New York sessions.
By combining Higher Timeframe (HTF) candle visualization on Lower Timeframes (LTF), intelligent Draw on Liquidity (DOL) projections, and precision entry tools like CISD, Equilibrium, and Imbalances, this indicator provides traders with a comprehensive view of institutional price delivery—from the initial manipulation to the final expansion.
The indicator dynamically adapts to daily conditions, automatically identifying bias direction based on session sweeps and expansion candle analysis. All visual elements remain stable and non-repainting within their defined time periods, offering traders reliable levels for analysis and execution.
Every feature is fully customizable, allowing traders to tailor the indicator to their specific trading style, preferred sessions, and visual preferences.
This indicator is built to guide traders through the daily market narrative, combining Daily Bias, AMD / PO3 session structure, Draw on Liquidity, and precision entry confirmations into a clean, non-repainting framework.
---
key features:
🕯️ HTF Candle Visualization
View Higher Timeframe session candles directly on your Lower Timeframe chart. Supports 1D → 1H fractal pairings, allowing macro structure awareness with micro-precision execution.
---
TTrades Daily Bias Logic
The indicator uses multi-day price action analysis comparing D-1 (yesterday) against D-2 (day before yesterday) to determine today's directional bias:
Three Main Pattern Types:
| Pattern | Condition | Bias |
|---|---|---|
| Break (Expansion) | D-1 closes ABOVE D-2 High or BELOW D-2 Low | Continuation |
| Failure to Break (FTB) | D-1 wicks beyond D-2 High/Low but closes back inside | Reversal
| Inside Bar | D-1 doesn't test either D-2 High or Low | Neutral |
Break (Expansion Day):
- Bullish: D-1 closes ABOVE D-2's High → expect continuation higher
- Bearish: D-1 closes BELOW D-2's Low → expect continuation lower
- Requires ≥50% body for conviction (weak body = Neutral)
Failure to Break (FTB):
- Bullish FTB: D-1 wicks BELOW D-2 Low but closes inside → liquidity sweep below → bullish reversal
- Bearish FTB: D-1 wicks ABOVE D-2 High but closes inside → liquidity sweep above → bearish reversal
- If FTB candle has >50% contradicting body → marked as Weak/Neutral
50% Continuation Level:
- Expansion Day: 50% of D-1's full candle range
- FTB Day: 50% of D-1's manipulation wick only
- Zone between daily open and 50% level highlights high-probability continuation area
- Disappears if violated by Htf candle close
---
🕯️ session Visualization (AMD/PO3)
View Higher Timeframe session candles directly on your Lower Timeframe chart. Supports 1D to 1H pairings.
What it helps you see:
profiling sessions
• When Asia → London → NYC manipulate, reverse, or expand a range
• Session-to-session momentum and volatility shifts
• session Liquidity highs/lows and market narrative
This tool helps traders apply ICT concepts like PO3, It’s particularly useful for identifying liquidity zones, Killzone reactions, and higher timeframe market structure while executing on a lower timeframe
Session Breakdown:
AMD Candle Construction
Session Breakdown (EST)
- CBDR — 14:00 – 20:00
Central Bank Dealers Range (pre-Asia positioning)
- Asia (C2) — 20:00 – 00:00
Accumulation, range establishment & liquidity build
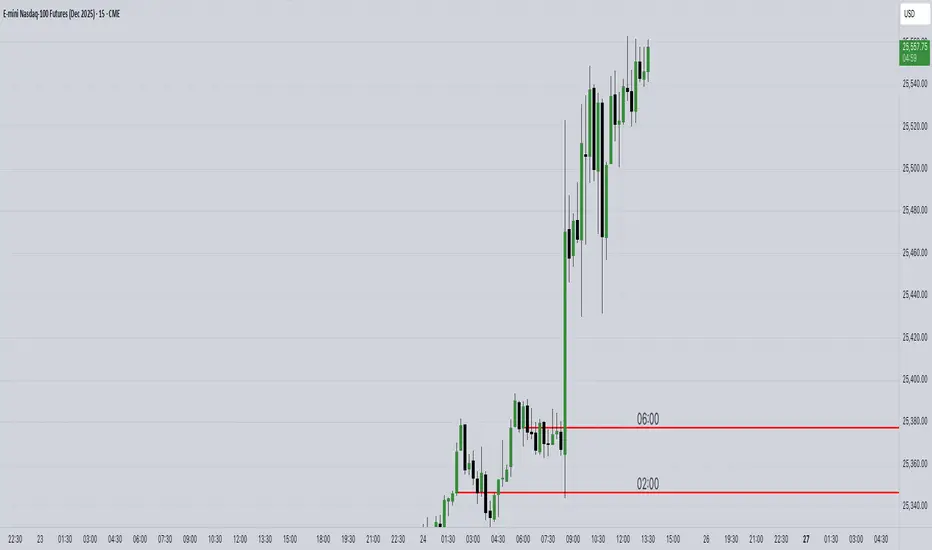
- London Killzone (C3) — 02:00 – 05:00
Manipulation phase, sweeps Asia liquidity
- New York Killzone (C4) — 07:00 – 10:00
Distribution & true expansion
Each candle begins after the previous session ends, fully capturing the Accumulation → Manipulation → Distribution cycle:
- C1 — Starts at CBDR open
- C2 — Asia session
- C3 — opens Asia close and closes London Killzone close
- C4 — opens after London kz close → NYC expansion
This structure reveals where price is in the daily delivery process at a glance.
---
⏰ Killzone Auto Marking
Automatically plots London and New York Killzones with:
- DST-aware session timing
- Custom colors & transparency
- Clean, unobtrusive chart visuals
Trade only during institutional execution windows.
---
🔄 CISD — Change in State of Delivery
Identifies true order-flow shifts:
- Bullish & bearish CISD detection
- Clear visual markers on structure change
- Ideal entry confirmation inside killzones
Helps filter fake moves and confirms institutional intent.
---
📊 Imbalances / Fair Value Gaps (FVG)
Automatic detection of price inefficiencies:
- Configurable lookback period
- Highlights internal range liquidity and premium entry zones
Perfect for precision entries aligned with bias.
---
📈 SMT Divergence (Smart Money Technique)
Detects divergence between correlated pairs:
- Pivot-based high & low comparison
- Adjustable sensitivity
- Visual divergence lines
Reveals hidden institutional positioning when markets fail to confirm.
---
⚖️ Equilibrium (EQ) & T-Spot Levels
Key price levels for reversals and continuations.
Equilibrium (50%)
- Mean reversion level
- Premium vs discount clarity
- Bias validation or invalidation
T-Spot
- Anticipated wick-reaction zone
- Based on TTrades methodology
- Dynamically adapts to bias & session structure
---
🎯 Draw on Liquidity (DOL) Targets
Automatically projects where price is likely headed:
- Previous Day High / Low — External liquidity
- C2 (Asia) High / Low — Internal session liquidity
- Clear labels & target tracking
---
📋 Real-Time Bias Dashboard
A compact information panel showing:
- Daily expansion status
- Current directional bias
- Active liquidity targets
- SMT divergence counts
Fully customizable position, size, and visibility.
---
⚙️ Full Customization
Every element is adjustable:
- Colors, line styles & transparency
- Visibility toggles per feature
- Lookback periods & sensitivity controls
Designed to fit any ICT-based trading style.
---
🔍 Quick Feature Summary
| Feature | Purpose |
|---|---|
| AMD Candles | Visualize accumulation → manipulation → distribution |
| HTF Candles | Higher timeframe structure on LTF |
| DOL Targets | Smart liquidity-based price objectives |
| Killzones | Optimal institutional trading windows |
| CISD | Order-flow reversal confirmation |
| Imbalances (FVG) | Precision entry zones |
| SMT Divergence | Multi-pair smart money signals |
| EQ / T-Spot | Key reversal & continuation levels |
| Dashboard | Live bias & target tracking |
---
How to Use
1. **Add to Chart**
Apply the indicator to any Forex pair.
2. **SMT Comparison Symbol**
By default, SMT tracks **GBPUSD**. Change this in the settings to match a correlated pair for your chart:
- Trading **EURUSD** → Use **GBPUSD** as the comparison
- Trading **GBPUSD** → Use **EURUSD** as the comparison
- Trading **US30** → Use **NAS100** as the comparison
3. **Wait for Bias**
Let the indicator establish direction during **C3 (London)**. Once Asia levels are swept, **DOL targets appear automatically**.
4. **Trade the Killzones**
Enter during **London Killzone (02:00–05:00)** or **New York Killzone (07:00–10:00)** when price reaches DOL targets.
5. **Confirm with CISD**
Look for **Change in State of Delivery (CISD)** signals to confirm reversals at key levels.
6. **Use Imbalances**
Fair Value Gaps (FVGs) provide precision entry points — enter when price returns to fill the gap.
7. **Check Dashboard**
Monitor real-time bias, active targets, and SMT divergence count at a glance.
---
## Pro Tips
- Disable features you don’t use to keep the chart clean.
- Adjust the imbalance days back setting based on your trading style.
- Use killzone boxes to avoid trading outside optimal windows.
Non-Repainting • Fully Customizable • Forex, Indices & Crypto Compatible

QuantumPips Session Trend StructureQuantumPips Session Trend Structure is an indicator built to help you read session structure and spot higher-quality breakout → retest opportunities when trend and momentum conditions agree.
It does three main things:
Maps sessions (Asia / London / New York) with live High/Low boxes
Adds trend direction using EMA bias (50/200 + optional slope)
Prints BUY/SELL labels only after a clean breakout + retest sequence, optionally filtered by volume, range expansion (ATR), and candle body strength
Educational tool only — not financial advice. Always manage risk.
What you’ll see on the chart
Session boxes (structure)
The indicator draws a box for each session and updates the session High/Low while the session is active.
Default settings (Timezone Europe/London):
Asia: 00:00–09:00
London: 08:00–17:00
New York: 13:00–22:00
Optional: vertical dotted lines at session starts.
EMA bias (direction)
Two EMAs are plotted:
EMA Fast (50)
EMA Slow (200)
Bias is:
Bullish: EMA50 above EMA200 (and optionally EMA50 rising)
Bearish: EMA50 below EMA200 (and optionally EMA50 falling)
This is designed to reduce counter-trend signals.
The core idea (simple)
Each major session often reacts to the previous session’s range.
This script uses that concept by selecting a reference range:
During London, reference = Asia High/Low
During New York, reference = London High/Low
During Asia (optional), reference = New York High/Low
The panel shows Ref Range, which is just:
Ref Range = Reference High − Reference Low
Signal logic: Breakout → Retest (with confluence)
A signal is only considered when you are inside a session you enabled (Asia/London/NY toggles).
BUY (Long)
Trend bias is Bullish
Price closes above the reference High (breakout)
Price returns to retest near the broken High (ATR tolerance)
Optional: retest candle must close back up (confirm-close)
Optional confirmations pass (volume / expansion / body)
SELL (Short)
Trend bias is Bearish
Price closes below the reference Low (breakout)
Price returns to retest near the broken Low (ATR tolerance)
Optional: retest candle must close back down (confirm-close)
Optional confirmations pass (volume / expansion / body)
This approach is meant to avoid “first-touch” entries and focus on structured moves.
Filters (optional, but useful)
Volume Spike Filter
Requires elevated participation:
volume ≥ SMA(volume) × multiplier
(Volume varies by market/data feed; use discretion on symbols where volume is not meaningful.)
Range Expansion Filter (ATR)
Requires a candle with enough “energy” to avoid weak breakouts:
(high − low) ≥ ATR × range multiplier
Strong Body Filter (optional)
Filters wick-heavy candles around key levels:
body % of candle range ≥ threshold
Side Panel (Top Right) — how to read it
Session
Shows the active session: Asia / London / New York / Off
EMA Bias
Shows: Bullish / Bearish / Neutral
Ref Range
Shows the size of the reference session range being used for the current session:
London uses Asia range
NY uses London range
Asia (optional) uses NY range
Volume
Shows status of the volume filter:
High = passes
Normal = fails
Off = filter disabled
Expansion
Shows status of the ATR expansion filter:
Yes = passes
No = fails
Off = filter disabled
Body
Shows status of the strong-body filter:
Yes = passes
No = fails
Off = filter disabled
Confluence Example
Recommended starting settings
If you want fewer, higher-quality setups:
Enable London + New York
Keep EMA bias ON
Volume filter ON (1.2–1.5×)
Expansion ON (0.8–1.0× ATR)
Body filter optional (0.55–0.70)
Confirm-close ON
If you want more signals:
Lower volume multiplier (1.1–1.2×)
Lower expansion (0.6–0.8× ATR)
Body filter OFF
Best timeframes (TF) to use
Best overall: 5m, 15m, 30m
Best Pairs for Sessions: EURUSD, GBPUSD, GBPJPY, USDJPY, XAUUSD

IMB Session Scanner (15M+) - TradeWithForbesIMB Session Scanner (15M+) built for session-based imbalance detection.
Scans 15M, 1H, 4H, D1 and W1 ICT-style 3-candle Imbalances (IMB) only during Tokyo, London and New York sessions.
Alerts:
- IMB Formed
- IMB Mitigated (Tapped at Open)
Designed for clean institutional execution and reduced chart lag.

Trading Sessions with Highs and LowsTrading Sessions with Highs and Lows is designed to visually highlight specific trading sessions on the chart, providing traders with key insights into market behavior during these time periods. Here’s a detailed explanation of how the indicator works:
Key Features
1. Session Boxes:
• The indicator plots colored boxes on the chart to represent the price range of defined trading sessions.
• Each box spans the session’s start and end times and encapsulates the high and low prices during that period.
• Two trading sessions are defined by default:
• USA Trading Session: 9:30 AM - 4:00 PM (New York Time).
• UK Trading Session: 8:00 AM - 4:30 PM (London Time).
2. Session Labels:
• The name of the session (e.g., “USA” or “UK”) is displayed above the session box for clear identification.
3. High and Low Markers:
• Markers are added to the chart at the session’s high and low points:
• High Marker: A green label indicating the session high.
• Low Marker: A red label indicating the session low.
4. Dynamic Reset:
• After the session ends, the session high and low values are reset to na to prepare for the next trading day.
5. Customizable Background Colors:
• Each session’s box has a distinct, semi-transparent background color for better visual separation.
How It Works
1. Core Functionality:
• A function, plot_box, takes the session name, start time, end time, and background color as input.
• It calculates whether the current time is within the session.
• During the session:
• It tracks the session’s highest and lowest prices.
• It identifies the bars where the high and low occurred.
• At the session’s end:
• It plots a box on the chart covering the session’s time and price range.
• Labels are created for the session name and its high/low points.
2. Session Timing:
• Timestamps for the USA and UK trading sessions are calculated using the timestamp function with respective time zones.
3. Visual Elements:
• The box.new function draws the session boxes on the chart.
• The label.new function creates session name and high/low labels.
Usage
• Overlay Mode: The indicator is applied directly on the price chart (overlay=true), making it easy to visualize session-specific price behavior.
• Trading Strategy:
• Identify session-specific support and resistance levels.
• Observe price action trends during key trading periods.
• Align trading decisions with session dynamics.
Customization
While the indicator is preset for the USA and UK trading sessions, it can be easily modified:
1. Add/Remove Sessions: Define additional sessions by providing their start and end times.
2. Change Colors: Update the background_color in the plot_box calls to use different colors for sessions.
3. Adjust Time Zones: Replace the current time zones with others relevant to your trading style.
Visualization Example
• USA Session:
• Time: 9:30 AM - 4:00 PM (New York Time).
• Box Color: Semi-transparent orange.
• UK Session:
• Time: 8:00 AM - 4:30 PM (London Time).
• Box Color: Semi-transparent green.
Why Use This Indicator?
1. Market Awareness: Easily spot price behavior during high-liquidity trading periods.
2. Trend Analysis: Analyze how sessions overlap or affect each other.
3. Session Boundaries: Use session high/low levels as dynamic support and resistance zones.
This indicator is an essential tool for intraday and swing traders who want to align their strategies with key market timings.

[AlbaTherium] Sessional & Daily's liquidities - Beta Sessional & Daily Liquidities - Beta: Harnessing the Power of the Institutional Funding Candle (IFC) in Trading
Introduction:
The Sessional & Daily Liquidities - Beta indicator places the Institutional Funding Candle (IFC) at its core. Within the realm of trading, the IFC stands as a key signal for identifying Points of Interest (POIs) , offering traders invaluable insights into market dynamics. This document aims to illuminate the central role of the IFC within the Sessional & Daily Liquidities - Beta indicator, explaining how it can be effectively utilized to spot significant changes in the market and seize trading opportunities.
Chapter 1: Sessional Liquidity concepts
The forex market can be broken up into four major trading sessions: the Sydney session, the Tokyo session, the London session, and Trump’s favorite time to tweet (before he was banned), the New York session.
Historically, the forex market has three peak trading sessions. Traders often focus on one of the three trading periods, rather than attempt to trade the markets 24 hours per day. This is known as the “forex 3-session system“. These sessions consist of the Asian, European, and North American sessions, which are also called Tokyo, London, and New York sessions.
For that reason, a lot of trader put their stoploss right at the High or Low of their session, filling these price levels with liquidities. The market loves liquidities, they are like the “fuel” of the market. Price usually goes to these levels, takes out all the liquidities, and then returns to its original direction. This price behaviour indicates the presence of players – banks, institutions,... – driving the market to their own profit.
The same logic applies with Daily, Weekly and Monthly high/low levels.
Chapter 2: Deciphering the Institutional Funding Candle
2.1 Unveiling the Essence of the Institutional Funding Candle (IFC)
- IFC concept is the core of this indicator. It is recommended to use this indicator on high timeframes, like 1H or 4H charts, as those are the timeframes which big players look at.
- The presence of IFC candles means a significant amount of stop loss is triggered, and price have a tendency to reverse.
2.2 Criteria for IFC Identification
The definition of specific conditions that characterize an IFC within the Sessional & Daily Liquidities - Beta indicator:
- A breach of Previous day, Previous week, or Previous month’s High or Low levels or a breach of major Session Highs or Lows.
- Price made an immediate reverse, creating a decent distance from the wicks.
Chapter 2: Trading Strategies with the IFC
User should treat these signals with cautions, and only take trades with multi confluences.
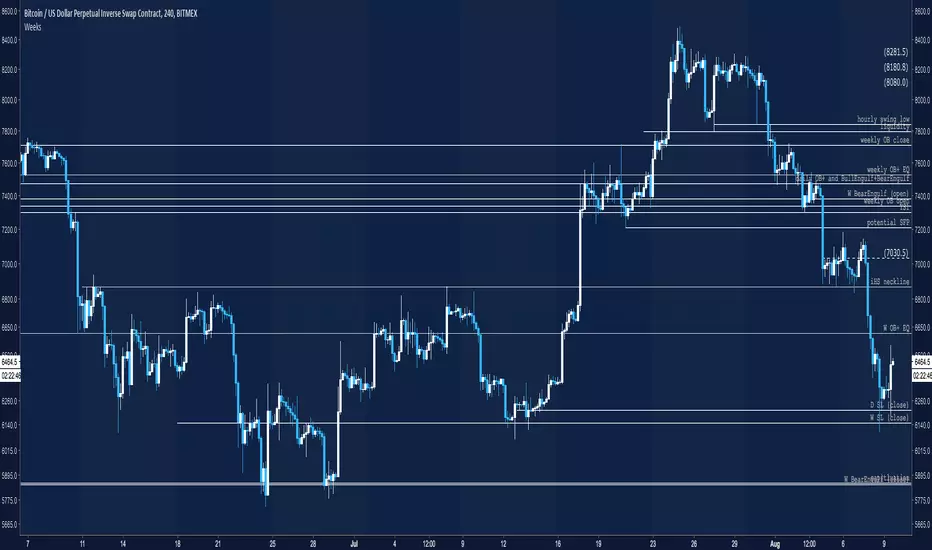
This pictures below demonstrate a strategy to trade with this indicator, taking 1H HTF trend and 5m LTF ChoCh and Single Candle Order Block as confluences.
Conclusion:
The Sessional & Daily Liquidities - Beta indicator, centered around the Institutional Funding Candle (IFC), stands as a potent tool for traders, offering them the means to spot critical inflection points in the market. By understanding the role of the IFC in violating significant swing highs or lows and major session highs or lows, traders can make informed decisions and seize opportunities within the ever-evolving realm of financial markets. It's crucial to note that while IFC candle colors can provide insights, they do not unilaterally dictate market direction. Furthermore, candle closure can be a valuable consideration in specific situations, particularly when evaluating other High Time Frame POIs.
The real-world examples presented in this document within the Sessional & Daily Liquidities - Beta indicator offer a tangible insight into the world of IFC trading. Harness the potential of the Institutional Funding Candle within the Sessional & Daily Liquidities - Beta indicator to elevate your trading strategies and make well-informed decisions in the dynamic landscape of financial markets.

Market Sessions - by Alexander RottasMarket Sessions - Alexander Rottas
This TradingView indicator displays market sessions for USA, EUROPE, and ASIA on your chart. It provides a clear and intuitive way to identify the active market periods, making it easier to plan your trades.
Features:
Session Display: Optionally show market sessions for USA, EUROPE, and ASIA.
Customizable Timings: Set start and end times in UTC for each market session.
Visual Indicators: Color-coded squares indicate active sessions and their combinations:
USA Session: Blue
EUROPE Session: Purple
ASIA Session: Dull Orange
Combined Sessions: Lighter shades to show overlapping sessions
Session Labels: Dynamic labels at the start of each session to easily identify session beginnings on weekdays.
User-Friendly Design: This indicator is designed to be non-intrusive and easy to use, with a simple setup and clear visual cues. Unlike other complex tools, it integrates seamlessly into your chart without overwhelming your view, making it an ideal choice for traders seeking a straightforward way to track market sessions.
DISCLAIMER: This script is provided for educational purposes only. It cannot be used for commercial purposes or plagiarized. All rights reserved by the author. Unauthorized use or distribution of this script is prohibited. For more details, please contact the author directly.

ICT Session by LasinsName: ICT Session by Lasins
Purpose: To visually identify and differentiate between the Asian, London, and New York trading sessions on the chart.
Features:
Highlights the background of the chart during each session.
Includes a mini dashboard in the top-right corner to show the active session.
Allows customization of time zones (exchange timezone or UTC).
Displays copyright and author information.
Key Components
Inputs:
useExchangeTimezone: A boolean input to toggle between using the exchange timezone or UTC for session times.
showDashboard: A boolean input to toggle the visibility of the mini dashboard.
Session Times:
The script defines three trading sessions:
Asian Session: 2000-0000 UTC (or adjusted for exchange timezone).
London Session: 0200-0500 UTC (or adjusted for exchange timezone).
New York Session: 0700-1000 UTC (or adjusted for exchange timezone).
Session Detection:
The is_session function checks if the current time falls within a specified session using the time function.
Background Coloring:
The bgcolor function is used to highlight the chart background during each session:
Asian Session: Red background.
London Session: Green background.
New York Session: Blue background.
Mini Dashboard:
A table is created in the top-right corner of the chart to display the active session and its corresponding color.
The dashboard includes:
A header row with "Session" and "Color".
Rows for each session (Asian, London, New York) with their respective colors.
Copyright and Author Information:
A label is added to the chart to display the copyright and author information ("© ICT Session by Lasins Raj").
How It Works
The script checks the current time and compares it to the predefined session times.
If the current time falls within a session, the chart background is highlighted with the corresponding color.
The mini dashboard updates to reflect the active session.
The copyright and author information is displayed at the bottom of the chart.
Customization
You can adjust the session times in the script to match your preferred timezone or trading hours.
The useExchangeTimezone input allows you to switch between UTC and the exchange timezone.
The showDashboard input lets you toggle the visibility of the mini dashboard.
Example Use Case
Traders who follow the ICT (Inner Circle Trader) methodology can use this indicator to identify key trading sessions and plan their trades accordingly.
The visual representation of sessions helps traders quickly recognize when major markets are open and active.
