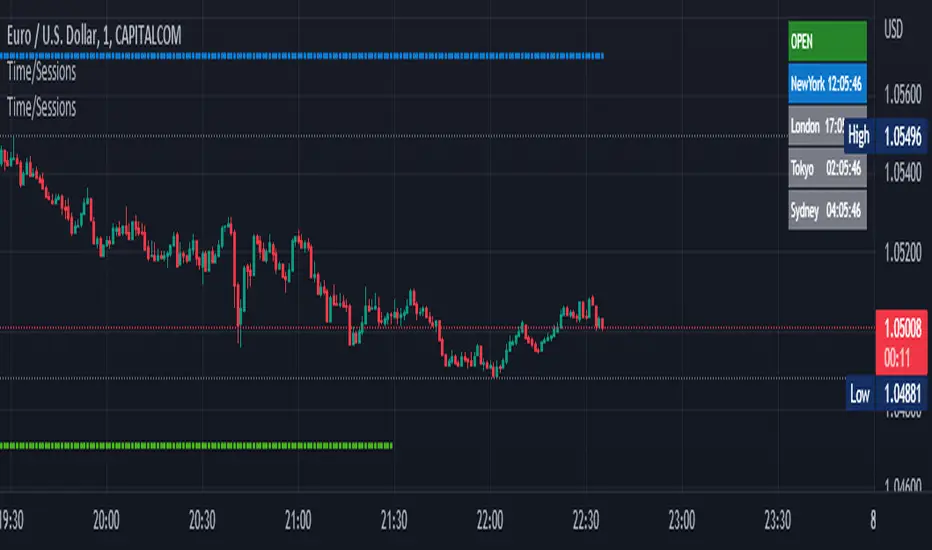
Market Sessions [Kaspricci]A simple indicator to show you the opening hours of the main markets in London, New York, Tokio and Sydney. It is not shown in your main chart window and as such does not make the chart more difficult to read.
You can turn each market on and off individually and also change the start and end time, if you wish so. All based on GMT timezone, but will be translated into your local timezone.
Happy to receive your feedback.
在腳本中搜尋"session"

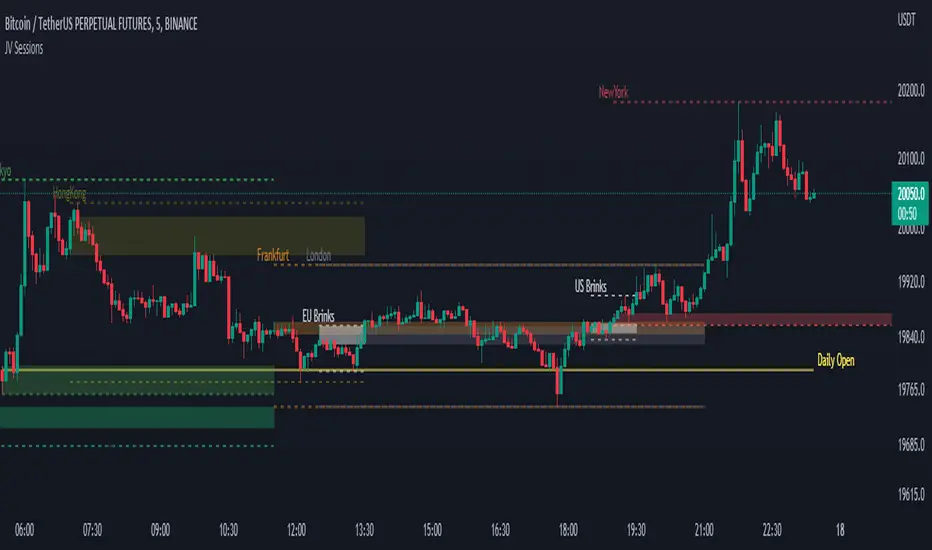
JV SessionsThis indicator serves as the Tradingview equivalent of an MT4 indicator suite.
It differentiates from existing TV indicators in its style and total feature set (most notably PVSRA and PVSRA Override)
It was originally designed for forex markets, and it will work for crypto as well, but it has not been tested on stocks.
List of Forex Market:
Market boxes (NY/JP/ HK /UK/ FR and Brinks Boxes)
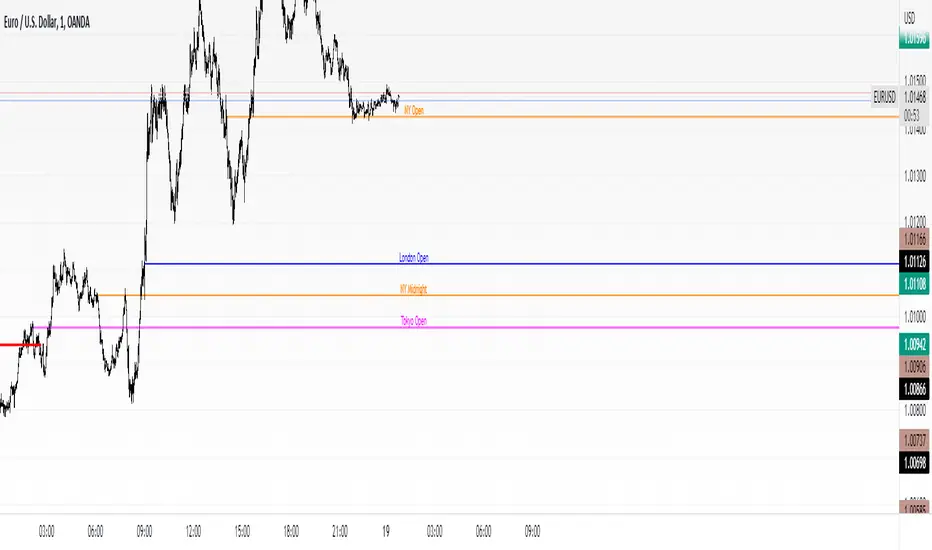
fxOpensPrints lines from the opening price of the three major forex session, plus from the New York midnight opening price.
Has some customizable settings.
Alerts for price crossing the levels.
Somewhat of a work in progress.
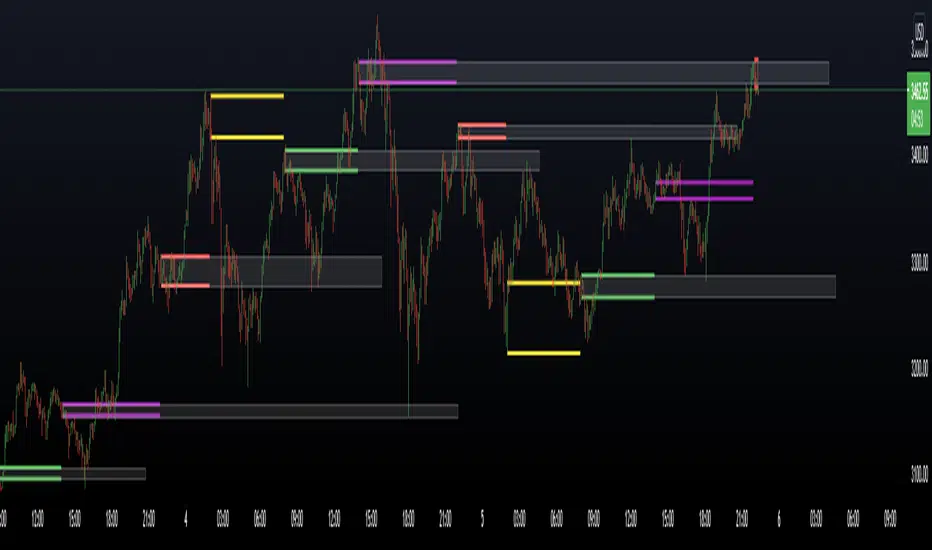
MM Future Session TimesThis script projects the Open/Close of the Asia, UK and US sessions highlighting the Gaps & Deadzone within the market Maker Model.
Dead Zone 5 - 8pm
Asia Gap - 8:00 - 8.30pm | Asia Open 08.30pm | Asia Close 3am
London Gap 3:00 - 3:30am | London Open 3.30am | London Close 9am
US Gap 09:00 - 9.30am | NY Open 9.30am | NY Close 5pm
Note this does not differentiate between the weekend and week day

Asian Session Bollinger BandsThis is a fairly simple adjustment of the Bollinger Bands highlighting and giving the character to the Asian session.

Reivaj MA - PreSession This script contains 9 moving averages which can be changed each between "sma", "ema", "wma", "vwma.
The values of the moving averages are:
MMA20 = SMA20
MMA50 = SMA50
MMA100 = SMA100
MMA200 = SMA200
MMA300 = SMA300.
MMAextra1 = ema 8
MMAextra2 = ema21
MMAextra3 = sma400
MMAextra4 = sma500.
It has an Asian range that goes from 21: 00-07: 00 UTC which turns the color of the candle in green.
And pre-sessions that is one hour before the opening, the time of the opening and the hour after the opening of London and New York.

Trading Sessions GMT+8 By ShoThis indicator show the trading session for GMT+8. Might be slight vary with some broker

Neom Traders Market SessionThis Indicator show the 3 main sections of Forex Market. You can choose between London, New York and Asia Session. It will appear at the background of the main chart.


Day Session with TZThis will paint a grey bar each day at 0 o'clock. So the area between two grey bars is a day session. This script also has timezone support. This is especially useful if you trade crypto.

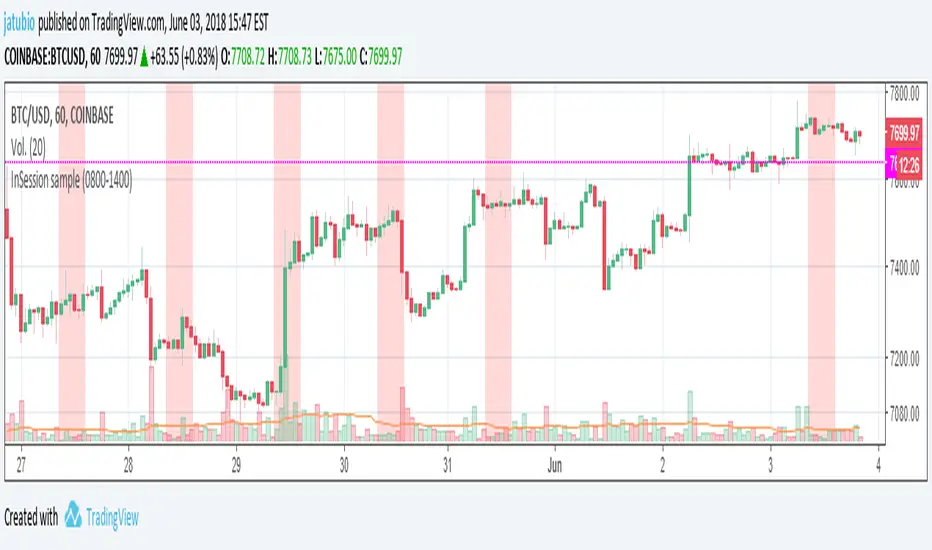
InSession sampleThis indicators it's a programming sample of how to check if hours are inside one session range excluding/including weekends days
EMA + Sessions + RSI This is a simple on-demand indicator. It includes 3 customizable exponential moving averages, three customizable market sessions, and a table showing the status of the RSI
-3 Custom EMAs
-3 Custom Sessions
-1 RSI Table

ATR + EMA + Sessions ProATR + EMA + Sessions Pro By Saeed Fadi to save indicator space, it,s for atr, emas, sessions etc.

Dynamic Sessions - Asia, London, New YorkThis indicator lets you set trading sessions (custom sessions) and print them out as dynamic polyboxes instead of traditional rectangles which lets you identify strong moves and trends easier.

Market Sessions & Daily Range ProThis tool is designed for market visualization. It displays the real trading sessions (Asia, Europe, and America) together with the daily range (00:00–24:00). Boxes and labels show daily highs, lows, open/close levels, and current extremes. The purpose is to provide traders with a clear visual map of how price behaves across sessions and within the daily structure.

Custom Session Tracker (KN)**Custom Session Tracker (KN)**
Visually highlight any intraday session’s high, low, and midpoint on your chart with full styling control.
**Description**
Custom Session Tracker (KN) lets you define any trading session (e.g. 09:30–16:00 NY time) and automatically draws:
* A translucent box spanning the session’s High and Low
* A horizontal line marking the session midpoint
All elements update in real time and persist after session close.
**Features**
* **Session Range Box**: Plots from session open through close
* **Mid-Price Line**: Marks the exact midpoint of High/Low
* **Timezone Input**: Aligns session to any GMT offset
* **Custom Colors**: Fill, border, and mid-line colors
* **Line & Border Styles**: Choose solid or dashed
**Inputs**
* **Timezone** – GMT offset for your market
* **Session** – Hours in `HHMM-HHMM` format
* **Fill Color** – Box interior transparency
* **Border Color** – Box outline
* **Box Border Style** – Solid or dashed
* **Midline Color** – Mid-price line color
* **Mid Price Line Style** – Solid or dashed
**How to Use**
1. Add the script to your chart.
2. Set your session hours and timezone.
3. Customize colors and styles.
4. Watch each session’s high, low, and midpoint appear automatically.
Perfect for session-overlap strategies, mean-reversion signals, or simply keeping key levels in view.

ICT Killzones + Pivots [TFO]Designed with the help of TTrades and with inspiration from the ICT Everything indicator by coldbrewrosh, the purpose of this script is to identify ICT Killzones while also storing their highs and lows for future reference, until traded through.
There are 5 Killzones / sessions whose times and labels can all be changed to one's liking. Some prefer slight alterations to traditional ICT Killzones, or use different time windows altogether. Either way, the sessions are fully customizable. The sessions will auto fit to keep track of the highs and lows made during their respective times, and these pivots will be extended until they are invalidated.
There are also 4 optional Open Price lines and 4 vertical Timestamps, where the user can change the time and style of each one as well.
To help maintain a clean chart, we can implement a Cutoff Time where all drawings will stop extending past a certain point. The indicator will apply this logic by default, as it can get messy with multiple drawings starting and stopping throughout the day at different times.
Given the amount of interest I've received about this indicator, I intend to leave it open to suggestions for further improvements. Let me know what you think & what you want to see added!

Time Zone / Market SessionsTime Zone / Market Sessions indicator is a handy tool to display current major Market Open / Close condition along with present time at that Exchange. Sydney, Tokyo, London, New York market sessions are included. Clear display of Overlap Zones and Kill Zones.. Can be used to estimate market Pumping and Dumping. Alerts can be set when a market opens.
Time is Displayed in Table Layout
Active Market is displayed as Dots on top and bottom
You can select as Timeline or Table display
Overlap is clearly displayed on top and bottom without any mess
Gray color in Table layout Shows Closed Markets
You are free to reuse this code No Limitations.
Kill Zones are indicated in Table format. When some of the markets are closed
Alerts included for market openings
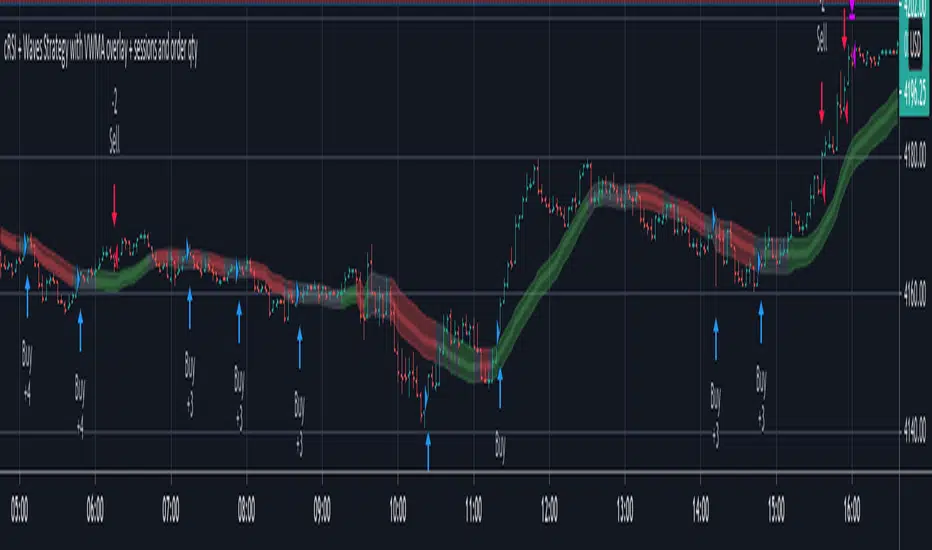
cRSI + Waves Strategy with VWMA overlay + sessions and order qtyThis is a fork of the cRSI + Waves Strategy with VWMA overlay strategy by Dr_Roboto , which adds two additional features, namely:
the ability to limit trade signals to certain defined periods of time ("Sessions") during the trading day and, optionally, to close any open position at the end of either or both "Sessions"
the ability to control the maximum order size suggested by the strategy on the "Inputs" tab of the strategy's "Settings" window
If you are trading on a daily chart (or longer) you must disable the Limit Signals to Trading Sessions? option in order for the strategy to produce signals.
All other features are identical to the original strategy (revision 2.0).
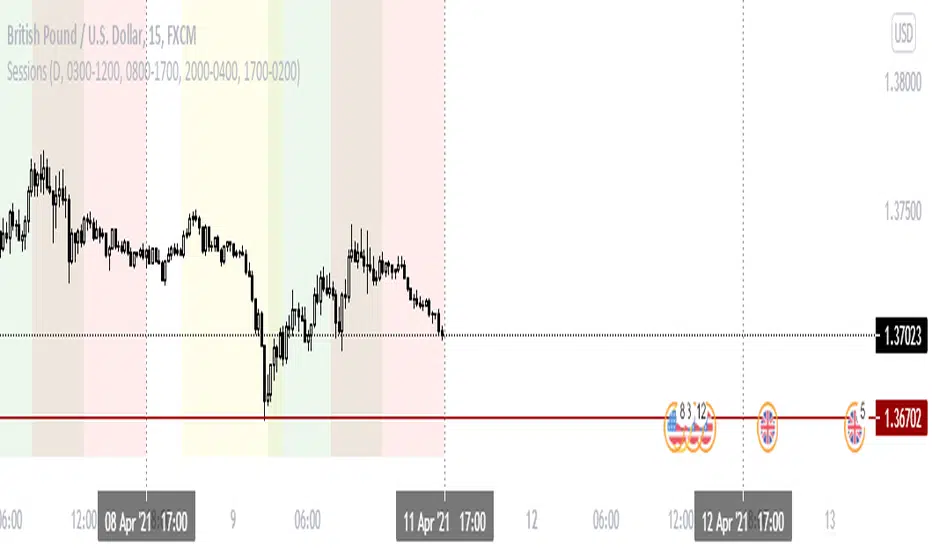
London & New York Sessions ESTThis is a sessions displayer that displays only Lond and New York for EST. It is customizable for other sessions as well
Price Action and 3 EMAs Momentum plus Sessions FilterThis indicator plots on the chart the parameters and signals of the Price Action and 3 EMAs Momentum plus Sessions Filter Algorithmic Strategy. The strategy trades based on time-series (absolute) and relative momentum of price close, highs, lows and 3 EMAs.
I am still learning PS and therefore I have only been able to write the indicator up to the Signal generation. I plan to expand the indicator to Entry Signals as well as the full Strategy.
The strategy works best on EURUSD in the 15 minutes TF during London and New York sessions with 1 to 1 TP and SL of 30 pips with lots resulting in 3% risk of the account per trade. I have already written the full strategy in another language and platform and back tested it for ten years and it was profitable for 7 of the 10 years with average profit of 15% p.a which can be easily increased by increasing risk per trade. I have been trading it live in that platform for over two years and it is profitable.
Contributions from experienced PS coders in completing the Indicator as well as writing the Strategy and back testing it on Trading View will be appreciated.
STRATEGY AND INDICATOR PARAMETERS
Three periods of 12, 48 and 96 in the 15 min TF which are equivalent to 3, 12 and 24 hours i.e (15 min * period / 60 min) are the foundational inputs for all the parameters of the PA & 3 EMAs Momentum + SF Algo Strategy and its Indicator.
3 EMAs momentum parameters and conditions
• FastEMA = ema of 12 periods
• MedEMA = ema of 48 periods
• SlowEMA = ema of 96 periods
• All the EMAs analyse price close for up to 96 (15 min periods) equivalent to 24 hours
• There’s Upward EMA momentum if price close > FastEMA and FastEMA > MedEMA and MedEMA > SlowEMA
• There’s Downward EMA momentum if price close < FastEMA and FastEMA < MedEMA and MedEMA < SlowEMA
PA momentum parameters and conditions
• HH = Highest High of 48 periods from 1st closed bar before current bar
• LL = Lowest Low of 48 periods from 1st closed bar from current bar
• Previous HH = Highest High of 84 periods from 12th closed bar before current bar
• Previous LL = Lowest Low of 84 periods from 12th closed bar before current bar
• All the HH & LL and prevHH & prevLL are within the 96 periods from the 1st closed bar before current bar and therefore indicative of momentum during the past 24 hours
• There’s Upward PA momentum if price close > HH and HH > prevHH and LL > prevLL
• There’s Downward PA momentum if price close < LL and LL < prevLL and HH < prevHH
Signal conditions and Status (BuySignal, SellSignal or Neutral)
• The strategy generates Buy or Sell Signals if both 3 EMAs and PA momentum conditions are met for each direction and these occur during the London and New York sessions
• BuySignal if price close > FastEMA and FastEMA > MedEMA and MedEMA > SlowEMA and price close > HH and HH > prevHH and LL > prevLL and timeinrange (LDN&NY) else Neutral
• SellSignal if price close < FastEMA and FastEMA < MedEMA and MedEMA < SlowEMA and price close < LL and LL < prevLL and HH < prevHH and timeinrange (LDN&NY) else Neutral
Entry conditions and Status (EnterBuy, EnterSell or Neutral)(NOT CODED YET)
• ENTRY IS NOT AT THE SIGNAL BAR but at the current bar tick price retracement to FastEMA after the signal
• EnterBuy if current bar tick price <= FastEMA and current bar tick price > prevHH at the time of the Buy Signal
• EnterSell if current bar tick price >= FastEMA and current bar tick price > prevLL at the time of the Sell Signal

MTF Session Range FibonacciMTF Session Range Fibonacci is a multi-timeframe indicator designed to map high-probability price reaction levels using a fixed intraday session range and Fibonacci projections.
The indicator first identifies a user-defined session window and records the session high and low. Once the session completes, it builds a complete Fibonacci structure from that range, including retracements and extensions above and below the session boundaries. These levels act as support, resistance, targets, and extreme reaction zones, commonly used for intraday and swing trading.
All calculations can be sourced from a higher or custom timeframe, allowing traders to project higher-timeframe structure onto lower-timeframe charts. This helps align entries with broader market context rather than relying on isolated chart data.
To provide trend confirmation, the indicator includes:
A Parabolic Weighted Moving Average (PWMA) to highlight directional bias and momentum strength.
A 50 / 200 EMA crossover system to identify potential trend shifts and dominant market direction.
Visual elements such as color-coded Fibonacci levels, informative tooltips, crossover markers, and optional fills between price and PWMA improve readability while keeping the chart structured.
This indicator is best suited for traders who rely on session-based structure, Fibonacci reactions, and multi-timeframe trend alignment, particularly in indices, forex, and futures markets.
