Integrated Session Markers & MTF Time Blocks (4H/1H)Overview
This indicator provides a comprehensive visual guide to market structure by integrating key session opening signals with multi-timeframe (MTF) background shading. It is designed to help traders quickly identify market open volatility and the progression of 4-hour and 1-hour time cycles.
Key Features
Session Open Markers (Labels): * Automatically marks the start of major trading sessions: SEO (Seoul/Asia), LDN (London/Europe), and NY (New York).
The London (LDN) session is specifically calibrated to 17:00 KST (08:00 UTC).
Labels can be toggled between the Top or Bottom of the chart for better visibility.
4-Hour Time Blocks (Macro View): Alternating background colors every 4 hours to help you track H4 candle rotations visually.
1-Hour Time Blocks (Micro View): Subtle background shading every 1 hour to define short-term intraday structures.
How to Use
Identify Session Volatility: Watch for the "SEO", "LDN", or "NY" labels to anticipate potential breakouts or reversals during session opens.
Visual Time Management: Use the 4H/1H background grids to keep track of time without constantly checking the clock.
Customization: You can easily change the colors of the background blocks and session labels in the settings to match your chart theme (Light/Dark mode).
⚙️ Settings Guide (Input Parameters)
4H Block Color A/B: Set the colors for the 4-hour background rotation.
1H Block Color C/D: Set the colors for the 1-hour background rotation.
Label Position: Choose between "Top" or "Bottom".
Signal Colors: Individual color settings for SEO, LDN, and NY session labels.
在腳本中搜尋"session"

Integrated Session Markers & MTF Time Blocks (4H/1H)📌 Indicator Name Suggestion
Integrated Session Markers & MTF Time Blocks (4H/1H)
📝 English Description
Overview
This indicator provides a comprehensive visual guide to market structure by integrating key session opening signals with multi-timeframe (MTF) background shading. It is designed to help traders quickly identify market open volatility and the progression of 4-hour and 1-hour time cycles.
Key Features
Session Open Markers (Labels): * Automatically marks the start of major trading sessions: SEO (Seoul/Asia), LDN (London/Europe), and NY (New York).
The London (LDN) session is specifically calibrated to 17:00 KST (08:00 UTC).
Labels can be toggled between the Top or Bottom of the chart for better visibility.
4-Hour Time Blocks (Macro View): Alternating background colors every 4 hours to help you track H4 candle rotations visually.
1-Hour Time Blocks (Micro View): Subtle background shading every 1 hour to define short-term intraday structures.
How to Use
Identify Session Volatility: Watch for the "SEO", "LDN", or "NY" labels to anticipate potential breakouts or reversals during session opens.
Visual Time Management: Use the 4H/1H background grids to keep track of time without constantly checking the clock.
Customization: You can easily change the colors of the background blocks and session labels in the settings to match your chart theme (Light/Dark mode).
⚙️ Settings Guide (Input Parameters)
4H Block Color A/B: Set the colors for the 4-hour background rotation.
1H Block Color C/D: Set the colors for the 1-hour background rotation.
Label Position: Choose between "Top" or "Bottom".
Signal Colors: Individual color settings for SEO, LDN, and NY session labels.

JD - Market SessionJD - Market Session (Pro Analysis Tool)
Overview
The JD - Market Session is a high-performance visual analysis tool designed to help traders identify market structure and session-specific liquidity with precision. Unlike standard session indicators that wrap tightly around price action, this script provides a Uniform High/Low Alignment, ensuring that session boxes always extend to the day's maximum boundaries for a cleaner, more professional chart layout.
Key Features
Intraday Global Boundaries: Automatically calculates the daily High and Low, creating a clear "Daily Box" container for the entire trading day.
Synchronized Session Height: Features dedicated logic for Asia, London, and New York sessions. All session boxes are dynamically anchored to the daily High/Low, maintaining a consistent height regardless of price fluctuations during that specific window.
Previous Day Data (PD OHLC): Projects the Previous Day High (PDH), Low (PDL), Open (PDO), and Close (PDC) as high-visibility dotted lines. These levels are plotted with a 4-bar offset to the right of the current price for an unobstructed view.
Adaptive Real-time Updates: As new daily highs or lows are formed, the script retroactively scales the existing session boxes for that day, ensuring perfect alignment with the final intraday range.
High-Contrast Visualization: Uses a specifically curated color palette to distinguish between sessions and key historical levels without cluttering the workspace.
How to Use
Identify Liquidity: Use the PDH and PDL levels to monitor for liquidity sweeps.
Session Context: Observe how price reacts when entering a new session within the context of the day’s total range.
Structure Analysis: The uniform box height allows for easier identification of "Internal" vs "External" range movements.
Policy Compliance Note
This script is a purely visual analysis tool. It does not provide financial advice, trade signals, or "Buy/Sell" recommendations. It is designed to assist manual chart analysis based on user-defined sessions.

BK AK-Session Barricade🗽🛡️ BK AK–Session Barricade 🗽🛡️
All glory to G-d — the true source of wisdom, restraint, and right timing.
AK — every indicator I publish carries his standard: discipline, patience, clean execution.
Session Barricade is not a signal generator.
It’s a battlefield fence: it draws the session container, exposes auction control (VWAP vs TWAP), and layers context (trend state, momentum, delta, imbalances, POC/VA, patterns, Gann partitions) so price must prove acceptance/rejection before you act.
🧠 What it does (big picture)
Barricade builds a session-based market map directly on your chart.
1) Session Range “Barricade” Box
Tracks Session Open / High / Low / Close in real time.
Draws Top/Bottom borders + optional Midpoint.
Optional bias shading + optional vertical/horizontal gradient fill.
Tracks directional streaks and labels the session with ▲/▼ + streak # (trend persistence).
2) Previous Session Levels (memory rails)
Projects prior session levels into the current session:
Prev High / Prev Low (default ON)
Optional: Prev Open / Prev Close / Prev Mid
Optional extend-right so the level stays active into the current session (trade it as a rail, not a history line).
3) TWAP (Session)
Session-reset TWAP (time fairness).
Option to show current session only for clean charts.
4) VWAP (Session) + σ Bands
Session-reset VWAP (auction fairness).
1σ / 2σ / 3σ bands computed from session variance (rolling variance engine).
Purpose: define fair value vs stretch, and quantify displacement from mean.
5) Reference VWAP (two methods)
A second VWAP layer for regime anchoring:
True Anchored VWAP engine (real anchor + reset):
Anchor to Prev Session Open, Last Pivot High/Low, ATH, or ATL
Includes ±1σ / ±2σ bands
Optional ta.vwap reference line (baseline)
Modes: True / ta.vwap / Both / Off
6) VWAP Trend State (slope regime)
Calculates VWAP slope % over a lookback and classifies:
Strong Bull / Weak Bull / Flat / Weak Bear / Strong Bear
Optional trend icon on chart
Optional coloring of the session label by trend state (current session)
7) Session Momentum Engine
Session-relative momentum: (price vs session open) smoothed with a session-reset EMA.
Optional momentum line normalized into the session range (so it “lives” inside the box).
Strong/weak thresholds help separate clean push vs fake push.
8) Delta Analysis (lightweight order-flow proxy)
Cumulative Delta approximation using candle direction × volume.
Optional divergence markers:
Bearish: price pushes highs while delta fails
Bullish: price pushes lows while delta holds
Divergence icons are quiet-hours gated to reduce dead-liquidity noise.
9) Order Flow Imbalances
Imbalance boxes print when volume exceeds Average × Threshold:
Buy imbalance = high volume + green candle
Sell imbalance = high volume + red candle
Object count is capped to protect performance.
10) Volume Profile (session) + POC + Value Area
Builds a session volume profile (binning by close due to Pine constraints).
Computes:
POC (highest-volume price bin)
Value Area (70%) expansion around POC
Draw options:
Profile bars
POC line
Value Area box (optional current-only)
11) Pattern Recognition (current session only)
Pivot-confirmed, anti-spam context markers:
Double Tops / Bottoms
Compression Triangles
Tight Ranges
Designed as context, not prophecy.
12) Heat Map Mode
Turns the session box into an intensity map using:
Volatility or Volume metric
Adjustable intensity scaling
13) Gann Levels (optional)
Session range partitioned into 1/8ths
Optional extra sets: 30/60, 33/66, Both
Range source options:
Current session
Previous session
Last pivot range
Purpose: internal harmonic reaction levels inside the session container.
14) Dashboard + Hover Intelligence
UI Mode: Dashboard Panel / Hover Icon / Both / Off
Dashboard summarizes:
VWAP vs TWAP control state
Price relative to VWAP/TWAP
σ position
Momentum
CumΔ
POC/VA (if enabled)
Final state: WAIT / CAUTION / STRONG (confluence-based)
Hover icon provides an on-chart briefing tooltip without clutter.
⚙️ Core logic (how it works)
Session detection (NY time ready)
Uses America/New_York by default (or Exchange timezone).
Default session start:
Intraday: first bar of session
Otherwise: day change
Optional Custom Session input (session string) for ETH/RTH or your own trading day.
Performance protections
Session data stored in a structured record + array.
Hard caps prevent overload:
VP max bars stored per session
VP recalculated every N bars (throttle)
Imbalance boxes capped/trimmed
History filter: show only today / show last N sessions
Quiet Hours gate (anti-noise control)
Default quiet window: 18:00–07:00
When enabled, hides icons/signals during quiet hours (divergences, imbalances, VWAP/TWAP control icon).
The session structure still draws — you keep the map without getting baited by low-liquidity “tells.”
🧭 How to use it (execution workflow)
Step 1 — Treat the session box like a courtroom
Inside the box: rotation/mean reversion is common.
At the rails (top/bottom): hunt rejection (fade) or acceptance (break/hold).
The box is the boundary. Price must testify.
Step 2 — Read control (VWAP vs TWAP)
VWAP leading = participation sponsorship (auction conviction).
TWAP leading = time drift / weaker sponsorship.
Combine with location:
Above both = strength bias
Below both = weakness bias
Mixed = chop risk
Step 3 — Use σ as a stretch/exhaustion ruler
Near VWAP = fair value / magnet zone
1σ/2σ/3σ = displacement zones:
continuation requires momentum + acceptance
exhaustion shows as failure + divergence + snap back
Step 4 — Use POC/VA as “where business happened”
POC = pivot/magnet line
VA edges = acceptance/rejection tests
Strong behaviors:
reject VA edge → rotate to POC
accept VA edge → expand trend
Step 5 — Respect previous session rails
Prev High/Low are “yesterday’s stones.”
Break + hold = regime shift
Break + fail = trap fuel
Step 6 — Add modules only when needed
Delta/divergence = confirmation, not trigger
Imbalances = attention markers, not entries
Patterns = context, not direction
Gann = internal reaction levels, not magic
🧱 Non-negotiable rule
This is a timing + structure map, not a fortune teller.
If you use it to “predict,” you turn a precision tool into superstition.
👑 Watchman on the Wall Lens (Ezekiel 33 × Nehemiah 4)
A watchman doesn’t predict — he warns at the gate. A wall doesn’t guess — it defines the boundary.
This script builds the session wall (box + rails) and posts the watchman (VWAP/TWAP control + gated alerts).
When it’s quiet, it stays silent. When it speaks, it’s the trumpet: price is either granted passage or turned back.
🙏 Respect + Seal
Respect to AK — discipline, patience, clean execution.
All glory to G-d — the source of wisdom and endurance.
🗽🛡️ BK AK–Session Barricade — draw the rails, read control, let price prove itself. 🛡️🗽

CRT Market Structure Toolkit v4 ALEXCRT Market Structure Toolkit v4 — Developer Overview
CRT Market Structure Toolkit v4 is a public, protected TradingView indicator designed for discretionary traders who focus on market structure, liquidity, session behavior, and higher-timeframe (HTF) context.
The script combines multiple widely known institutional trading concepts into a single, highly configurable overlay.
It is intended to provide context and structural insight, not automated trading signals.
All logic is implemented in a protected format to prevent source-code access, while remaining fully usable as a public analysis tool.
Core Features
1. Previous Day High / Low (PDH / PDL) — Original Logic
Full 24-hour New York session tracking.
Dynamically records the true daily high and low.
Levels extend in real time until a liquidity sweep occurs.
Once swept:
Line style switches to dashed.
Level freezes permanently.
Optional clean labels that follow price until mitigation.
Configurable history depth.
PDH / PDL calculation, sweep detection, level freezing, and labeling behavior are original implementations.
2. HTF High / Low Sweep Levels — Original Logic
Tracks High / Low of any user-defined higher timeframe (default: 4H).
Levels extend forward and freeze after being swept.
Optional dynamically positioned labels.
Independent history controls.
HTF sweep logic and level lifecycle management are original to this script.
3. Fair Value Gaps (FVG) & Balanced Price Range (BPR)
Detection of bullish and bearish Fair Value Gaps using classic three-candle displacement logic.
Configurable filters:
Lookback window
Minimum gap size
Mitigation models (full, partial, or none)
Automatically highlights the nearest active FVG relative to price.
Marks Balanced Price Ranges (BPR) where bullish and bearish gaps overlap.
Credits / Inspiration
Fair Value Gap (FVG) and Balanced Price Range (BPR) concepts commonly used in institutional and ICT-style market structure methodologies.
4. Killzones (Sessions)
Time-based session boxes with dynamic high/low expansion.
Custom session times and colors.
Designed to integrate cleanly with PDH and HTF levels.
Credits / Inspiration
Killzone session concepts (Asia, London, New York).
5. Multi-Session Framework & Volume Profile
Up to six configurable global trading sessions.
Each session supports:
Visual box / area / line rendering
Session high and low
Optional Volume Profile
Volume Profile includes:
Point of Control (POC)
Value Area High / Low (VAH / VAL)
Low Volume Nodes (LVN)
Optional session status table (open / closed).
Credits / Inspiration
Session profiling and Market Profile / Volume Profile theory.
6. Auto Fibonacci Retracement
Automatic Fibonacci projection based on ZigZag pivots.
Dynamic deviation using ATR.
Supports extensions, custom levels, labels, and background fills.
Credits
Uses TradingView’s official ZigZag library (TradingView/ZigZag).
7. Opening Gaps (NWOG / NDOG)
New Week Opening Gap (NWOG)
New Day Opening Gap (NDOG)
Optional Consequent Encroachment (CE) and midpoint logic.
Historical gap management with cleanup routines.
Credits
Opening gap and consequent encroachment concepts used in institutional price delivery models.
8. HTF Candle Overlay (Advanced)
Higher timeframe candle reconstruction on lower timeframe charts.
Supports:
Multiple HTFs
Liquidity sweeps
Midpoints
FVGs and volume imbalances
HTF timers and bias filtering
Credits / Inspiration
Higher timeframe candle overlay and liquidity-based market structure methodologies.
9. SMT Divergence
Detection of Smart Money Technique (SMT) divergence between correlated instruments.
Pivot-based relative strength and weakness comparison.
Visual marking of bullish and bearish SMT conditions.
Credits
SMT divergence concept (inter-market analysis).
Design Philosophy
No trade signals.
No execution automation.
No repainting logic for decision levels.
State-aware drawings with controlled lifecycle management.
Built for discretionary traders prioritizing:
Market structure
Liquidity behavior
Higher timeframe bias
Session context
Usage, Visibility & Protection
Data Source & Instrument Note
Higher timeframe ranges (such as 4H highs and lows) may differ between futures and CFD instruments due to differences in data sources, session times, and candle construction.
This indicator calculates all levels based strictly on the selected symbol and its native data feed.
Users should be aware that HTF ranges and sweep behavior may not align perfectly across different instrument types, even when tracking the same underlying market.
This indicator is published as Public with Protected source code.
The script is fully usable by the public on TradingView charts.
Source code access, copying, modification, or derivative redistribution is not permitted.
The script is provided for personal, educational, and analytical use only.
It is not intended for commercial redistribution, resale, or inclusion in paid products or services.
Intellectual Property & Credits
PDH / PDL and HTF sweep systems are original implementations owned by the author.
Other components represent integrations or adaptations of publicly known trading concepts, credited at a conceptual level.
The script is built using original code and publicly documented methodologies only.
It does not contain or reuse any private, paid, or proprietary indicators or scripts.
Disclaimer
This script does not constitute financial advice and does not provide trade signals.
Trading involves risk. Users are solely responsible for their trading decisions and risk management.
Best settings for personal use :
imgur.com

Opens and Levels MapperOpens & Levels Mapper — Institutional Overview
Opens & Levels Mapper provides a precise and unobtrusive framework of institutional reference levels used across global markets.
The tool focuses exclusively on time-based levels that matter for intraday structure, volatility timing, and session-to-session behavior.
Reference Levels Included
• Previous Ranges
PDH / PDL
PWH / PWL
PMH / PML
Anchored on the exact bar where each level forms to maintain structural integrity for sweeps, retests, liquidity grabs, and range rotations.
• Mid-Range (Optional)
50% of PD / PW / PM
Equilibrium markers offering internal range context without noise.
• Session Opens (DST-Proof)
London Midnight
London Open
New York Midnight
New York Cash Open
Hong Kong Open
Tokyo Open
All timestamps use real session timezones and auto-adjust with DST, ensuring accurate reference points monitored by professional desks.
Technical Characteristics
True timezone handling (DST-adjusted)
Anchoring directly on event-defining bars
Multiple line modes (Start→Now, Start→Right, Full Extend)
Optional price labels for core levels
Minimalist and clean visual footprint
No synthetic signals or artificial zones — only actionable reference levels
Use-Case Profile
Intraday bias development
Session overlap transitions
Reaction analysis around opens and previous ranges
Liquidity behavior at institutional reference points
Cross-session continuity (Asia → London → New York)
Works seamlessly alongside order flow, liquidity concepts, VWAP, FVGs, and market structure tools.
Disclaimer
This script does not generate trading signals or provide financial advice.
It is a contextual analysis tool.
Trading involves risk, and users remain solely responsible for their decisions.
• Built with Pine Script® v6

ICT/SMC Smart Grid & Macro Sessions LilianNasdaqThis all-in-one toolkit is designed for precision traders (ICT, SMC, Scalpers) trading Nasdaq (NQ), S&P500 (ES), or Forex. It combines a Smart Price Grid with an automated Session/Macro time tracker.
Key Features:
Smart Price Grid:
Automatically draws price lines every 10, 20, or 50 points.
Institutional Levels (Big Figures): Highlights "00" levels (e.g., 15500, 15600) with a distinct, thicker style.
Fixed Anchor: Option to manually set the base price for a perfectly static grid.
Session & Macro Tracker (Vertical Lines): Automatically draws vertical lines for key time stamps.
Pre-Open Setup: 09:25, 09:35.
AM Macros: Precise breakdown (09:50 - 10:10 & 10:50 - 11:10).
Global Sessions: London Open (02:00, 05:00) and Asian Session (19:00, 22:00).
Fixed Labels: Displays "London" (03:30) and "Asian" (20:30) text stuck to the top or bottom of the screen (chart clutter-free).
Everything is 100% customizable (colors, line styles, toggle on/off). An essential tool for keeping a clean and professional chart.

ORB Session BreakoutORB Session Breakout
Overview
The ORB Session Breakout indicator automatically identifies Opening Range Breakouts across multiple trading sessions (Asia, London, and New York) and provides visual trade setups with entry, stop loss, and take profit levels.
Opening Range Breakout (ORB) is a classic trading strategy that captures momentum when price breaks out of an initial trading range established at the start of a session. This indicator automates the entire process - from detecting the opening range to plotting trade setups when breakouts occur.
🎯 Key Features
Multi-Session Support
Asia Session - Captures the Asian market open (default: 19:00-19:15 NY time)
London Session - Captures the London market open (default: 03:00-03:15 NY time)
New York Session - Captures the NY market open (default: 09:30-09:45 NY time)
Each session is fully customizable with independent time windows and colors
Enable/disable individual sessions based on your trading preferences
Automatic Trade Visualization
Entry Level - Marked at the breakout candle close
Stop Loss Zone - Configurable as ORB High/Low or Breakout Candle High/Low
Take Profit Zone - Calculated automatically based on your Risk:Reward ratio
Visual zones make it easy to see risk/reward at a glance
Smart Breakout Detection
Detects breakouts on the exact candle that closes beyond the ORB range
Supports direction changes - if price breaks one way then reverses, a new trade is signaled
Configurable max breakouts per session (1-4) to control trade frequency
Tracking hours setting limits how long after the ORB to look for entries
Futures Compatible
Special detection logic for futures markets where session times may fall during market close
Works reliably on instruments with non-standard trading hours
📊 How It Works
Opening Range Formation
At the start of each enabled session, the indicator tracks the high and low of the first candle(s)
This range becomes your ORB box (displayed in the session color)
Breakout Detection
When a candle closes above the ORB High → LONG signal
When a candle closes below the ORB Low → SHORT signal
The breakout candle is highlighted in yellow (customizable)
Trade Setup Visualization
Entry line drawn at the breakout candle's close price
Stop Loss placed at ORB Low (longs) or ORB High (shorts) - or breakout candle extreme
Take Profit calculated as: Entry + (Risk × R:R Ratio) for longs
Direction Changes
If you're in a LONG and price closes below the ORB Low, the indicator signals a SHORT
This counts as your 2nd breakout (configurable up to 4 per session)
💡 Trading Tips
Best Practices
Wait for candle close - The indicator only signals on confirmed closes beyond the ORB, reducing false breakouts
Use with trend - ORB breakouts work best when aligned with the higher timeframe trend
Respect the levels - The ORB High/Low often act as support/resistance throughout the session
Monitor multiple sessions - Sometimes the best setups come from Asia or London, not just NY
Recommended Settings by Style
Conservative: Max Breakouts = 1, R:R = 2.0+, SL Mode = ORB Level
Aggressive: Max Breakouts = 3-4, R:R = 1.5, SL Mode = Breakout Candle
Scalping: Shorter tracking hours (1-2), tighter R:R (1.0-1.5)
What to Avoid
Trading ORB breakouts during major news events (high volatility can cause whipsaws)
Taking every signal without considering market context
Using on timeframes higher than 1 hour (the ORB concept works best intraday)
🔔 Alerts
The indicator includes built-in alerts for:
Entry Signal - When a breakout is detected (LONG or SHORT)
Take Profit Hit - When price reaches the TP level
Stop Loss Hit - When price reaches the SL level
To set up alerts: Right-click on the chart → Add Alert → Select "ORB Session Breakout"
📝 Notes
This indicator is designed for intraday trading on timeframes up to 1 hour
Session times are based on the selected timezone (default: America/New_York)
The indicator works on all markets including Forex, Futures, Stocks, and Crypto
For futures with non-standard hours, the indicator includes special detection logic

Custom Session ORB - Extending Past Current CandleCustom Session ORB - Extending Past Current Candle
This indicator plots Opening Range Breakout (ORB) levels for one or two customizable trading sessions directly on your chart. It dynamically tracks the high, low, and midpoint of the defined session(s) and extends these levels beyond the session using a configurable offset.
Features:
Supports two custom sessions.
New York and Asia pre-saved.
Automatically tracks session High, Low, and Mid.
Option to extend ORB levels past the live candle.
Option to display only the most recent ORB for a clean chart.
Configurable line thickness, style, and label size.
Works in Eastern Standard Time (EST) without manual adjustment.
Settings:
Show Labels: Toggle to display ORB values on chart.
Label Font Size: Small, Normal, Large.
Mid Line Style: Solid, Dashed, or Dotted.
ORB Line Thickness: Set line thickness of ORB levels.
Extend Past Current Candle by N Bars: Controls how far the ORB extends visually.
Show Only Current ORB: Cleans chart by removing previous session ORB levels.
Enable Session 1 / 2: Toggle individual sessions on/off.
Session Time: Set the start and end times for each session (automatically in EST).
How It Works:
The indicator monitors the defined session time, records the high, low, and midpoint, and draws lines at those levels. When the session ends, the lines are extended by the specified offset for easy breakout visualization. Labels can optionally show the exact price levels.

Dobrusky Pressure CoreWhat it does & who it’s for
Dobrusky Pressure Core is a volume by time replacement for traders who care about which side actually controls each bar. Instead of just plotting total volume, it splits each bar into estimated buy vs sell pressure and overlays a custom, session-aware volume baseline. It’s built for discretionary traders who want more nuanced volume context for entries, breakouts, and pullbacks.
Core ideas
Buy/sell pressure split: Each bar’s volume is broken into estimated buying and selling pressure.
Dominant side highlighting: The dominant side (buy or sell) is always displayed starting from the bottom of the bar, so you can quickly see who “owned” that bar.
Median-based baseline: Uses the median of the last N bars (50 by default) to build a robust volume baseline that’s less sensitive to one-off spikes.
Session-aware behavior: Baseline is calculated from Regular Trading Hours (RTH) by default, with an option to include Extended Hours (ETH) and a control to force Regular data on higher timeframes.
Volume regimes: Three multipliers (1x, 1.5x, 2x by default) show normal, high, and extreme volume regions.
Flexible display: Baseline can be shown as lines or as columns behind the volume, with full color customization.
How the pressure logic works
For each bar, the script:
Adjusts the range for gaps relative to the prior close so the “true” traded range is more consistent.
Computes buy pressure as a proportion of the adjusted range from low to close.
Defines sell pressure as: total volume minus buy pressure.
Marks the bar as buy-dominant if buy pressure ≥ sell pressure, otherwise sell-dominant, and colors the dominant side from the bottom to at least the midpoint using the selected buy/sell colors.
In practice, this turns basic volume columns into bars where the internal split and dominant side are clearly visible, helping you judge whether aggressive buyers or sellers truly controlled the bar instead of just looking at the price action.
Volume baseline & session logic
The script builds a session-aware baseline from recent volume:
Baseline length: A rolling window (default 50 bars) is used to compute a median volume value instead of a simple moving average.
RTH-only by default: By default, the baseline is built from Regular Trading Hours bars only. During extended hours, the baseline effectively “freezes” at the last RTH-derived value unless you choose to include extended session data.
Extended mode: If you select Extended mode, the script builds separate rolling baselines for RTH and ETH trading, using the appropriate one depending on the current session.
Force Regular Above Timeframe: On timeframes equal to or higher than your chosen threshold, the baseline automatically uses Regular session data, even if Extended is selected.
Multipliers: Three adjustable multipliers (1x, 1.5x, 2x by default) create normal, high, and extreme volume bands for quick identification.
This lets you choose whether you want a pure RTH reference or a baseline that adapts to extended-session activity.
Example ways to use it
1. Replace standard volume bars
Add Dobrusky Pressure Core to your volume pane and hide the default volume if you prefer a clean look.
Use the colors and split to see at a glance whether buyers or sellers were dominant on each bar.
2. Pressure confirmation for entries
For longs (example concept; adapt to your own rules):
Require that the entry bar’s buy pressure is greater than the previous bar’s sell pressure , or
If the entry and prior bar are both buy-dominant, require that the entry bar has more buy pressure than the prior bar.
This helps avoid taking a long when buying pressure is clearly fading relative to what sellers recently showed. A mirrored idea can be used for short setups with sell pressure.
3. Context from baseline multipliers
Use ~1x baseline as “normal” volume.
Watch for bars at or above 1.5x baseline when you want to see increased participation.
Treat 2x baseline and above as “extreme” volume zones that may mark climactic or especially important bars.
In practice, the baseline and multipliers are best used as context and filters, not as rigid rules.
Settings overview
Display
- Show Volume Baseline: toggle the baseline and its levels on or off.
- Baseline Display: choose between Line or Bars for the baseline visualization.
Baseline Calculation
- Length: lookback for the median baseline (default 50, configurable).
- Baseline Session Data: choose Regular or Extended to control which session data feeds the baseline.
Session Controls
- Regular Session (Local to TZ): define your RTH window (e.g., 0930-1600).
- Session Time Zone: choose the time zone used for that window.
- Force Regular Above Timeframe: on higher timeframes, force the baseline to use Regular session data only.
Baseline Levels
- Show Level x Multiplier 1/2/3: toggle each volume regime level.
- Multiplier 1/2/3: define what you consider normal, high, and extreme volume (defaults: 1.0, 1.5, 2.0).
Colors
- Buy Volume / Sell Volume: choose colors for buy and sell pressure.
- Baseline Bars (Base / x2 / x3): colors when the baseline is drawn as columns.
- Baseline Line (Base / x2 / x3): colors when the baseline is drawn as lines.
Limitations & best practices
This is a decision-support and visualization tool, not a buy/sell signal generator.
Best suited to markets where volume data is meaningful (e.g., index futures, liquid equities, liquid crypto).
The usefulness of any volume-based metric depends on the underlying data feed and instrument structure.
Always combine pressure and baseline context with your own strategy, risk management, and testing.
Originality
Most volume tools either show total volume only or compare it to a simple moving average. Dobrusky Pressure Core combines:
An intrabar buy/sell pressure split based on a gap-adjusted price range.
A median-based, configurable baseline built from session-specific data.
Session-aware behavior that keeps the baseline focused on Regular hours by default, with the option to incorporate Extended hours and force Regular data on higher timeframes.
The goal is to give traders a richer, session-aware view of participation and pressure that standard volume bars and simple SMA overlays don’t provide, while keeping everything transparent and open-source so users can review and adapt the logic.

Live Session Extremes: Asia / London / NY (5m)This script automatically tracks and plots the live high and low levels of the three major Forex trading sessions:
Asia Session (18:00–03:00) — Teal
London Session (03:00–08:00) — Blue
New York Session (08:00–12:00) — Red
Designed specifically for 5-minute charts, it updates in real time as each session forms new highs or lows.
You always see the most recent session’s levels, cleanly plotted and color-coded on your chart.
✔ Features
Live updating lines for each session’s high & low
Lines anchored to the exact candles that created the extreme
Auto-cleaning: old session levels are deleted when a new session begins
Clear labeling:
Asia High / Asia Low (Teal)
London High / London Low (Blue)
NY High / NY Low (Red)
Extend-right option for projecting session levels into future price action
Built for precision session-based strategies such as:
Liquidity grabs
Session sweeps
BOS/CHOCH analysis
ICT-style trading
High/low power levels

CPT - CRT Sessions🧭 CPT - CRT Sessions V3
Automated Killzones, CRT Ranges, FVGs, and Market Structure Anchors — built for precision intraday analysis.
🔹 Overview
CPT - CRT Sessions V3 is an advanced all-in-one price action indicator designed to simplify your intraday charting and speed up trade preparation.
It automatically plots key session killzones, Central Range Times (CRT), Fair Value Gaps (FVGs), and market structure anchors such as NDOG, NWOG, and PDH/PDL, allowing traders to identify premium and discount zones at a glance.
⚙️ Core Features
🕒 CRT Ranges (Central Range Time)
Automatically plots 1HR CRT (for futures) and 4HR CRT (for forex) sessions.
Includes color-coded high/low lines for instant visual reference.
Configurable hours (UTC-4 default) and adjustable forward projection.
📦 Killzones
Automatically draws Asian, London, and New York (AM, Lunch, PM) session boxes.
Each killzone features:
Adjustable start/end times
Independent color and transparency controls
Session labeling inside boxes
Uses the classic ICT-style session structure (Asia: 20:00–23:59 UTC-4 by default).
⚡ Fair Value Gaps (FVGs)
Detects both bullish and bearish FVGs automatically.
Displays each gap with:
Midpoint line
Label inside the box (e.g., “1HR FVG”, “4HR FVG”)
Auto-remove logic once price mitigates the gap.
Works on all timeframes.
🔰 Market Anchors
PDH / PDL — Previous Day High & Low
NDOG / NWOG — New Day & New Week Opening Gaps
Automatically drawn and color-coded for visual clarity.
🎨 Customization
Adjustable line styles, widths, and label sizes
Individual transparency sliders for each session box
Optional 24-hour display filtering
Fully timezone-aware (default: UTC-4, matching Exchange time)
💡 Ideal For
Traders following ICT, Smart Money Concepts, or Session Liquidity Models
Scalpers and intraday traders looking to automate manual markups
Multi-timeframe confluence mapping (FVGs + Killzones + CRTs)
🧠 Notes
This tool is for chart analysis only — not an entry or exit signal.
Always perform your own confluence checks before trading.

Dual Volume Profiles: Session + Rolling (Range Delineation)Dual Volume Profiles: Session + Rolling (Range Delineation)
INTRO
This is a probability-centric take on volume profile. I treat the volume histogram as an empirical PDF over price, updated in real time, which makes multi-modality (multiple acceptance basins) explicit rather than assumed away. The immediate benefit is operational: if we can read the shape of the distribution, we can infer likely reversion levels (POC), acceptance boundaries (VAH/VAL), and low-friction corridors (LVNs).
My working hypothesis is that what traders often label “fat tails” or “power-law behavior” at short horizons is frequently a tail-conditioned view of a higher-level Gaussian regime. In other words, child distributions (shorter periodicities) sit within parent distributions (longer periodicities); when price operates in the parent’s tail, the child regime looks heavy-tailed without being fundamentally non-Gaussian. This is consistent with a hierarchical/mixture view and with the spirit of the central limit theorem—Gaussian structure emerges at aggregate scales, while local scales can look non-Gaussian due to nesting and conditioning.
This indicator operationalizes that view by plotting two nested empirical PDFs: a rolling (local) profile and a session-anchored profile. Their confluence makes ranges explicit and turns “regime” into something you can see. For additional nesting, run multiple instances with different lookbacks. When using the default settings combined with a separate daily VP, you effectively get three nested distributions (local → session → daily) on the chart.
This indicator plots two nested distributions side-by-side:
Rolling (Local) Profile — short-window, prorated histogram that “breathes” with price and maps the immediate auction.
Session Anchored Profile — cumulative distribution since the current session start (Premkt → RTH → AH anchoring), revealing the parent regime.
Use their confluence to identify range floors/ceilings, mean-reversion magnets, and low-volume “air pockets” for fast traverses.
What it shows
POC (dashed): central tendency / “magnet” (highest-volume bin).
VAH & VAL (solid): acceptance boundaries enclosing an exact Value Area % around each profile’s POC.
Volume histograms:
Rolling can auto-color by buy/sell dominance over the lookback (green = buying ≥ selling, red = selling > buying).
Session uses a fixed style (blue by default).
Session anchoring (exchange timezone):
Premarket → anchors at 00:00 (midnight).
RTH → anchors at 09:30.
After-hours → anchors at 16:00.
Session display span:
Session Max Span (bars) = 0 → draw from session start → now (anchored).
> 0 → draw a rolling window N bars back → now, while still measuring all volume since session start.
Why it’s useful
Think in terms of nested probability distributions: the rolling node is your local Gaussian; the session node is its parent.
VA↔VA overlap ≈ strong range boundary.
POC↔POC alignment ≈ reliable mean-reversion target.
LVNs (gaps) ≈ low-friction corridors—expect quick moves to the next node.
Quick start
Add to chart (great on 5–10s, 15–60s, 1–5m).
Start with: bins = 240, vaPct = 0.68, barsBack = 60.
Watch for:
First test & rejection at overlapping VALs/VAHs → fade back toward POC.
Acceptance beyond VA (several closes + growing outer-bin mass) → traverse to the next node.
Inputs (detailed)
General
Lookback Bars (Rolling)
Count of most-recent bars for the rolling/local histogram. Larger = smoother node that shifts slower; smaller = more reactive, “breathing” profile.
• Typical: 40–80 on 5–10s charts; 60–120 on 1–5m.
• If you increase this but keep Number of Bins fixed, each bin aggregates more volume (coarser bins).
Number of Bins
Vertical resolution (price buckets) for both rolling and session histograms. Higher = finer detail and crisper LVNs, but more line objects (closer to platform limits).
• Typical: 120–240 on 5–10s; 80–160 on 1–5m.
• If you hit performance or object limits, reduce this first.
Value Area %
Exact central coverage for VAH/VAL around POC. Computed empirically from the histogram (no Gaussian assumption): the algorithm expands from POC outward until the chosen % is enclosed.
• Common: 0.68 (≈“1σ-like”), 0.70 for slightly wider core.
• Smaller = tighter VA (more breakout flags). Larger = wider VA (more reversion bias).
Max Local Profile Width (px)
Horizontal length (in pixels) of the rolling bars/lines and its VA/POC overlays. Visual only (does not affect calculations).
Session Settings
RTH Start/End (exchange tz)
Defines the current session anchor (Premkt=00:00, RTH=your start, AH=your end). The session histogram always measures from the most recent session start and resets at each boundary.
Session Max Span (bars, 0 = full session)
Display window for session drawings (POC/VA/Histogram).
• 0 → draw from session start → now (anchored).
• > 0 → draw N bars back → now (rolling look), while still measuring all volume since session start.
This keeps the “parent” distribution measurable while letting the display track current action.
Local (Rolling) — Visibility
Show Local Profile Bars / POC / VAH & VAL
Toggle each overlay independently. If you approach object limits, disable bars first (POC/VA lines are lighter).
Local (Rolling) — Colors & Widths
Color by Buy/Sell Dominance
Fast uptick/downtick proxy over the rolling window (close vs open):
• Buying ≥ Selling → Bullish Color (default lime).
• Selling > Buying → Bearish Color (default red).
This color drives local bars, local POC, and local VA lines.
• Disable to use fixed Bars Color / POC Color / VA Lines Color.
Bars Transparency (0–100) — alpha for the local histogram (higher = lighter).
Bars Line Width (thickness) — draw thin-line profiles or chunky blocks.
POC Line Width / VA Lines Width — overlay thickness. POC is dashed, VAH/VAL solid by design.
Session — Visibility
Show Session Profile Bars / POC / VAH & VAL
Independent toggles for the session layer.
Session — Colors & Widths
Bars/POC/VA Colors & Line Widths
Fixed palette by design (default blue). These do not change with buy/sell dominance.
• Use transparency and width to make the parent profile prominent or subtle.
• Prefer minimal? Hide session bars; keep only session VA/POC.
Reading the signals (detailed playbook)
Core definitions
POC — highest-volume bin (fair price “magnet”).
VAH/VAL — upper/lower bounds enclosing your Value Area % around POC.
Node — contiguous block of high-volume bins (acceptance).
LVN — low-volume gap between nodes (low friction path).
Rejection vs Acceptance (practical rule)
Rejection at VA edge: 0–1 closes beyond VA and no persistent growth in outer bins.
Acceptance beyond VA: ≥3 closes beyond VA and outer-bin mass grows (e.g., added volume beyond the VA edge ≥ 5–10% of node volume over the last N bars). Treat acceptance as regime change.
Confluence scores (make boundary/target quality objective)
VA overlap strength (range boundary):
C_VA = 1 − |VA_edge_local − VA_edge_session| / ATR(n)
Values near 1.0 = tight overlap (stronger boundary).
Use: if C_VA ≥ 0.6–0.8, treat as high-quality fade zone.
POC alignment (magnet quality):
C_POC = 1 − |POC_local − POC_session| / ATR(n)
Higher C_POC = greater chance a rotation completes to that fair price.
(You can estimate these by eye.)
Setups
1) Range Fade at VA Confluence (mean reversion)
Context: Local VAL/VAH near Session VAL/VAH (tight overlap), clear node, local color not screaming trend (or flips to your side).
Entry: First test & rejection at the overlapped band (wick through ok; prefer close back inside).
Stop: A tick/pip beyond the wider of the two VA edges or beyond the nearest LVN, a small buffer zone can be used to judge whether price is truly rejecting a VAL/VAH or simply probing.
Targets: T1 node mid; T2 POC (size up when C_POC is high).
Flip: If acceptance (rule above) prints, flip bias or stand down.
2) LVN Traverse (continuation)
Context: Price exits VA and enters an LVN with acceptance and growing outer-bin volume.
Entry: Aggressive—first close into LVN; Conservative—retest of the VA edge from the far side (“kiss goodbye”).
Stop: Back inside the prior VA.
Targets: Next node’s VA edge or POC (edge = faster exits; POC = fuller rotations).
Note: Flatter VA edge (shallower curvature) tends to breach more easily.
3) POC→POC Magnet Trade (rotation completion)
Context: Local POC ≈ Session POC (high C_POC).
Entry: Fade a VA touch or pullback inside node, aiming toward the shared POC.
Stop: Past the opposite VA edge or LVN beyond.
Target: The shared POC; optional runner to opposite VA if the node is broad and time-of-day is supportive.
4) Failed Break (Reversion Snap-back)
Context: Push beyond VA fails acceptance (re-enters VA, outer-bin growth stalls/shrinks).
Entry: On the re-entry close, back toward POC.
Stop/Target: Stop just beyond the failed VA; target POC, then opposite VA if momentum persists.
How to read color & shape
Local color = most recent sentiment:
Green = buying ≥ selling; Red = selling > buying (over the rolling window). Treat as context, not a standalone signal. A green local node under a blue session VAH can still be a fade if the parent says “over-valued.”
Shape tells friction:
Fat nodes → rotation-friendly (fade edges).
Sharp LVN gaps → traversal-friendly (momentum continuation).
Time-of-day intuition
Right after session anchor (e.g., RTH 09:30): Session profile is young and moves quickly—treat confluence cautiously.
Mid-session: Cleanest behavior for rotations.
Close / news: Expect more traverses and POC migrations; tighten risk or switch playbooks.
Risk & execution guidance
Use tight, mechanical stops at/just beyond VA or LVN. If you need wide stops to survive noise, your entry is late or the node is unstable.
On micro-timeframes, account for fees & slippage—aim for targets paying ≥2–3× average cost.
If acceptance prints, don’t fight it—flip, reduce size, or stand aside.
Suggested presets
Scalp (5–10s): bins 120–240, barsBack 40–80, vaPct 0.68–0.70, local bars thin (small bar width).
Intraday (1–5m): bins 80–160, barsBack 60–120, vaPct 0.68–0.75, session bars more visible for parent context.
Performance & limits
Reuses line objects to stay under TradingView’s max_lines_count.
Very large bins × multiple overlays can still hit limits—use visibility toggles (hide bars first).
Session drawings use time-based coordinates to avoid “bar index too far” errors.
Known nuances
Rolling buy/sell dominance uses a simple uptick/downtick proxy (close vs open). It’s fast and practical, but it’s not a full tape classifier.
VA boundaries are computed from the empirical histogram—no Gaussian assumption.
This script does not calculate the full daily volume profile. Several other tools already provide that, including TradingView’s built-in Volume Profile indicators. Instead, this indicator focuses on pairing a rolling, short-term volume distribution with a session-wide distribution to make ranges more explicit. It is designed to supplement your use of standard or periodic volume profiles, not replace them. Think of it as a magnifying lens that helps you see where local structure aligns with the broader session.
How to trade it (TL;DR)
Fade overlapping VA bands on first rejection → target POC.
Continue through LVN on acceptance beyond VA → target next node’s VA/POC.
Respect acceptance: ≥3 closes beyond VA + growing outer-bin volume = regime change.
FAQ
Q: Why 68% Value Area?
A: It mirrors the “~1σ” idea, but we compute it exactly from empirical volume, not by assuming a normal distribution.
Q: Why are my profiles thin lines?
A: Increase Bars Line Width for chunkier blocks; reduce for fine, thin-line profiles.
Q: Session bars don’t reach session start—why?
A: Set Session Max Span (bars) = 0 for full anchoring; any positive value draws a rolling window while still measuring from session start.
Changelog (v1.0)
Dual profiles: Rolling + Session with independent POC/VA lines.
Session anchoring (Premkt/RTH/AH) with optional rolling display span.
Dynamic coloring for the rolling profile (buying vs selling).
Fully modular toggles + per-feature colors/widths.
Thin-line rendering via bar line width.

ICT Sessions, version 1.0Draws a box between the high and low of each of the ICT sessions:
Tokyo session
London session
New York session
signBTC Day&Session BoxesThis indicator visually segments the trading week on your chart, drawing each day from 17:00 to 17:00 New York time (corresponding to the typical forex daily rollover). For enhanced session structure, every day is further divided into three major trading sessions:
Asian Session
London Session
New York Session
Additionally, the indicator automatically marks the opening time of each new day at 17:00 (New York time) directly on the chart, helping traders quickly identify daily cycles and session transitions.
Customization Features
Adjustable Session Times: Users can modify the start and end times for each session (Asian, London, New York) to match personal or institutional trading hours.
Flexible Day Boundaries: The time marking the start and end of each day (default: 17:00 NY) can also be adjusted according to preference or asset specifics.
Opening Time Marker: The feature for drawing the daily opening time can be enabled or disabled in the settings.
This tool is ideal for traders needing clear visual cues for session boundaries and daily market resets, especially those operating across multiple time zones or managing strategies dependent on session-specific behavior. All settings are conveniently accessible and fully customizable within the indicator’s parameter panel.

HSI Market sessions and Volume profileHSI Market Sessions and Volume Profile
Unlock deeper market insight with this advanced volume profile indicator tailored for Hang Seng Index (HSI) and other futures instruments. This tool combines session-based volume analysis, customizable profiles, and intraday tracking for superior market structure awareness.
🔍 Key Features:
Dynamic Volume Profile: View aggregated buy/sell volume or open interest delta across customizable price zones.
POC, VAH, VAL Lines: Instantly spot the Point of Control, Value Area High, and Value Area Low for each session.
Flexible Session Options: Analyze market behavior by Tokyo, London, New York, or standard timeframes like Daily, Weekly, Monthly, Quarterly, or Yearly.
Live Zone Tracking: Stay ahead with real-time profiling of the current session.
Forex Box Option: Visualize forex trading zones even without volume profiles.
Highly Configurable: Choose from three display modes, resolution settings, and color schemes to fit your style and precision needs.
🧠 Smart Mechanics:
Adaptive to both Volume and Open Interest data.
Built-in smoothing algorithm for cleaner profiles in high-volatility assets.
Auto-reset and draw logic based on session type and bar resolution.
Intrabar data handling for more granular profiling (requires lower timeframe input).
✅ Ideal For:
HSI Futures Traders looking for market session clarity and volume zones.
Volume Profile Analysts needing flexible, session-specific profile rendering.
Day Traders and Swing Traders who value precision in trade planning.

VWAP Balance Zones - SessionsVWAP Balance Zones Sessions Version is an alternate take on the Original VWAP Balance Zones indicator. The Sessions version allows users to select a specific session to view the VWAP Balance Zones at while still utilizing the full ETH Data.
The Session version provides a better focused display while still maintaining the core functions of the original script with mindful optimizations.
Author's Note: "VBZ Sessions was made with logistics in mind, for the users who only trade within certain times of the day. While it displays the same core concepts, it is not as "Raw" of a display as the Original. For this reason, some users may prefer the Original VWAP Balance Zones, which is why I have opted to release this alternate version instead of updating the original."
> What are VWAP Balance Zones?
"VWAP Balance Zones" is an original concept aimed at identifying the equilibrium area between market participants within the current trend by averaging the Daily Extremes and the Daily VWAP.
Refer to the illustration below for a better understanding of exactly how VWAP Balance Zones are formed:
These zones are displayed for the Daily, Weekly, and Monthly VWAPs, with the most interactive timeframe being the Daily.
> Features
1. The Session Version uses ETH data at all times, and does not solely rely on the chart's data to create the VWAPs or Zones.
This allows the user to focus on a specific trading session, while not losing out on the full VBZ Calculation, with the notable benefit of a cleaner display.
The Original VBZ starts drawing at the beginning of the chart's "Day", and would produce different results when using an RTH chart vs an ETH chart. Along with creating a bird's nest of unusable data at the beginning of the day.
2. Session Start and End lines are displayed for easier identification of the designated trading session.
3. The extreme "Close" Lines are no longer displayed to reduce noise and redundancy.
4. Additionally, the interior VWAP lines are no longer displayed. Ultimately, this was to reduce noise and focus the script on the 50% zones.
5. Weekly and Monthly Zones are now displayed due to the reduced noise!
6. As with the original, the weekly display will yield to the daily, and the monthly display will yield to the weekly.
In the screenshot below, you can observe this behavior.
Enjoy!

Macros ICT KillZones [TradingFinder] Times & Price Trading Setup🔵 Introduction
ICT Macros, developed by Michael Huddleston, also known as ICT (Inner Circle Trader), is a powerful trading tool designed to help traders identify the best trading opportunities during key time intervals like the London and New York trading sessions.
For traders aiming to capitalize on market volatility, liquidity shifts, and Fair Value Gaps (FVG), understanding and using these critical time zones can significantly improve trading outcomes.
In today’s highly competitive financial markets, identifying the moments when the market is seeking buy-side or sell-side liquidity, or filling price imbalances, is essential for maximizing profitability.
The ICT Macros indicator is built on the renowned ICT time and price theory, which enables traders to track and leverage key market dynamics such as breaks of highs and lows, imbalances, and liquidity hunts.
This indicator automatically detects crucial market times and optimizes strategies for traders by highlighting the specific moments when price movements are most likely to occur. A standout feature of ICT Macros is its automatic adjustment for Daylight Saving Time (DST), ensuring that traders remain synced with the correct session times.
This means you can rely on accurate market timing without the need for manual updates, allowing you to focus on capturing profitable trades during critical timeframes.
🔵 How to Use
The ICT Macros indicator helps you capitalize on trading opportunities during key market moments, particularly when the market is breaking highs or lows, filling Fair Value Gaps (FVG), or addressing imbalances. This indicator is particularly beneficial for traders who seek to identify liquidity, market volatility, and price imbalances.
🟣 Sessions
London Sessions
London Macro 1 :
UTC Time : 06:33 to 07:00
New York Time : 02:33 to 03:00
London Macro 2 :
UTC Time : 08:03 to 08:30
New York Time : 04:03 to 04:30
New York Sessions
New York Macro AM 1 :
UTC Time : 12:50 to 13:10
New York Time : 08:50 to 09:10
New York Macro AM 2 :
UTC Time : 13:50 to 14:10
New York Time : 09:50 to 10:10
New York Macro AM 3 :
UTC Time : 14:50 to 15:10
New York Time : 10:50 to 11:10
New York Lunch Macro :
UTC Time : 15:50 to 16:10
New York Time : 11:50 to 12:10
New York PM Macro :
UTC Time : 17:10 to 17:40
New York Time : 13:10 to 13:40
New York Last Hour Macro :
UTC Time : 19:15 to 19:45
New York Time : 15:15 to 15:45
These time intervals adjust automatically based on Daylight Saving Time (DST), helping traders to enter or exit trades during key market moments when price volatility is high.
Below are the main applications of this tool and how to incorporate it into your trading strategies :
🟣 Combining ICT Macros with Trading Strategies
The ICT Macros indicator can easily be used in conjunction with various trading strategies. Two well-known strategies that can be combined with this indicator include:
ICT 2022 Trading Model : This model is designed based on identifying market liquidity, structural price changes, and Fair Value Gaps (FVG). By using ICT Macros, you can identify the key time intervals when the market is seeking liquidity, filling imbalances, or breaking through important highs and lows, allowing you to enter or exit trades at the right moment.
Silver Bullet Strategy : This strategy, which is built around liquidity hunting and rapid price movements, can work more accurately with the help of ICT Macros. The indicator pinpoints precise liquidity times, helping traders take advantage of market shifts caused by filling Fair Value Gaps or correcting imbalances.
🟣 Capitalizing on Price Volatility During Key Times
Large market algorithms often seek liquidity or fill Fair Value Gaps (FVG) during the intervals marked by ICT Macros. These periods are when price volatility increases, and traders can use these moments to enter or exit trades.
For example, if sell-side liquidity is drained and the market fills an imbalance, the price might move toward buy-side liquidity. By identifying these moments, which may also involve breaking a previous high or low, you can leverage rapid market fluctuations to your advantage.
🟣 Identifying Liquidity and Price Imbalances
One of the important uses of ICT Macros is identifying points where the market is seeking liquidity and correcting imbalances. You can determine high or low liquidity levels in the market before each ICT Macro, as well as Fair Value Gaps (FVG) and price imbalances that need to be filled, using them to adjust your trading strategy. This capability allows you to manage trades based on liquidity shifts or imbalance corrections without needing a bias toward a specific direction.
🔵 Settings
The ICT Macros indicator offers various customization options, allowing users to tailor it to their specific needs. Below are the main settings:
Time Zone Mode : You can select one of the following options to define how time is displayed:
UTC : For traders who need to work with Universal Time.
Session Local Time : The local time corresponding to the London or New York markets.
Your Time Zone : You can specify your own time zone (e.g., "UTC-4:00").
Your Time Zone : If you choose "Your Time Zone," you can set your specific time zone. By default, this is set to UTC-4:00.
Show Range Time : This option allows you to display the time range of each session on the chart. If enabled, the exact start and end times of each interval are shown.
Show or Hide Time Ranges : Toggle on/off for visual clarity depending on user preference.
Custom Colors : Set distinct colors for each session, allowing users to personalize their chart based on their trading style.These settings allow you to adjust the key time intervals of each trading session to your preference and customize the time format according to your own needs.
🔵 Conclusion
The ICT Macros indicator is a powerful tool for traders, helping them to identify key time intervals where the market seeks liquidity or fills Fair Value Gaps (FVG), corrects imbalances, and breaks highs or lows. This tool is especially valuable for traders using liquidity-based strategies such as ICT 2022 or Silver Bullet.
One of the key features of this indicator is its support for Daylight Saving Time (DST), ensuring you are always in sync with the correct trading session timings without manual adjustments. This is particularly beneficial for traders operating across different time zones.
With ICT Macros, you can capitalize on crucial market opportunities during sensitive times, take advantage of imbalances, and enhance your trading strategies based on market volatility, liquidity shifts, and Fair Value Gaps.

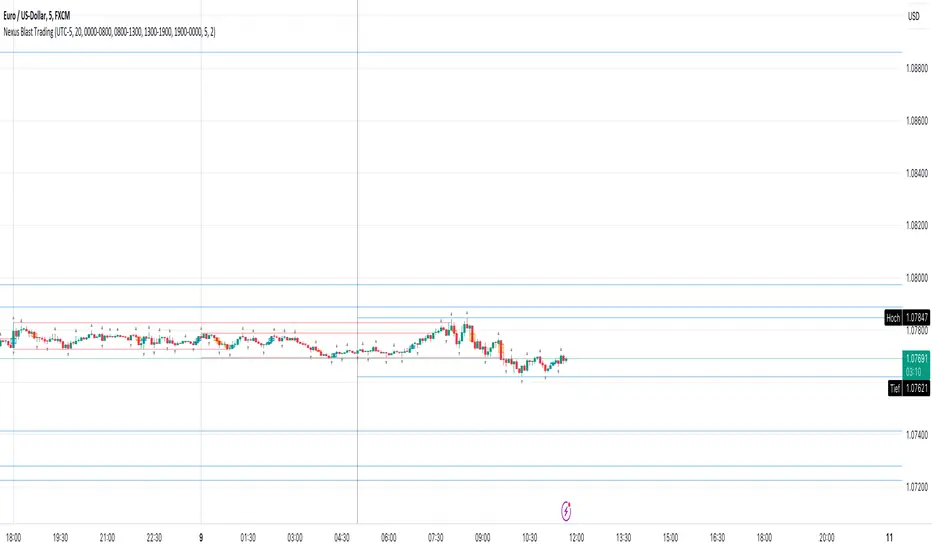
Nexus Blast Trading Strategy [Kaspricci]Nexus Blast Trading Strategy - Kaspricci
This indicator shows the different sessions during the day (London session, New York AM session, New York PM session and Asian session) by adding vertical lines and draws horizontal lines for the high and low during each session. Furthermore those lines turn red once the price has taken this high or low. Blue lines indicate liquidity not yet taken.
On top the indicator draws boxes of different color to indicate bullish and bearish Fair Value Gaps (FVG).
Happy to receive your feedback. Please leave a comment for bugs as well as ideas for improvement.
General Settings
Time Zone - used for marking sessions and end of day.
Sessions
Sessions - start and end time for each session based on set time zone
Number of Days back - for how many days in the past the startegy will draw strategy highs and lows. Theres is a maximum of 50 days defined.
FVG Settings
Threshold in Ticks - you can hide very small FVGs by increasing this threshold
FVG Colors - colors used for the bearish and bullish FVG box
This script is for educational purposes only! It is not meant to be a financial advice.
PS: The former strategy script was removed by TV, as it would violate several rules according to them.
Diddly - Charts (Asian, London & New York Session + Weekdays)Overview:
Diddly Charts is for providing intraday context to where we are in the market. It does this through a series of ranges displayed throughout the day, typically broken down into the Asian, London, and New York sessions.
This indicator also highlights key market structures like monthly, weekly, and previous day's highs and lows. Lines are provided for weekday and weekend separators, with the days of the week at the bottom of the chart, making it extremely useful for traders when identifying weekly cycles.
Usage:
All aspects of this indicator are changeable within the settings, allowing you to utilise the elements that are most important to your trading strategy.
The default layout is extremely useful for currency pairs, where traders use the London and New York boxes as windows of when to engage with the market. The times of these trading sessions can be changed to suit the trading periods that you want to trade.
Adhering to trading windows can help improve discipline to ensure that you are only taking entries within the time periods that match your trading strategy.
Some traders prefer a cleaner interface and don't want any indicator to detract from the price action they are reading, this can be achieved through changing the colour and their transparency in settings. In this example, you will see different labels used to annotate key structures, these can be changed to something that is relevant to your strategy in the settings.
It can also be used for trading Stocks where sessions are broken down into pre-market, market hours and post-market. This can be helpful to see those stocks that breakout of pre-market session highs and lows and also provide trading windows to keep traders out of trades that do not comply with their trading strategy.
Using higher time frames like a 4 hour chart or even the 1 hour chart, the intraday sessions are hidden away so traders can get a broader perspective without the clutter when zooming out. Although there are options to turn it on if you would prefer.
Here on a zoomed out 1 hour chart we have the option to only display the weekly line separator, which can help get an overview of weekly cycles.
Helpful Information
The main setting that you may want to change is at the top of the indicator settings, which is asking "what asset type" is the symbol being looked at. The indicator needs to know how to display the session range information. For example for currencies, the range size will be displayed in pips. For stocks or Futures it would display the financial amount. Beyond the visual display of information, this setting has no other impact on the indicator behaviour. The default setting is "Currencies".
We often get asked what the labels that appear on the chart mean. These can all be changed to your requirements, but by default what you will see when you apply the indicator to the chart is:
Under the Asian Range appears a couple of labels.
A = x : This is the range size of the session in pips for forex or amount for other assets, from the lowest to the highest price traded during that window.
ADR = y : This is the Average Daily Range over the last 21 days for this ticker
Under the London and New York session you will see a L = x or NY = y . This is the range size of each session in pips for forex or amount for other assets.
Structure Labels
YH = Yesterday's High
YL = Yesterday's Low
WH = Current Week's High
WL = Current Week's Low
MH = Current Month's High
ML = Current Month's Low
We greatly appreciate the support and feedback from the Trading View community, and we are dedicated to continuing to improve our indicators with your support.
We want to help you manage risk, and that's why we emphasise that trading is risky and any technology used to support our trading decisions is based on information from the past. We encourage traders to take responsibility for their trading businesses and always prioritise risk management.

All in OneSettings
Inputs for Lines
1. Last Price - Price follows the candle. Bullish candle - price level green, Bearish candle - price level red
2. Daily Open - Today's Daily Open line. Price above Daily open line - color green, Price below Daily open line - color red
3. Previous High Low/b] - Shows Yesterday's High Low lines. (PH - Previous High, PL - Previous Low) Yesterday's Range (Pips range)
4. Daily Zone - Shows Zones calculated by 5% of Yesterday's Range. High Low zones
Color - Color option for Previous High Low, Daily Zone and Daily range
Inputs for PPL's
1. Show PPL 300 pips range - Shows Round numbers between 300 pips range. Follows price. (PPL-Perfect Price Levels .500 1.000 levels
2. Show Minor PPL - Shows round numbers between 50 pips range. Minor PPL .200 .800 levels
3. Add PPL 500 pips range/b] - Shows round numbers between 500 pips range.
Inputs for Session
Show X days Candle History - Shows X days Forex Session open close candle history. 0 shows only today's session.
1. Show Full candle history - Shows all days Session open close candle history. For Replay mode. Default is false
2. PreLondon Open candle - Arrow appears above or below candle.(PL - PreLondon 2 hours before London Open) Bullish candle - green arrow below the candle, Bearish candle - red arrow above the candle
3. London Open Close - Arrow appears above or below candle.(LO - London Open, LC - London Close) Bullish candle - green arrow below the candle, Bearish candle - red arrow above the candle
4. Newyork Open Close - Arrow appears above or below candle.(NO - Newyork Open, NC - Newyork Close) Bullish candle - green arrow below the candle, Bearish candle - red arrow above the candle
5. Daylight Saving Time shift? - Arrow shifts 1 hour.(Winter time - Oct to Mar, Summer time - Mar to Oct) Default is for summer time
Style
1. Labels - Shows labels and prices for lines. DO price, PH and PL prices, Daily Pips range and PPL price levels
2. Lines - Shows lines and Last Session break. DO line, PH and PL lines, Daily zone lines, Last Session break and PPL lines [/i
Recommended Forex brokers - Forex.com, OANDO, FXCM, Saxo and CURRENCYCOM for indicies

Forex session - Opening Range- Jayy fixed updatedOpening Range (OR) for Forex 24 hour regular session. This is not for regular market day sessions addressed in a separate script.
This script fixes four issues:
syntax error when code compiles
messed up opening range the day after a holiday Monday
flaky plotting of the opening range and targets that required page reloading
TradingView problems with starting forex session at 1700 hours EST/EDT when using certain securities eg FX_IDC currently (Jan 2017)
Additions in his code are more options for trading range
Time compensation option for some securities that incorrectly start sessions at 1200 hrs instead of 1700 hrs NY time
- this glitch is likely temporary but present when this script update was created
More opening range time period choices
Opening Range Targets:
Opening Range Targets as per Leaf_West
Targets are set at 127% , 162%, 200 %, 262 %, 362%, 423%, 685%, 1109% and 1794% and this can be traded intraday using methods described here charts-by-leaf.com I also have some Leaf West PDFs that describe how the targets are set and how they are traded. There are others that use opening range.
The Time Session Glitch and the Fix:
The script will correctly default to 1700 hrs to 1700hrs EDT/EST session for FXCM.
Strangely some securities appear to erroneously start their session at 1200 hrs ie. My guess is that they are somehow tied to GMT+0 instead of New York time (GMT+5). See this for yourself by selecting EURUSD using the FXCM exchange (FX:EURUSD) and then EURUSD from the IDC exchange (FX_IDC:EURUSD). The FX-IDC session opening range starts 5 hours
before it actually should at 1700 hrs EDT/EST. To correct for this I have implemented an automatic fix (default) and a user selected "5 hour time shift adjust. ment needed on some securities".
There is also a 4 hour time shift button which might be necessary when New York reverts from Eastern Standard Time
to Eastern Daylight Time (1 hour difference) in March (and then back again in November). In the default auto adjust mode you will need to select the 1 hour time shift. That is if this glitch still exists at that time.
I have looked at other scripts, other than my own and where the script is available, that need to use information about the opening bar and all have the same time shift issue
What are the choices for Opening Range?
The dialogue box offers the standard TradingView options.
Also where you see Pick Opening Range 1 to 12 hours , SET TO 0 To USE LINE ABOVE TO DETERMINE OR LENGTH
As the note says a number other than 0 will override the standard options from the line above
The dialogue box below in offers choices by hours 1 to 12. A number greater than 12 will still only give
720 minutes (12 hours) for the length of Opening Range.
What sessions within the FOREX time-frame are available?
The default is 1700 hours to 1700 hours EST/EDT
Check any one (only one) of the time periods to change the opening range period to suit.
New York opens at 8:00 am to 5:00 pm EST (EDT)
Tokyo opens at 7:00 pm to 4:00 am EST (EDT)
Sydney opens at 5:00 pm to 2:00 am EST (EDT)
London opens at 3:00 am to 12:00 noon EST (EDT)
There is a build your own session (click the button to select)
The two lines for inputting session times are almost identical except that the second line starts the be the same as each other.
The default for the build your own session is 2200 hours to 2200 hours. As of the time of publishing this plots EURUSD FX-IDC just right. The GMT+5 and GMT+4 do not apply to this selection.
See my comments above on this strange aberration.
The script originated from work done by Chris Moody. It has changed significantly but there are remnants of that script lurking within.
Script is free to all - that way you can see what is inside
Cheers Jayy

Key levels by Chav3zNY-Time Anchored Sessions
Visualizes the Asia, London, and New York sessions using customizable boxes or high/low lines. Unlike standard session indicators, this tool uses the America/New York time zone to ensure your session start and end times remain accurate throughout Daylight Savings changes.
2. Dynamic HTF Key Levels (PDH/PDL, PWH/PWL, PMH/PML)
Automatically plots the Previous Daily, Weekly, and Monthly Highs and Lows.
Clean Intraday Origin: To prevent "chart clutter," these lines do not drag across the entire historical data. They originate at the start of the current day (NY Midnight), providing a clean horizontal reference for the current trading session.
Lookback Control: Choose how many days of historical key levels you want to remain visible on your chart.
3. Custom Time-Anchored Levels
Includes two fully customizable "Price Anchors" (e.g., Midnight Open, 09:30 AM NY Open).
Origin Point Precision: Lines start exactly at the candle of the specified time (e.g., 09:30) and extend forward, rather than drawing through the pre-market.
Price Capture: Choose to anchor to the Open, High, or Low of that specific timestamp.
4. Full Aesthetic Customization
Every level (Daily, Weekly, Monthly, and Custom) can be individually styled:
Color & Visibility: Set each level to your preferred color (Defaulted to Black for a clean look).
Line Style: Toggle between Solid, Dashed, or Dotted lines.
Thickness: Adjust the line width (1px, 2px, etc.) for better visibility on high-resolution screens.
How to Use
Midnight Open: Set Level 1 to 0000 to track the Daily Open, a crucial level for determining daily bias.
NY Open: Set Level 2 to 0930 to mark the "Opening Range" anchor for the New York session.
Liquidity Targets: Use the PDH/PDL and PWH/PWL levels to identify draw-on-liquidity areas for intraday scalp or swing setups.
