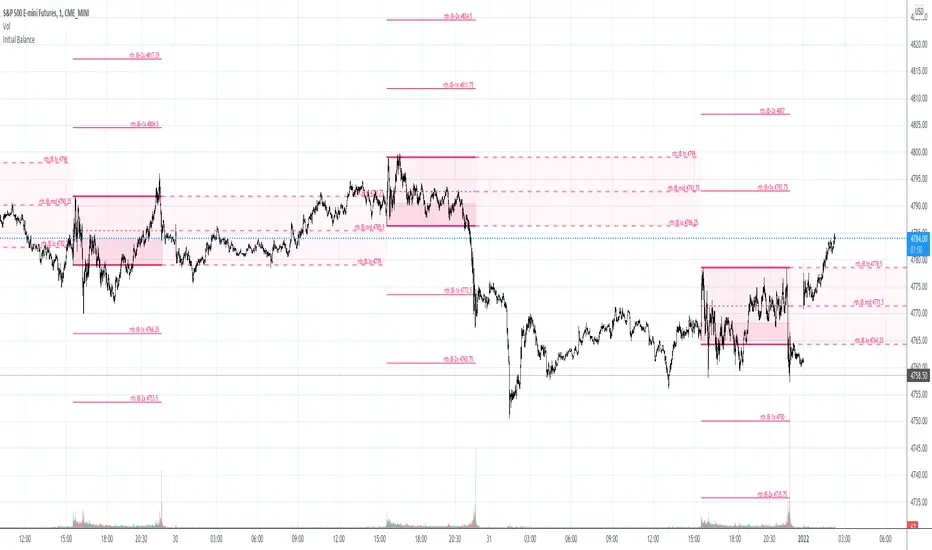
Daily Manipulation and Distribution Levels with Buy/Sell SignalsIndicator Summary:
This indicator is designed for intraday traders, highlighting key price levels and providing simple buy/sell signals based on price manipulation and distribution concepts.
Key Features:
Core Levels:
Manipulation Plus/Minus: Derived from the daily open and a portion of the daily range (e.g., 25%).
Distribution Levels: Daily high and low serve as ultimate targets or resistance/support levels.
Buy and Sell Signals:
Buy Signal: Triggered when the price crosses above the Manipulation Plus level. A green "BUY" label marks the entry.
Sell Signal: Triggered when the price crosses below the Manipulation Minus level. A red "SELL" label marks the entry.
Clean Chart Design:
Hides unnecessary clutter, showing only relevant key levels and labeled signals for clarity.
How to Use:
Entry Points:
Buy Entry: When a green "BUY" label appears after the price breaks above the Manipulation Plus level.
Sell Entry: When a red "SELL" label appears after the price breaks below the Manipulation Minus level.
Exit Strategy:
Take Profit: Use the Distribution Levels (daily high/low) as take-profit zones.
Stop Loss: Set just above/below the Manipulation Levels to manage risk effectively.
One to Two Trades per Session: Focus on high-probability moves to ensure clarity and reduce overtrading.
Who It’s For:
This indicator is ideal for traders seeking a structured and visual approach to intraday trading, with clear entry/exit criteria based on price manipulation and distribution theory. It simplifies decision-making and ensures clean chart setups without overwhelming visuals.
在腳本中搜尋"session"
Chartonaut: GlimpseDisplays an overview of some key metrics as a table.
Market Cap : value of the company.
Float Shares : number of shares available for trading.
AR# : average range over the last # sessions.
ATR# : average true range over the last # sessions.
ATR#/MA# : distance of the current price from the given moving average (MA) in terms of ATR multiples.
Rel Volatility : current session's range, including gaps from previous close, relative to the ATR.
Additionally, it highlights some metrics if they are crossing a given threshold, as to warn that some criteria might not be met.
ka66: Bar Range BandsThis tool takes a bar's range, and reflects it above the high and below the low of that bar, drawing upper and lower bands around the bar. Repeated for each bar. There's an option to then multiply that range by some multiple. Use a value greater than 1 to get wider bands, and less than one to get narrower bands.
This tool stems out of my frustration from the use of dynamic bands (like Keltner Channels, or Bollinger Bands), in particular for estimating take profit points.
Dynamic bands work great for entries and stop loss, but their dynamism is less useful for a future event like taking profit, in my experience. We can use a smaller multiple, but then we can often lose out on a bigger chunk of gains unnecessarily.
The inspiration for this came from a friend explaining an ICT/SMC concept around estimating the magnitude of a trend, by calculating the Asian Session Range, and reflecting it above or below on to the New York and London sessions. He described this as standard deviation of the Asian Range, where the range can thus be multiplied by some multiple for a wider or narrower deviation.
This, in turn, also reminded me of the Measured Move concept in Technical Analysis. We then consider that the market is fractal in nature, and this is why patterns persist in most timeframes. Traders exist across the spectrum of timeframes. Thus, a single bar on a timeframe, is made up of multiple bars on a lower timeframe . In other words, when we reflect a bar's range above or below itself, in the event that in a lower timeframe, that bar fit a pattern whose take profit target could be estimated via a Measured Move , then the band's value becomes a more valid estimate of a take profit point .
Yet another way to think about it, by way of the fractal nature above, is that it is essentially a simplified dynamic support and resistance mechanism , even simpler than say the various Pivot calculations (e.g. Classical, Camarilla, etc.).
This tool in general, can also be used by those who manually backtest setups (and certainly can be used in an automated setting too!). It is a research tool in that regard, applicable to various setups.
One of the pitfalls of manual backtesting is that it requires more discipline to really determine an exit point, because it's easy to say "oh, I'll know more or less where to exit when I go live, I just want to see that the entry tends to work". From experience, this is a bad idea, because our mind subconsciously knows that we haven't got a trained reflex on where to exit. The setup may be decent, but without an exit point, we will never have truly embraced and internalised trading it. Again, I speak from experience!
Thus, to use this to research take profit/exit points:
Have a setup in mind, with all the entry rules.
Plot your setup's indicators, mark your signals.
Use this indicator to get an idea of where to exit after taking an entry based on your signal.
Credits:
@ICT_ID for providing the idea of using ranges to estimate how far a trend move might go, in particular he used the Asian Range projected on to the London and New York market sessions.
All the technicians who came up with the idea of the Measured Move.
God's of LiquidityHere’s a detailed description for your script, following the guidelines for clarity and originality:
---
**Title:** God's of Liquidity
**Description:**
The "Gods of Liquidity" script is a comprehensive trading tool designed to help traders identify high-probability buy and sell opportunities based on a combination of liquidity levels, RSI-based sentiment analysis, and session-specific filters.
**Key Features:**
1. **Liquidity Zones Identification:**
- The script dynamically calculates the previous day's high and low levels, which serve as critical liquidity zones. Traders can use these levels to spot potential breakout points and reversals.
2. **RSI-Based Sentiment Analysis:**
- The script incorporates a sophisticated RSI-based sentiment model that differentiates between institutional (Banker) and retail (Hot Money) activity. This dual RSI approach allows traders to gauge market sentiment and anticipate shifts in momentum.
- **Banker RSI:** Measures the sentiment of institutional traders, with customizable sensitivity and period parameters.
- **Hot Money RSI:** Measures retail trader sentiment, with its own adjustable settings to tailor the script to various market conditions.
3. **Session and Day Filters:**
- Traders can restrict signals to specific trading sessions and days of the week, providing greater control and precision in executing trades. This feature is particularly useful for aligning trading activity with market conditions that best suit the strategy.
4. **Breakout and Reversal Signals:**
- The script generates buy signals when the price breaks above the previous day's high, accompanied by bullish RSI sentiment from institutional traders. Conversely, sell signals are generated when the price breaks below the previous day's low, with bearish institutional sentiment.
- These signals are visually marked on the chart, making it easier for traders to identify potential trading opportunities.
5. **Customizable Moving Averages:**
- The script allows users to customize the moving averages used in the RSI calculations, giving traders the flexibility to adapt the tool to their specific trading style and market conditions.
6. **Alert System:**
- Alerts are integrated to notify traders when buy or sell conditions are met, ensuring that traders can react promptly to potential trading opportunities without constantly monitoring the charts.
**How It Works:**
- The script uses the previous day's high and low as key liquidity levels. The price crossing these levels, combined with RSI-based signals, indicates potential buy or sell opportunities.
- The sentiment analysis is derived from the RSI values, with separate calculations for institutional and retail activities. The crossover points of these RSI values against their respective moving averages trigger buy or sell signals.
- The session and day filters allow traders to focus on the most relevant times for trading, enhancing the effectiveness of the strategy.
**Usage:**
- This indicator is designed for Forex traders who want to integrate liquidity zones and sentiment analysis into their trading strategy. It is particularly effective on daily or higher timeframes where liquidity levels and RSI-based sentiment analysis can provide strong indications of market direction.
- The script's flexibility in adjusting session times, days, and RSI parameters makes it suitable for a wide range of trading styles, from day trading to swing trading.
---
**License:**
This source code is subject to the terms of the Mozilla Public License 2.0 at (mozilla.org).
© bankbaguitarcrazy
---
This description should provide sufficient detail to comply with the publication guidelines, offering clear insight into how the script works and its unique features.
Backtest any Indicator v5Happy Trade,
here you get the opportunity to backtest any of your indicators like a strategy without converting them into a strategy. You can choose to go long or go short and detailed time filters. Further more you can set the take profit and stop loss, initial capital, quantity per trade and set the exchange fees. You get an overall result table and even a detailed, scroll-able table with all trades. In the Image 1 you see the provided info tables about all Trades and the Result Summary. Further more every trade is marked by a background color, Labels and Levels. An opening Label with the trade direction and trade number. A closing Label again with the trade number, the trades profit in % and the total amount of $ after all past trades. A green line for the take profit level and a red line for the stop loss.
Image 1
Example
For this description we choose the Stochastic RSI indicator from TradingView as it is. In Image 2 is shown the performance of it with decent settings.
Timeframe=45, BTCUSD, 2023-08-01 - 2023-10-20
Stoch RSI: k=30, d=40, RSI-length=140, stoch-length=140
Backtest any Indicator: input signal=Stoch RSI, goLong, take profit=9.1%, stop loss=2.5%, start capital=1000$, qty=5%, fee=0.1%, no Session Filter
Image 2
Usage
1) You need to know the name of the boolean (or integer) variable of your indicator which hold the buy condition. Lets say that this boolean variable is called BUY. If this BUY variable is not plotted on the chart you simply add the following code line at the end of your pine script.
For boolean (true/false) BUY variables use this:
plot(BUY ? 1:0,'Your buy condition hold in that variable BUY',display = display.data_window)
And in case your script's BUY variable is an integer or float then use instate the following code line:
plot(BUY ,'Your buy condition hold in that variable BUY',display = display.data_window)
2) Probably the name of this BUY variable in your indicator is not BUY. Simply replace in the code line above the BUY with the name of your script's trade condition variable.
3) Save your changed Indicator script.
4) Then add this 'Backtest any Indicator' script to the chart ...
5) and go to the settings of it. Choose under "Settings -> Buy Signal" your Indicator. So in the example above choose .
The form is usually: ' : BUY'. Then you see something like Image 2
6) Decide which trade direction the BUY signal should trigger. A go Long or a go Short by set the hook or not.
Now you have a backtest of your Indicator without converting it into a strategy. You may change the setting of your Indicator to the best results and setup the following strategy settings like Time- and Session Filter, Stop Loss, Take Profit etc. More of it below in the section Settings Menu.
Appereance
In the Image 2 you see on the right side the List of Trades . To scroll down you go into the settings again and decrease the scroll value. So you can see all trades that have happened before. In case there is an open trade you will find it at the last position of the list.
Every Long trade is green back grounded while Short trades are red.
Every trade begins with a label that show goLong or goShort and its number. And ends with another label again with its number, Profit in % and the resulting total amount of cash.
If activated you further see the Take Profit as a green line and the Stop Loss as a orange line. In the settings you can set their percentage above or below the entry price.
You also see the Result Summary below. Here you find the usual stats of a strategy of all closed trades. The profit after total amount of fees , amount of trades, Profit Factor and the total amount of fees .
Settings Menu
In the settings menu you will find the following high-lighted sections. Most of the settings have a question mark on their right side. Move over it with the cursor to read specific explanation.
Input Signal of your Indicator: Under Buy you set the trade signal of your Indicator. And under Target you set the value when a trade should happen. In the Example with the Stochastic RSI above we used 20. Below you can set the trade direction, let it be go short when hooked or go long when unhooked.
Trade Settings & List of Trades: Take Profit set the target price of any trade. Stop Loss set the price to step out when a trade goes the wrong direction. Check mark the List of Trades to see any single trade with their stats. In case that there are more trades as fits in the list you can scroll down the list by decrease the value Scroll .
Time Filter: You can set a Start Time or deactivate it by leave it unhooked. The same with End Time .
Session Filter: here you can choose to activate it on weekly base. Which days of the week should be trading and those without. And also on daily base from which time on and until trade are possible. Outside of all times and sessions there will be no new trades if activated.
Invest Settings: here you can choose the amount of cash to start with. The Quantity percentage define for every trade how much of the cash should be invested and the Fee percentage which have to be payed every trade. Open position and closing position.
Other Announcements
This Backtest script don't use the strategy functions of TradingView. It is programmed as an indicator. All trades get executed at candle closing. This script use the functionality "Indicator-on-Indicator" from TradingView.
Conclusion
So now it is your turn, take your promising indicators and connect it to that Backtest script. With it you get a fast impression of how successful your indicator will trade. You don't have to relay on coders who maybe add cheating code lines. Further more you can check with the Time Filter under which market condition you indicator perform the best or not so well. Also with the Session Filter you can sort out repeating good market conditions for your indicator. Even you can check with the GoShort XOR GoLong check mark the trade signals of you indicator in opposite trade direction with one click. And compare your indicators under the same conditions and get the results just after 2 clicks. Thanks to the in-build fee setting you get an impression how much a 0.1% fee cost you in total.
Cheers
Volume Profile [TFO]This indicator generates Volume Profiles from which to display insights about recent Volume Points of Control and High Volume Nodes. Volume Profile is a way to view trading volume by the price where trades have occurred, rather than the time when they occur (as seen by traditional Volume indicators).
By selecting a Resolution Timeframe (1m in this example), we can aggregate the volume at different prices to build a Volume Profile for a specified Profile Timeframe (1D in this example). In this indicator, we make the simple assumption that a given candle's volume is distributed evenly across all points. Realistically, this is seldom the case, but it gives us a starting point to easily estimate the volume at a given price, in turn helping us to build our profiles in a trivial way.
If we do this for all Resolution Timeframe candles within a Profile Timeframe (all 1m candles in a single 1D candle, in this example), then we can successfully aggregate this data and build a full Volume Profile. And thankfully, Pine Script's new polyline feature ultimately allow us to keep more Volume Profiles on our charts. Before polylines, we would have to consider using lines or boxes to represent the individual levels within a given profile, and each script currently has a cap of 500 lines and boxes, respectively. However, one single polyline can be used to draw the complex shape of an entire profile, and we may show up to 100 polylines in a given script. This helps us keep a lot more data on our charts!
Compared to TradingView's Session Volume Profile indicator (blue/yellow), we can see that our indicator (grey) is nearly identical, which verifies that our assumption of a uniform volume distribution is enough to roughly estimate a given Volume Profile. Note in this example the Row Size was set to 200, meaning that 200 levels are used to approximate profiles from each session's high to its low.
Show VPOC will show the volume point of control of each profile, which represents the price level where the largest amount of volume was traded for a given profile. This is shown with the red lines in the following chart.
Extend Last N VPOCs will look for the most recent, user-defined number of VPOCs (not including the current session's VPOC that's still developing) and extend them to the right of the chart as points of reference. The Show Labels Above option will annotate each VPOC with its respective date above a specified timeframe. This way, if one was using Volume Profiles on intraday timeframes, there wouldn't need to be several date strings all showing the same day.
Show Previous HVNs will show high volume nodes from the previous session. The HVN Strength setting is similar to a "pivot strength" that I use in a lot of my scripts - essentially, HVNs are validated by treating them as local highs. With a HVN Strength of 10 for example, if a given level contains more volume than the 10 levels above and below it, then it is validated as a HVN.
For a cleaner look and feel, HVNs can instead be shown as levels (lines) instead of areas (boxes). With levels enabled, solid lines denote the previous session's VPOC, and dotted lines represent all other HVNs. With areas enabled instead, the tops and bottoms will extend above/below the HVN level until a point with greater volume is discovered (marking the "end" of the node).
This indicator can be computationally intensive and may crash from taking too long to execute. In these cases, it's best to disable unused features, decrease the number of Rows, and/or simply reload the chart until it populates.
Donch +This is an indicator I made for trading Forex to help me see the bigger picture. It is meant for the 30min TF and it includes the following:
- 20 Day High | Low
- 5 Day High | Low
- 4 Hour High | L
- 4 Hour Bars
- Daily Simple Moving Averages
- Weekly Trend Line (connects last week's open to this week's open)
- Daily Trend Line (connects yesterday's open to today's open)
- Horizontal Lines at 0.25% increments (these can be useful for S/R... currency rarely moves more than 1% in a day).
- A table with information about what markets are open and technicals on the pair I am looking at.
- A slight white background fill to highlight the first hour of the US session. Knowing what session you are in is very important in day trading (in my opinion). This lets me go back and see how the US has been trading.
To keep the chart from being "too busy" (it's plenty busy lol), I use a step line and focus on 30min closes. I reference the white lines above and below closes for 4hr highs/lows and don't bother with looking at the high/low of every 30 min bar.
For the table, you will see bright green by the country for the first hour of trading in that session. It will turn to a regular green after the first hour. It will turn yellow the final hour of that session. It will turn red if that market is closed.
You can select from the settings 'inputs' tab to enable/disable any parts of this you don't find useful, for the table you'd go over to the 'style' tab and unselect it there. For example, I don't use the labels regularly. If I were to get confused about what a moving average was or something, I'd enable the labels and clarify.
Currency doesn't like to break out and likes to be stable. Keeping this in mind, you can see how the 20 day high / low and the 5 day high / low act as support and resistance (unless there is a news event to break out on.
I have alerts for the following:
- Price update every hour
- Crossing a trend line
- Crossing a moving average
- Crossing a 0.25% increment
- Making a new 4 hour, 5 day, or 20 day high/low
To enable the alerts, you would click add alert, select the indicator, and click save. To work properly, you'd want to be on the 30min TF before doing this. You will get a lot of alerts (personally I like this because I like to see how currency moves throughout the day). You will get one notification per 30 minutes but not more than that for the particular alert.
AMDX-XAMDGuided by ICT tutoring and also inspired by the teaching of
Daye', I create this versatile "AMDX" indicator.
A = Accumulation
M = Manipulation
D = Distribution
X = Continuation Or Reversal
This indicator shows a different way of viewing all the Timeframes by dividing them into Quarters, in this context the Trading sessions are divided into a 90m cycle, dividing each time range into Q1-Q2-Q3-Q4, in this way you have a clear vision of what the price is likely to do
True Open Times =
Opening Week - Monday at 6pm
Opening Day - 00:00
Asia -7.30pm
London -01.30
New York -07:30
PM -1.30pm
Session Times =
Q1 Asia 18:00-00:00
Q2 London 00:00-06:00
Q3 New York 06:00-12:00
Q4 PM 12:00-18:00
The user has the possibility to:
- Choose whether to display AMDX W
- Choose whether to display AMDX D
- Choose whether to display AMDX Session
- Choose to show the text in the Box
- Choose to show open levels
The indicator should be used as ICT and 'Daye' show in their concepts.
The indicator divides everything into Quarter ranges and classifies them into Q1-Q2-Q3-Q4 (as in the example above), and each Quarter has its own specific function, and can be used in this way:
If Q1 does an expansion it is likely that Q2 will do a consolidation, Q3 will do a Manipulation and Q4 will do a reversal returning to Q1
-If we are Bullish we buy under Open Session
-If we are Bearish we buy above open session
As in the example below:
If something is not clear, comment below and I will reply as soon as possible.
AfterHours Spike DetectorThe script pulls Lower Timeframe (30min) data to draw High/Low of Out-of-hours/AfterHours session (post-market session & next day pre-market session) on the Daily regular session chart. It then identifies significant AfterHours price changes and what happens to these price Spikes by the Open of the next day regular session.
You can change:
wether to show AfterHours High/Lows
wether to show AfterHours price Spikes
the AfterHours price Spike threshold (default = +/- 10%)
World Markets Open/Close BackgroundIndicator fills background color on the chart for different markets around the world.
This can be helpful in some markets to understand after hours and premarket price action. User can study if there is correlation between highs/low in whole session or open/close of different markets.
Tokyo, Hong Kong and Shanghai are Asian Markets in Red are combined
Bombay, London and NYSE are individually plotted.
Times can be changed for each session to include the entire session, or selected block of 15 minutes.
Less than 15 minutes will need to be changed in the default value of the code which is why I'm publishing it open source.
All coded default times for each market are in CST.
Background color can be turned off individually under the Style tab, and can also be unchecked under Inputs and can just be used for source for further coding.
My intentions for this script is to use it and its variable value to plot the highs and lows just in the specific times in a session and to more easily visualize those sessions with color coding.
I hope this is useful
Cheers!
Traders Reality Psy Levels/Daily Open GMT AwareTraders Reality Psy Levels/Daily Open GMT Aware
This indicator serves as the Tradingview equivalent of an MT4 indicator suite (Psy Levels and Daily Open)
Functionality:
In general we define Asia session to start with the Sydney exchange open.
For all intends and purposes for this indicator Asia session is defined as the open of the NZX market and close of the ASX market according to the 24 hour market clock.
The Daily Open is defined as the open of the Asia session.
The Psychological High and Low are defined as the first high and first low the Asian session starting at Saturday night and going into Sunday morning.
These are 2 key confluences that can be used in various strategies. These are in some sense similar to pivot points.
The script is GMT ( UTC ) offset aware meaning you can adjust the start of the day to any point within the allowed GMT offsets (-12 to 14)
For example if your exchange timezone is UTC+0 then the start of the Asia session starts at 2000 (UTC+0) and ends at 0400 (UTC+0) when Sydney if not in DST
You will set the offset to 4. When Sydney is in DST you will set the offset to 3
Naturally since the offset allows the entire range of GMT offsets to be used you do not need to choose the Asia market as the start of the day.
The default setting is set to 4 as of Nov 1st 2021
The GMT offset puts the calculation in the correct place regardless of exchange timezone so you do not need to adjust any settings
when working with exchanges not on UTC+0
Psy levels works only on exchanges that are open on the weekends that provide with 24x7 data.
The GMT offset puts the calculation in the correct place regardless of exchange timezone.
Features:
1) Plot the current Daily Open for timeframes between 4 hour and 1 min.
2) Plot the current weekly Psychological High and Low for timeframes between 4 hour and 1 min.
3) Configurable GMT offset, default set to Sydney open (as defined above)
4) Toggle to show historical Daily Open values (line)
5) Toggle to show historical Psychological High and Low values (line)
6) Turn labels on and off
7) Change line/label colors
Foot notes:
Use at your own risk and your own responsibility. No guarantees are provided and no responsibility is assumed by the developers of this script.
Original @plasmapug, additional edits (with permission) by @infernixx and @Peshocore
INSECURITY() from @JayRogers (enhanced for gmt offset)
Supply/Demand Zones + Engulfment-based ExecutionSupply/Demand Zones + Engulfment-Based Execution
Strategy Overview
This strategy combines institutional trading concepts—supply/demand zones and engulfing candle patterns—to generate high-probability long and short trade setups. The system uses aggregated price action to identify potential reversal zones and confirms entries with engulfing candle patterns, ensuring trades are only taken when market structure shows commitment in the direction of the trade.
Core Concepts
• Supply & Demand Zones: These are automatically detected by analyzing aggregated bullish and bearish candle structures over user-defined intervals. Supply zones are formed after bearish continuation patterns; demand zones appear after bullish continuation patterns.
• Engulfing Entries: Once price enters a zone, the strategy waits for a bullish engulfing pattern (in a demand zone) or a bearish engulfing pattern (in a supply zone) before executing a trade. This adds confirmation and reduces false signals.
• Risk Management: Stop-loss is placed at the low (for long trades) or high (for short trades) of the engulfed candle. Take-profit can be calculated using a fixed R-multiple (risk-to-reward ratio) or a user-defined target price.
Key Features
Fully customizable aggregation factor for zone detection
Visual zone boxes, entry/SL/TP boxes, and engulfing pattern labels
Optional removal of mitigated zones for cleaner charting
Configurable trade mode (Long only, Short only, or Both)
Support for trading sessions and date filtering
Alerts for price entering supply or demand zones
How to Use
Select Aggregation Factor: Choose how many candles to group together for identifying key zones (e.g., 4x timeframe).
Enable Zones: Turn on supply and/or demand zones as needed.
Set Execution Parameters:
– Choose R-multiple (e.g., 2:1 risk-reward)
– Or use a fixed take-profit price
Define Trade Time Window:
– Set the date and time ranges to restrict execution
– Use Start Hour and End Hour to limit trades to specific sessions (e.g., London/New York)
Run on Desired Timeframe: Typically used on 15m–4H charts, depending on your strategy and the asset’s volatility.
Ideal For
• Traders using Smart Money Concepts (SMC)
• Those who value high-confluence entries
• Intraday to swing traders looking for structure-based automation
⚠️ Important Notes
• The strategy requires engulfing confirmation within the zone to enter a position.
• This script does not repaint and executes trades on a bar close basis.
• Backtest results may vary based on session filters and aggregation factor.
© Attribution
This strategy was developed by The_Forex_Steward and is licensed under the Mozilla Public License 2.0.
You are free to use, modify, and distribute it under the terms of that license.
LANZ Strategy 3.0 [Backtest]🔷 LANZ Strategy 3.0 — Asian Range Fibonacci Scalping Strategy
LANZ Strategy 3.0 is a precision-engineered backtesting tool tailored for intraday traders who rely on the Asian session range to determine directional bias. This strategy implements dynamic Fibonacci projections and strict time-window validation to simulate a clean and disciplined trading environment.
🧠 Core Components:
Asian Range Bias Definition: Direction is established between 01:15–02:15 a.m. NY time based on the candle’s close in relation to the midpoint of the Asian session range (18:00–01:15 NY).
Limit Order Execution: Only one trade is placed daily, using a limit order at the Asian range high (for sells) or low (for buys), between 01:15–08:00 a.m. NY.
Fibonacci-Based TP/SL:
Original Mode: TP = 2.25x range, SL = 0.75x range.
Optimized Mode: TP = 1.95x range, SL = 0.65x range.
No Trade After 08:00 NY: If the limit order is not executed before 08:00 a.m. NY, it is canceled.
Fallback Logic at 02:15 NY: If the market direction misaligns with the setup at 02:15 a.m., the system re-evaluates and can re-issue the order.
End-of-Day Closure: All positions are closed at 15:45 NY if still open.
📊 Backtest-Ready Design:
Entries and exits are executed using strategy.entry() and strategy.exit() functions.
Position size is fixed via capital risk allocation ($100 per trade by default).
Only one position can be active at a time, ensuring controlled risk.
📝 Notes:
This strategy is ideal for assets sensitive to the Asian/London session overlap, such as Forex pairs and indices.
Easily switch between Fibonacci versions using a single dropdown input.
Fully deterministic: all entries are based on pre-defined conditions and time constraints.
👤 Credits:
Strategy developed by rau_u_lanz using Pine Script v6. Built for traders who favor clean sessions, directional clarity, and consistent execution using time-based logic and Fibonacci projections.
1M Scalp Setup – 2ndHi/2ndLo Breakout1M Scalp Setup – 2ndHi/2ndLo Breakout
This script is designed for 1-minute chart scalpers seeking high-probability intraday breakout setups based on early session price action. The strategy revolves around identifying the first high and low of the day, and then detecting the second breach (2nd high or 2nd low) to anticipate breakout entries.
🔍 Core Logic:
EMA Filter : A configurable EMA (default 8-period) is plotted for trend context.
1st High/Low Detection : Captures the very first high and low of each trading day.
2nd High/Low Markers : Identifies the second time price breaks the initial high or low, acting as a potential signal zone.
Breakout Signals :
A Buy Signal is triggered when price closes above the 2nd high.
A Sell Signal is triggered when price closes below the 2nd low.
Each signal is only triggered once per day to reduce noise and avoid overtrading.
🖌️ Visual Markers:
1stHi and 1stLo : Early session levels (red and green).
2ndHi and 2ndLo : Key breakout reference points (purple and blue).
B and S Labels : Buy and Sell triggers marked in real-time once breakouts occur.
⚙️ Inputs:
EMA Length (default: 8)
Customizable Colors for Buy/Sell signals and key markers
This tool is best used in fast-moving markets or during high-volume sessions. Combine with volume or higher-timeframe confirmation for improved accuracy.
Gold Breakout Strategy - RR 4Strategy Name: Gold Breakout Strategy - RR 4
🧠 Main Objective
This strategy aims to capitalize on breakouts from the Donchian Channel on Gold (XAU/USD) by filtering trades with:
Volume confirmation,
A custom momentum indicator (LWTI - Linear Weighted Trend Index),
And a specific trading session (8 PM to 8 AM Quebec time — GMT-5).
It takes only one trade per day, either a buy or a sell, using a fixed stop-loss at the wick of the breakout candle and a 4:1 reward-to-risk (RR) ratio.
📊 Indicators Used
Donchian Channel
Length: 96
Detects breakouts of recent highs or lows.
Volume
Simple Moving Average (SMA) over 30 bars.
A breakout is only valid if the current volume is above the SMA.
LWTI (Linear Weighted Trend Index)
Measures momentum using price differences over 25 bars, smoothed over 5.
Used to confirm trend direction:
Buy when LWTI > its smoothed version (uptrend).
Sell when LWTI < its smoothed version (downtrend).
⏰ Time Filter
The strategy only allows entries between 8 PM and 8 AM (GMT-5 / Quebec time).
A timestamp-based filter ensures the system recognizes the correct trading session even across midnight.
📌 Entry Conditions
🟢 Buy (Long)
Price breaks above the previous Donchian Channel high.
The current channel high is higher than the previous one.
Volume is above its moving average.
LWTI confirms an uptrend.
The time is within the trading session (20:00 to 08:00).
No trade has been taken yet today.
🔴 Sell (Short)
Price breaks below the previous Donchian Channel low.
The current channel low is lower than the previous one.
Volume is above its moving average.
LWTI confirms a downtrend.
The time is within the trading session.
No trade has been taken yet today.
💸 Trade Management
Stop-Loss (SL):
For long entries: placed below the wick low of the breakout candle.
For short entries: placed above the wick high of the breakout candle.
Take-Profit (TP):
Set at a fixed 4:1 reward-to-risk ratio.
Calculated as 4x the distance between the entry price and stop-loss.
No trailing stop, no break-even, no scaling in/out.
🎨 Visuals
Green triangle appears below the candle on a buy signal.
Red triangle appears above the candle on a sell signal.
Donchian Channel lines are plotted on the chart.
The strategy is designed for the 5-minute timeframe.
🔄 One Trade Per Day Rule
Once a trade is taken (buy or sell), no more trades will be executed for the rest of the day. This prevents overtrading and limits exposure.
Prev-Day High-Low Box 09:30-15:30This indicator plots a visual range box for the previous day's regular trading session, based specifically on 09:30 AM to 3:30 PM market hours (Eastern Time by default).
Features:
Automatically detects each new trading day
Draws a box from the previous day’s high to low
Box extends into the current session for a set number of bars (default: 160)
Labels mark the previous high and previous low individually
Clean and minimal — only one box and label set is drawn at a time
Works on intraday timeframes (1min, 5min, 15min, etc.)
Use it to:
Identify zones of interest from the last session
Watch for breakouts, reversals, or mean reversion setups
Combine with VWAP, moving averages, or price action for added context
This tool is handy for day traders and scalpers who want to map out the structure of prior sessions during live trading hours.
Apex Edge - MTF Confluence PanelApex Edge – MTF Confluence Panel
Description:
The Apex Edge – MTF Confluence Panel is a powerful multi-timeframe analysis tool built to streamline trade decision-making by aggregating key confluences across three user-defined timeframes. The panel visually presents the state of five core market signals—Trend, Momentum, Sweep, Structure, and Trap—alongside a unified Score column that summarizes directional bias with clarity.
Traders can customize the number of bullish/bearish conditions required to trigger a score signal, allowing the tool to be tailored for both conservative and aggressive trading styles. This script is designed for those who value a clean, structured, and objective approach to identifying market alignment—whether scalping or swing trading.
How it Works:
Across each of the three selected timeframes, the panel evaluates:
Trend: Based on a user-configurable Hull Moving Average (HMA), the script compares price relative to trend to determine bullish, bearish, or neutral bias.
Momentum: Uses OBV (On-Balance Volume) with volume spike detection to identify bursts of strong buying or selling pressure.
Sweep: Detects potential liquidity grabs by identifying price rejections beyond prior swing highs/lows. A break below a previous low with reversal signals bullish intent (and vice versa for bearish).
Structure: Uses dynamic pivot-based logic to identify market structure breaks (BOS) beyond recent confirmed swing levels.
Trap: Flags potential false moves by measuring RSI overbought/oversold signal clusters combined with minimal price movement—highlighting exhaustion or deceptive breaks.
Score: A weighted consensus of the above components. The number of required confluences to trigger a score (default: 3) can be set by the user via input, offering flexibility in signal sensitivity.
Why It’s Useful for Traders:
Quick Decision-Making: The color-coded panel provides instant visual feedback on whether confluences align across timeframes—ideal for fast-paced environments like scalping or high-volatility news sessions.
Multi-Timeframe Confidence: Helps eliminate guesswork by confirming whether higher and lower timeframe conditions support your trade idea.
Customizability: Adjustable confluence threshold means traders can fine-tune how sensitive the system is—more signals for faster entries, stricter confluence for higher conviction trades.
Built-In Alerts: Automated alerts for score alignment, trap detection, and liquidity sweeps allow traders to stay informed even when away from the screen.
Strategic Edge: Supports directional bias confirmation and trade filtering with logic designed to mimic professional decision-making workflows.
Features:
Clean, real-time confluence table across three user-selected timeframes
Configurable score sensitivity via “Minimum Confluences for Score” input
Cell-based colour coding for at-a-glance trade direction
Built-in alerts for score alignment, traps, and sweep triggers
Note - This Indicator works great in sync with Apex Edge - Session Sweep Pro
Useful levels for TP = previous session high/low boxes or fib levels.
⚠️ Disclaimer:
This script is for informational and educational purposes only and should not be considered financial advice. Always perform your own due diligence and practice proper risk management when trading.
LUX CLARA - EMA + VWAP (No ATR Filter) - v6EMA STRAT SHOUT OUTOUTLIERSSSSS
Overview:
an intraday strategy built around two core principles:
Trend Confirmation using the 50 EMA (Exponential Moving Average) in relation to the VWAP (Volume-Weighted Average Price).
Entry Signals triggered by the 8 EMA crossing the 50 EMA in the direction of that confirmed trend.
Key Logic:
Bullish Trend if the 50 EMA is above VWAP. Only long entries are allowed when the 8 EMA crosses above the 50 EMA during that bullish phase.
Bearish Trend if the 50 EMA is below VWAP. Only short entries are allowed when the 8 EMA crosses below the 50 EMA during that bearish phase.
Intraday Focus: Trades are restricted to a user-defined session window (default 7:30 AM–11:30 AM), aligning entries/exits with peak intraday liquidity.
Exit Rule: Positions close automatically when the 8 EMA crosses back in the opposite direction of the entry.
Why It Works:
EMA + VWAP helps detect both immediate momentum (EMAs) and overall institutional bias (VWAP).
By confining trades to a set intraday window, the strategy aims to capture morning volatility while avoiding choppy afternoon or overnight sessions.
Customization:
Users can adjust EMA lengths, session times, or incorporate stops/targets for additional risk management.
It can be tested on various symbols and intraday timeframes to gauge performance and robustness.
ICT Bread and Butter Sell-SetupICT Bread and Butter Sell-Setup – TradingView Strategy
Overview:
The ICT Bread and Butter Sell-Setup is an intraday trading strategy designed to capitalize on bearish market conditions. It follows institutional order flow and exploits liquidity patterns within key trading sessions—London, New York, and Asia—to identify high-probability short entries.
Key Components of the Strategy:
🔹 London Open Setup (2:00 AM – 8:20 AM NY Time)
The London session typically sets the initial directional move of the day.
A short-term high often forms before a downward push, establishing the daily high.
🔹 New York Open Kill Zone (8:20 AM – 10:00 AM NY Time)
The New York Judas Swing (a temporary rally above London’s high) creates an opportunity for short entries.
Traders fade this move, anticipating a sell-off targeting liquidity below previous lows.
🔹 London Close Buy Setup (10:30 AM – 1:00 PM NY Time)
If price reaches a higher timeframe discount array, a retracement higher is expected.
A bullish order block or failure swing signals a possible reversal.
The risk is set just below the day’s low, targeting a 20-30% retracement of the daily range.
🔹 Asia Open Sell Setup (7:00 PM – 2:00 AM NY Time)
If institutional order flow remains bearish, a short entry is taken around the 0-GMT Open.
Expect a 15-20 pip decline as the Asian range forms.
Strategy Rules:
📉 Short Entry Conditions:
✅ New York Judas Swing occurs (price moves above London’s high before reversing).
✅ Short entry is triggered when price closes below the open.
✅ Stop-loss is set 10 pips above the session high.
✅ Take-profit targets liquidity zones on higher timeframes.
📈 Long Entry (London Close Reversal):
✅ Price reaches a higher timeframe discount array between 10:30 AM – 1:00 PM NY Time.
✅ A bullish order block confirms the reversal.
✅ Stop-loss is set 10 pips below the day’s low.
✅ Take-profit targets 20-30% of the daily range retracement.
📉 Asia Open Sell Entry:
✅ Price trades slightly above the 0-GMT Open.
✅ Short entry is taken at resistance, targeting a quick 15-20 pip move.
Why Use This Strategy?
🚀 Institutional Order Flow Tracking – Aligns with smart money concepts.
📊 Precise Session Timing – Uses market structure across London, New York, and Asia.
🎯 High-Probability Entries – Focuses on liquidity grabs and engineered stop hunts.
📉 Optimized Risk Management – Defined stop-loss and take-profit levels.
This strategy is ideal for traders looking to trade with institutions, fade liquidity grabs, and capture high-probability short setups during the trading day. 📉🔥
New York Open LinesThis indicator marks key New York trading session opens on the chart. It draws horizontal lines at the New York Midnight Open (00:00 NY time) and the New York Economic Open (08:30 NY time) prices.
Key Features:
1) Customizable Line Styles & Colors:
* Users can choose between solid, dotted, or dashed lines.
* Colors are customizable for each open level.
2) Timeframe-Based Logic:
* For timeframes above 30 minutes:
- It retrieves the midnight (NYMO) and 8:30 AM (ETO) open prices using request.security_lower_tf().
- The script ensures the price is stored only once per day.
* For 30-minute timeframes and below:
- The script draws lines at the exact open prices as bars appear.
3) Line Management:
* The lines extend for 24 hours from the open.
* The previous day's lines are removed to keep the chart clean.
4) Session Reset:
* At the start of a new trading day, the stored NYMO and ETO prices reset to na to prepare for the next session.
This helps traders quickly identify key New York session levels, often used for support, resistance, and breakout trading strategies.
ORB MOTORB MOT - Opening Range Breakout Indicator (Educational purpos only)
The ORB MOT (Opening Range Breakout Multi-Option Tool) is a powerful TradingView indicator designed to help traders identify and capitalize on market breakouts based on the opening range. This tool provides extensive customization options, allowing traders to fine-tune their breakout strategies according to different timeframes and trading sessions.
Key Features:
Configurable Opening Range: Traders can define the opening range period (1, 2, 3, 5, 15, or 30 minutes) to suit their trading strategy.
Session-Based Analysis: The indicator automatically adjusts for market session times and provides an optional international override for different time zones.
Visual Representation: ORB levels are displayed with clear labels, shaded regions, and customizable colors for easy identification.
Breakout and Retest Detection: Identifies breakout points and potential retests, helping traders make informed decisions.
Multiple Price Targets: Calculates and plots key levels such as 50%, 100%, 150%, and 200% price targets for potential trade exits.
Fibonacci Extensions: Optional Fibonacci targets (21.2%, 61.8%) can be displayed for additional market confluence.
Alerts and Notifications: Provides alerts for breakout conditions, ensuring traders don’t miss critical movements.
How It Works:
The indicator calculates the high and low of the selected opening range.
Breakout points are identified when price crosses above or below the range.
The indicator plots multiple price targets based on the range's size.
Traders can visualize past ORB levels and retests for better trend analysis.
Alerts notify users of significant breakout events.
Who Can Use This Indicator?
Scalpers & Day Traders: Perfect for identifying quick breakout opportunities.
Swing Traders: Helps determine key levels for potential reversals or trend continuations.
Institutional & Retail Traders: Useful for analyzing market structure and setting price targets.
The ORB MOT indicator is a must-have tool for traders looking to refine their breakout strategy with precision and ease. Whether you're a beginner or an experienced trader, this indicator provides valuable insights into market movements and trading opportunities.
TMA StrategyThe **TMA Strategy** is a trend-following strategy that leverages **Smoothed Moving Averages (SMMA)** and **candlestick patterns** to identify high-probability trading opportunities. It is designed for traders who want to capture strong trends while minimizing noise from short-term fluctuations.
**Key Features:**
✔ **Multiple Smoothed Moving Averages (SMMA):** Uses 21, 50, 100, and 200-period SMMAs to identify market trends and key support/resistance zones.
✔ **Candlestick Pattern Confirmation:** Incorporates **3-line strike** and **engulfing candle** patterns to confirm trade entries.
✔ **Dynamic Trend Filter:** A **2-period EMA** ensures that trades align with the dominant trend, reducing false signals.
✔ **Customizable Session Filter:** Allows users to enable/disable trading within specific market sessions (New York, London, Tokyo, etc.), ensuring trades are executed only during high-liquidity hours.
✔ **Risk Management:** Uses predefined exit conditions based on EMA/SMMA crossovers to lock in profits and minimize losses.
**Trading Logic:**
📌 **Long Entry:**
- Bullish Engulfing or 3-Line Strike pattern appears.
- Price is above the 200 SMMA.
- 2 EMA confirms an uptrend.
- Trade executes if session filter allows.
📌 **Short Entry:**
- Bearish Engulfing or 3-Line Strike pattern appears.
- Price is below the 200 SMMA.
- 2 EMA confirms a downtrend.
- Trade executes if session filter allows.
📌 **Exit Conditions:**
- Long trades exit when EMA(2) crosses **below** SMMA(200).
- Short trades exit when EMA(2) crosses **above** SMMA(200).
**Ideal Markets & Timeframes:**
✅ Best suited for **Forex, Stocks, and Crypto** markets.
✅ Works well on **higher timeframes (15m, 1H, 4H, Daily)** for stronger trend confirmation.
📢 **Disclaimer:**
This strategy is for educational purposes only. Backtest results do not guarantee future performance. Always use proper risk management and test in a demo account before live trading.
🚀 **Try the TMA Strategy now and enhance your trend-following approach!**
2:30 [LuciTech]this is a technical analysis tool designed to highlight key price levels and patterns during a specific trading window, based on UK time (Europe/London). It overlays visual elements on the chart, including a 12 PM reference line, Buy Side Liquidity (BSL) and Sell Side Liquidity (SSL) levels, a highlighted 2:30 PM candle, and Engulfing Fair Value Gaps (FVGs). This indicator is intended for traders who focus on intraday price action and liquidity zones.
Features
The 12 PM Line displays a vertical line at 12:00 PM (UK time) to mark the start of the session. It’s customizable, allowing you to enable or disable it and adjust its color.
BSL/SSL Lines track the highest high (BSL) and lowest low (SSL) from 12:00 PM to 2:00 PM (UK time). These lines extend horizontally until 3:30 PM, after which they remain static at their last recorded levels. You can customize them by enabling or disabling visibility, adjusting colors, choosing a line style (solid, dashed, or dotted), and setting the width.
The 2:30 PM Candle highlights the candle at 2:30 PM (UK time) with a distinct color. It’s customizable, with options to enable or disable it and change its color.
Engulfing FVG (Fair Value Gap) identifies bullish and bearish engulfing patterns with a gap from the prior candle’s range. It draws a shaded box over the FVG area, and you can customize it by enabling or disabling it and adjusting the box color.
How It Works
The indicator operates within a session starting at 12:00 PM (UK time). BSL/SSL levels update between 12:00 PM and 2:00 PM, with lines extending until 3:30 PM. After 3:30 PM, these lines freeze.
BSL/SSL lines show the highest price (BSL) and lowest price (SSL) reached during the 12:00 PM to 2:00 PM window. After 3:30 PM, they remain static, marking the final range boundaries.
The 2:30 PM candle emphasizes a key timestamp, often of interest to intraday traders.
Engulfing FVGs detect significant price gaps created by engulfing candles, which may indicate potential reversal or continuation zones.
Settings
12 PM Line Settings let you toggle visibility and set the line color.
BSL/SSL Line Settings allow you to toggle visibility, set BSL and SSL colors, choose a line style (Solid, Dashed, Dotted), and adjust width (1-4).
2:30 Candle Settings let you toggle visibility and set the candle color.
Engulfing FVG Settings allow you to toggle visibility and set the box color.
Interpretation
The 12 PM Line serves as a reference for the session start.
BSL/SSL Lines may act as potential support or resistance zones or highlight liquidity areas. After 3:30 PM, they remain static, showing the session’s final range.
The 2:30 PM Candle can be monitored for price action signals, such as reversals or breakouts.
Engulfing FVGs shaded areas may indicate imbalances in supply and demand, useful for identifying trade opportunities or stop-loss placement.
Notes
The timezone is set to Europe/London (UK time). Ensure your chart’s timezone aligns for accurate results.
This indicator is best used on intraday timeframes, such as 1-minute or 5-minute charts.
It provides visual aids for analysis and does not generate buy or sell signals on its own.