Multi-Session MarkerMulti-Session Marker is a flexible visual tool for traders who want to highlight up to 10 custom trading sessions directly on their chart’s background.
Custom Sessions: Enter up to 10 time ranges (in HHMM-HHMM format) to mark any market session, news window, or personal focus period.
Visual Clarity: For each session, toggle the highlight on or off and select a unique background color and opacity, making it easy to distinguish active trading windows at a glance.
Universal Time Handling: Session times automatically follow your chart’s time zone—no manual adjustment required.
Efficient and Fast: Utilizes TradingView’s bgcolor() for smooth performance, even on fast timeframes like 1-second charts.
Clean Interface: All session controls are grouped for easy editing in the indicator’s settings panel.
How to use:
In the indicator settings, enter your desired session times (e.g., 0930-1130) for each session you want to highlight.
Toggle “Show Session” and pick a color for each session.
The background will automatically highlight those periods on your chart.
This indicator is ideal for day traders, futures traders, or anyone who wants to visually segment their trading day for better focus and analysis.
在腳本中搜尋"session"

Apex Wallet - Opening Range Breakout (ORB) & Session LevelsOverview The Apex Wallet Opening Range Breakout (ORB) is a professional intraday tool designed to capture the volatility of the first minutes of the trading session. By defining a clear range at the market open, this indicator provides traders with high-probability breakout levels and psychological targets based on mathematical extensions of the initial move.
Core Mechanics
Customizable Session: Easily define your preferred opening range duration (e.g., first 5, 15, or 30 minutes) and session start time.
Dynamic Timezone Adjustment: Includes a built-in UTC offset feature to ensure session times align perfectly with your local market, regardless of where you are trading from.
Automated Level Tracking: The script automatically identifies and locks the high and low of the specified opening period.
Key Features:
Psychological Mid-Lines: Calculates the 50% median of the range (ORB Mid) as a pivot point for trend strength.
Advanced Volatility Extensions: Plots internal and external targets (High+Mid, Low+Mid) to identify potential exhaustion zones or secondary breakout levels.
Intraday Optimization: Designed specifically for low-timeframe traders (1m to 15m) looking for clear execution zones at the bell.
How to use: Wait for the opening range to be established. A breakout above the ORB High often indicates bullish dominance, while a break below the ORB Low suggests bearish momentum. Use the internal extension lines as take-profit targets or areas to move your stop-loss to breakeven.

MRG Session High/LowMRG Session High/Low - Indicator Description
📊 Overview
This Pine Script indicator automatically displays key levels from Asian and London trading sessions on your TradingView chart. It plots the high and low points of each completed session, allowing you to quickly identify important support and resistance zones for your trades.
🎯 Key Features
Detected Sessions (New York Timezone)
Asian Session: 18:00 - 03:00 (6pm - 3am)
London Session: 03:00 - 09:00 (3am - 9.30am)
Plotted Levels
Session High: The highest point reached during the session
Session Low: The lowest point reached during the session
Start Lines: Vertical dashed lines marking the beginning of each session (optional)
⚙️ Customizable Settings
Display Options
✅ Show/hide Asian Session
✅ Show/hide London Session
✅ Show/hide session start lines
Style Options
🎨 Asian Color: Orange by default
🎨 London Color: Blue by default
🎨 Start lines color: Red by default
📏 Line thickness: Adjustable from 1 to 5
🔍 How It Works
Automatic Detection: The indicator automatically detects when a new session begins
Level Calculation: During each session, it continuously records highs and lows
Line Plotting: At the end of each session, it draws two horizontal lines:
One line at the session high level
One line at the session low level
Extension: Lines extend to the right for easy future identification
📈 Strategic Usage
For Breakout Trading
Trade breakouts of Asian and London session highs/lows
Breakouts from these levels often signal the beginning of significant moves
For Support and Resistance
Use these levels as key support and resistance zones
Prices often come back to test these levels during the New York session
For Multi-Timeframe Analysis
Identify consolidation during Asian/London sessions
Anticipate volatility at New York open
💡 Advantages
✨ Clear and automatic visualization of session levels
⏱️ Time-saving: no need to manually draw levels
🎯 Precise levels based on actual highs/lows of each session
🔄 Automatically updates daily
📱 Compatible with all timeframes (recommended: M5, M15, H1)
🎓 Ideal For
Forex traders (especially XAUUSD, EUR/USD, GBP/USD)
Scalpers and day traders
Session breakout strategies
Trading around New York open
Liquidity zone analysis
📌 Important Note
The indicator uses New York timezone (America/New_York) to ensure session time accuracy, regardless of your local timezone.

Mark SessionsDisplays trading sessions in a very flexible way.
The main intention of this indicator is to give a way to display market sessions with your own style preferences and expectations and achieve cleanness of your chart.
This indicator allows to show up to 6 sessions plus day session. Time range of the sessions are set in timezone you choose. Mostly all settings can be set in one place and be inherited by all sessions. And of course after settings inheritage you still have a way to make session setting exceptions without changing others.
You can adjust any borders of the session to show, background to show, adjust labels attachment target and their alignments, change the color of sessions, and line styles. All of those settings can turn session picture in any presentation you like.
Enjoy and I'm open to hear your advices

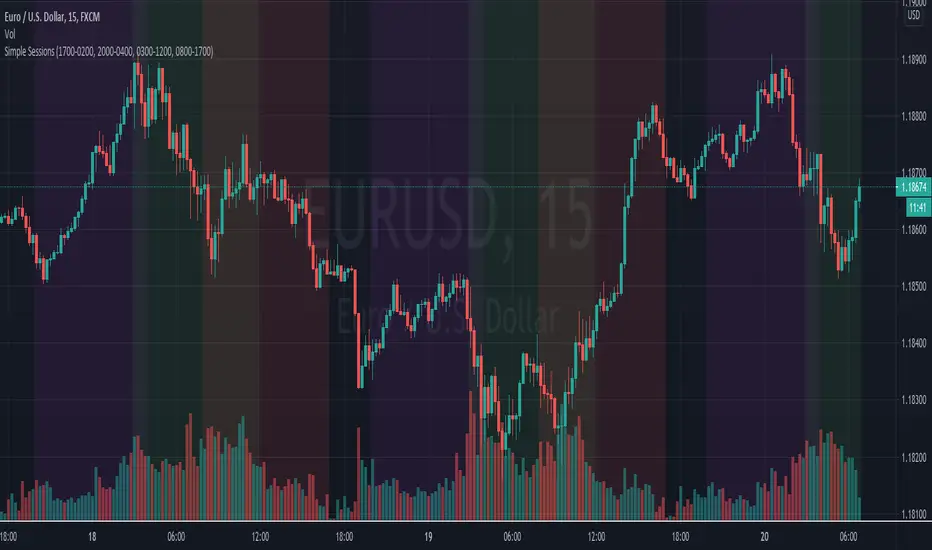
Simple Sessions## Background ##
Simple Sessions is based on the very awesome "Sessions on Chart" by Aurocks_AIF.
I really liked how the background colours worked but wanted to simplify it by removing some parts that I didn't use. I then simplified much of the code, put it into my standard template format and re-published. Hopefully the code is a bit cleaner and easier to read now.
## Usage ##
The default indicator shows the following sessions:
* Sydney in Navy
* Tokyo in Purple
* London in Green
* New York in Red
The good news is that using Green and Red for London and New York, gives a nice distinct yellow for the overlapping sessions. Sydney and Tokyo are by in similar colors by design.
By default, only London and New York show, but you may turn on Sydney and Tokyo in the settings.
## Use, Share, Like, etc #
Have fun!
-- chilts
Forex/Crypto/Custom Market SessionsCredit goes to TradeMasterSavis for providing the original code
I merge the 2 sessions together allowing you to toggle between the two. I also add a 3rd custom session type and the ability to change the duration of each trading session. This would solve any problems ran into the case of Daylight savings time switch or if you just want different session duration.

Weekly Session BreakThis indicator plots a vertical line at the end of the trading week (Friday) to mark the weekly session break. It is designed to be used on intraday charts (sub-1 hour timeframes).
The line's appearance is fully customizable via the Inputs tab, allowing you to change its color, style (solid, dotted, or dashed), and thickness.
Key Features:
End-of-Week Marker: Accurately draws a vertical line on the last bar of the trading week.
Timeframe Specific: Lines are only visible on intraday charts (1-minute to 59-minute timeframes) to prevent clutter on higher timeframes.
Customizable: Adjust the line's color, style, and thickness from the Inputs menu.

Session Highs and Lows IndicatorSession Highs and Lows Indicator
This indicator automatically tracks and displays the High and Low prices for major trading sessions:
London
New York
Asia
New York Close
For each session, it plots:
A label at the highest and lowest price point reached during the session.
A dashed line showing the high and low levels extended to the right (until the current bar), helping traders visualize key support/resistance zones.
You can toggle visibility for each session individually through the settings panel.
Session times are set in GMT+8, but you can adjust them in the code if needed.
Color code:
London: Blue
New York: Red
Asia: Green
New York Close: Orange
All lines and labels are semi-transparent to avoid chart clutter.
Ideal for intraday and session-based trading strategies.

Simple Sessions - [TTF]In working with a lot of new traders, one of the most common hurdles that they tend to encounter is properly identifying the various major trading sessions around the world. While it's pretty intuitive to grasp the basic concept, the biggest struggle is around the time conversion. Most people are pretty familiar with the trading session most local to them (e.g. US residents are generally pretty familiar with when the US session is relative to their local timezone), but tend to have much more difficulty in determining when exactly the start and end times are of "foreign" sessions (e.g. Europe or Tokyo). This can be even more challenging when trying to account for regional time differences (like Daylight Savings Time), and larger global time differences (e.g. seasons in opposite hemispheres are reversed). It was with these things in mind that we took to making this version of a sessions indicator to help people better visualize and interact with the various sessions in a more intuitive manner.
Key features include:
Individual settings and configuration for each major session (America/New York, Europe/London, and Asia/Tokyo), along with customizable highlighting color for the Europe/US Mixed session
Session start and end times are configured as the local time for those session (e.g. America/New York session time is configured relative to the US Eastern timezone)
The indicator will automatically handle the timezone conversion and correctly display the sessions on chart regardless of the user's on-chart configured timezone
Users can customize which days of the week that they want the sessions to include or exclude based on their personal preferences and trading schedule (e.g. exclude Fridays since that is when most news events occur)
There is an additional fully-customizable session that can be configured (including reference timezone) for a fully-custom trading window visualization (helpful for people with constraints in their trading availability and can't align with one of the "major" sessions)
We hope that the community finds this as helpful as we hope, and feedback is always welcome!

Forex Session TrackerForex Session Tracker - Professional Trading Session Indicator
The Forex Session Tracker is a comprehensive and visually intuitive indicator designed specifically for forex traders who need precise tracking of major global trading sessions. This powerful tool helps traders identify active market sessions, monitor session-specific price ranges, and capitalize on volatility patterns unique to each trading period.
Understanding when major financial centers are active is crucial for forex trading success. This indicator provides real-time visualization of the Tokyo, London, New York, and Sydney trading sessions, allowing traders to align their strategies with peak liquidity periods and avoid low-volatility trading windows.
---
Key Features
📊 Four Major Global Trading Sessions
The indicator tracks all four primary forex trading sessions with precision:
- Tokyo Session (Asian Market) - Captures the Asian trading hours, ideal for JPY, AUD, and NZD pairs
- London Session (European Market) - Monitors the most liquid trading period, perfect for EUR, GBP pairs
- New York Session (American Market) - Tracks US market hours, essential for USD-based currency pairs
- Sydney Session (Pacific Market) - Identifies the opening of the trading week and AUD/NZD activity
Each session is fully customizable with individual color schemes, making it easy to distinguish between different market periods at a glance.
🎯 Session Range Visualization
For each active trading session, the indicator automatically:
- Draws rectangular boxes that highlight the session's time period
- Tracks and displays session HIGH and LOW price levels in real-time
- Creates horizontal lines at session extremes for easy reference
- Positions session labels at the center of each trading period
- Updates dynamically as new highs or lows are formed within the session
This visual approach helps traders quickly identify:
- Session breakout opportunities
- Support and resistance zones formed during specific sessions
- Range-bound vs. trending session behavior
- Key price levels that institutional traders are watching
📱 Live Information Dashboard
A sleek, professional information panel displays:
- Real-time session status - Instantly see which sessions are currently active
- Color-coded indicators - Green dots for active sessions, gray for closed sessions
- Timezone information - Confirms your current timezone settings
- Customizable positioning - Place the dashboard anywhere on your chart (Top Left, Top Right, Bottom Left, Bottom Right)
- Adjustable size - Choose from Tiny, Small, Normal, or Large text sizes for optimal visibility
The dashboard provides at-a-glance awareness of market conditions without cluttering your chart analysis.
⚙️ Extensive Customization Options
Every aspect of the indicator can be tailored to your trading preferences:
Session-Specific Controls:
- Enable/disable individual sessions
- Customize colors for each trading period
- Adjust session times to match your broker's server time
- Toggle background highlighting on/off
- Show/hide session high/low lines independently
General Settings:
- UTC Offset Control - Adjust timezone from UTC-12 to UTC+14
- Exchange Timezone Option - Automatically use your chart's exchange timezone
- Background Transparency - Fine-tune the opacity of session highlighting (0-100%)
- Session Labels - Show or hide session name labels
- Information Panel - Toggle the live status dashboard on/off
Style Settings:
- Turn session backgrounds ON/OFF directly from the Style tab
- Maintain clean charts while keeping all analytical features active
🔔 Built-in Alert System
Stay informed about session openings with customizable alerts:
- Tokyo Session Started
- London Session Started
- New York Session Started
- Sydney Session Started
Set up notifications to never miss important market opening periods, even when you're away from your charts.
---
How to Use This Indicator
For Day Traders:
1. Identify High-Volatility Periods - Focus your trading during London and New York session overlaps for maximum liquidity
2. Monitor Session Breakouts - Watch for price breaks above/below session highs and lows
3. Avoid Low-Volume Periods - Recognize when major sessions are closed to avoid false signals
For Swing Traders:
1. Mark Key Levels - Use session highs and lows as support/resistance zones
2. Track Multi-Session Patterns - Observe how price behaves across different trading sessions
3. Plan Entry/Exit Points - Time your trades around session openings for better execution
For Currency-Specific Traders:
1. JPY Pairs - Focus on Tokyo session movements
2. EUR/GBP Pairs - Monitor London session activity
3. USD Pairs - Track New York session volatility
4. AUD/NZD Pairs - Watch Sydney and Tokyo sessions
---
Technical Specifications
- Pine Script Version: 5
- Overlay Indicator: Yes (displays directly on price chart)
- Maximum Bars Back: 500
- Drawing Objects: Up to 500 lines, boxes, and labels
- Performance: Optimized for real-time data processing
- Compatibility: Works on all timeframes (recommended: 5m to 1H for session tracking)
---
Installation & Setup
1. Add to Chart - Click "Add to Chart" after copying the script to Pine Editor
2. Configure Timezone - Set your UTC offset or enable "Use Exchange Timezone"
3. Customize Colors - Choose your preferred color scheme for each session
4. Adjust Display - Enable/disable features based on your trading style
5. Set Alerts - Create alert notifications for session starts
---
Best Practices
✅ Combine with Price Action - Use session ranges alongside candlestick patterns for confirmation
✅ Watch Session Overlaps - The London-New York overlap (1300-1600 UTC) typically shows highest volatility
✅ Respect Session Highs/Lows - These levels often act as intraday support and resistance
✅ Adjust for Your Broker - Verify session times match your broker's server clock
✅ Use Multiple Timeframes - View sessions on both lower (15m) and higher (1H) timeframes for context
---
Why Choose Forex Session Tracker Pro?
✨ Professional Grade Tool - Built with clean, efficient code following TradingView best practices
✨ Beginner Friendly - Intuitive design with clear visual cues
✨ Highly Customizable - Adapt every feature to match your trading style
✨ Performance Optimized - Lightweight code that won't slow down your charts
✨ Actively Maintained - Regular updates and improvements
✨ No Repainting - All visual elements are fixed once the session completes
---
Support & Updates
This indicator is designed to provide reliable, accurate session tracking for forex traders of all experience levels. Whether you're a scalper looking for high-volatility windows or a position trader marking key institutional levels, the Forex Session Tracker Pro delivers the insights you need to make informed trading decisions.
Happy Trading! 📈
---
Disclaimer
This indicator is a tool for technical analysis and should be used as part of a comprehensive trading strategy. Past performance does not guarantee future results. Always practice proper risk management and never risk more than you can afford to lose. Trading forex carries a high level of risk and may not be suitable for all investors.

Forex Session + Volume Profile [RunRox]📊 Forex Session + Volume Profile is built especially for traders who work with intra-session liquidity concepts or any strategy that needs a clear visual of trading sessions and the liquidity inside them.
Our team created this indicator to give you better session visibility, flexible session styling, and extra tools that help you navigate the market more easily.
📌 Features:
6 fully customizable sessions
Kill Zone (the high-impact trading window)
Volume Profile for each session
POC / VAL / VAH / LVN levels (Point of Control, Value Area Low, Value Area High, Low Volume Node)
PDH / PDL levels (Previous Day High / Low)
PWH / PWL levels (Previous Week High / Low)
NYM level (New York Market level)
Active sessions table
5 style options for each session
All of this gives you the flexibility to set up exactly the layout you need for your trading. Below, you’ll find a more detailed look at each feature.
🗓️ 6 CUSTOMIZABLE SESSION
The indicator includes six sessions that you can fully customize to fit your needs—everything from naming each session and choosing line colors to adjusting opacity, showing the volume profile, or even turning off a session entirely if you don’t need it.
Plus, you can pick different display styles for each session. As shown in the screenshot below, there are five style options you can apply individually to every session.
5 Style Options for Sessions
BOX
AREA
ZONES
LINES
CURVED
These styles can be customized for each session individually to help you highlight the sessions you care about on your chart. Example below
📢 VOLUME PROFILE
We’ve also integrated a Volume Profile into the indicator to pinpoint important levels on the chart. On top of that, we’ve added extra volume-based levels. Below, you’ll find the settings and a visual demo of how it appears on your chart.
To identify optimal entry points, you can use the following key reference levels:
POC (Point of Control)
VAL (Value Area Low)
VAH (Value Area High)
LVN (Low Volume Node)
You can also customize colors and line styles, or hide any levels you don’t need on your chart.
📐 ADDITIONAL LEVELS
You can display the following levels on your chart:
NYM (New York Market)
PDH (Previous Day High)
PDL (Previous Day Low)
PWH (Previous Week High)
PWL (Previous Week Low)
All of these are fully customizable with color selection and the option to extend lines into the next period.
💹 ACTIVE SESSION TABLE
The active sessions table helps you quickly identify the trading times for the sessions you care about. It’s fully customizable, with options to choose border and background colors for the table itself.
🟠 USAGE
This indicator is highly versatile: use it to simply mark trading sessions on your chart, set up the Kill Zone at your chosen time, or identify the context of the previous session by its most traded range levels. All of this makes the indicator an invaluable tool for any trader!

Session Breakouts & Trend Indicator# Session Breakouts & Trend Indicator
This indicator identifies high-probability trading opportunities by tracking key intraday sessions and their breakouts while aligning them with the overall market trend direction.
## What Makes This Indicator Unique
Unlike standard breakout indicators that only identify when price crosses a threshold, this indicator:
- Dynamically identifies and tracks important daily sessions (default: AM 09:00-10:00 and PM 15:00-16:00)
- Determines trend direction using a triple EMA system (20/50/200)
- Shows when breakouts align with the overall trend (higher probability setups)
- Provides visual confirmation with session ranges, breakout levels, and background highlighting
- Includes a comprehensive information panel showing trend/session alignment
## How It Works
The indicator tracks two important daily sessions:
1. **AM Session**: Typically the first hour of trading (default: 09:00-10:00)
2. **PM Session**: Typically the last hour of trading (default: 15:00-16:00)
For each session, it:
- Marks the high and low range
- Establishes breakout levels above/below these ranges
- Detects when price breaks beyond these levels
- Determines if the breakout aligns with the prevailing trend
The trend is calculated using three EMAs (20, 50, 200) for reliable trend identification.
## How To Use
1. Apply the indicator to your chart (works best on 5-minute timeframes)
2. Adjust session times to match your trading schedule if needed
3. Watch for breakouts above session highs (bullish) or below session lows (bearish)
4. Check the information panel to see if the breakout aligns with the trend
5. Enter trades in the direction of trend-aligned breakouts for higher probability setups
6. Set stop losses below the opposite side of the session range
## Settings
- **Session Times**: Customize AM and PM session times
- **EMA Lengths**: Adjust trend determination sensitivity
- **Visualization Options**: Toggle display of sessions, breakouts, and VWAP
- **Alert Settings**: Configure alerts for breakouts and trend-aligned conditions
This indicator is valuable for day traders and swing traders looking for objective entry points with higher probability of success.

Auction Session Ranges (AMT Edition) [ Alerts] Auction Session Ranges (AMT Edition)
► Overview
The Session Ranges ( AMT Edition) is a session-based market structure and auction analysis tool designed to visually reveal acceptance, rejection, imbalance, and continuation across the Asia, London, and New York CME trading sessions.
Unlike typical indicators, this script is grounded in Auction Market Theory (AMT) and session-based structure, focusing on how price behaves at session extremes rather than relying on lagging calculations, oscillators, or predictive algorithms. Its purpose is to highlight areas where the market has earned the right to be traded, providing traders with a clear, rules-based framework for high-probability directional trades.
Important for backtesting: To properly backtest session extremes, Interaction Lines, and Closest Opposite Extreme Lines, you must use TradingView’s replay mode, as real-time bar-by-bar progression is required to observe how the market interacts with session extremes over time.
► Key Innovations
This is not a conventional session high/low indicator. Its originality comes from several unique design elements:
Differentiates interaction from true acceptance: Price touching an extreme does not automatically indicate directional intent.
Separates directional confirmation from range-bound indecision: Only confirmed crossings beyond the Interaction Line signal actionable bias.
Tracks failed auctions and partial acceptance: No volume profile or order book data required.
Visual, rule-based trade permission: Signals are objective, minimizing subjective interpretation.
Interaction & Closest Opposite Extreme Lines: Together, these lines map how far an auction progresses after an extreme is tested, highlighting continuation, partial acceptance, or failed auctions.
► Core Concepts Explained
1. Session Highs & Lows (Solid Lines)
Plotted continuously for each CME session (Asia, London, New York).
Represent the current auction boundaries for that session.
2. True Interaction Lines (Thick Dotted Lines)
Drawn when price touches or breaks a session extreme:
Touching session high → dotted line at the low of that candle
Touching session low → dotted line at the high of that candle
Auction context:
Touching alone ≠ acceptance
Acceptance occurs only when price moves beyond the Interaction Line and holds
Trading principle:
Price has not crossed → no directional bias → do not trade
Price crosses and holds → directional bias established
3. Acceptance vs Rejection
Accepted direction: Price crosses and holds beyond the Interaction Line
Rejected direction: Price crosses the line but immediately reverses
Neutral / No-Trade: Price trapped between extreme and Interaction Line
Important: Acceptance is conditional and dynamic. Each time price crosses back over the Interaction Line, acceptance is lost.
4. New Extremes = Continuation
Once an Interaction Line is crossed, each new session extreme in that direction reinforces the trend.
Traders should only look for continuation setups along the established directional bias.
AMT interpretation:
Repeated new extremes → directional imbalance
Failure to make new extremes → potential balance or rotation
5. Closest Opposite Extreme Lines (Thin Dotted Lines)
After acceptance, the script tracks price progress toward the opposite session extreme.
Plotted only if price reaches a user-defined percentage of the session range.
Helps identify:
Full acceptance (price reaches opposite extreme)
Partial acceptance (price stalls)
Failed auctions (price cannot progress meaningfully)
Trading guidance once Closest Lines appear:
Partial acceptance: Price stalls near the Closest Line but does not fully reach the opposite extreme → bias remains valid, but the move may be weakening; consider scaling out or tightening stops.
Full acceptance: Price reaches the opposite extreme → directional auction fully confirmed; bias continues, but expect potential rotation or balance afterward.
Failed auction (cannot progress meaningfully): Price reverses before reaching the Closest Line → signals exhaustion; avoid chasing the move and treat as potential trend failure.
Note: Only relevant after Interaction Line is crossed; if price never crosses the Interaction Line, Closest Lines have no trading significance.
► Step-by-Step Usage
Wait for a session extreme
Let price interact with the session high or low.
Observe the Interaction Line
No cross → do not trade
Cross and hold → directional bias established
Trade in the direction of new extremes only
Ignore counter-trend trades unless the Interaction Line is lost
Manage risk using structure
Interaction Line acts as a dynamic invalidation level
Use Closest Lines for context
Partial acceptance → bias valid, watch for weakening
Full acceptance → bias strong, continuation likely
Failed attempt → potential exhaustion, do not chase
Useful for trade management, scaling, and expectation setting
► Price Retests & Pullbacks
Scenario:
Price crosses above the Interaction Line (e.g., from a low interaction).
Over the next 3–4 15-minute bars, price dips back toward the Interaction Line, with wicks touching it but no decisive close below.
Interpretation:
Initial Acceptance Confirmed: Bias remains valid while price holds above/below the line.
Temporary Pullback / Retest: Market is re-evaluating the auction; testing participant agreement.
Wicks Touching the Line: Partial probing or liquidity sweep; market still respects original acceptance.
Trading Implication:
Continuation bias remains intact.
Pullbacks near the Interaction Line offer lower-risk entries.
Decisive close below → acceptance lost, signaling trend failure or invalidation.
Market Psychology:
Healthy auction behavior: extreme tested → acceptance confirmed → boundary retested for liquidity → continuation.
Failure to hold above signals weak acceptance or exhaustion.
✅ Key Takeaways:
Holding above Interaction Line → bias intact, pullback = opportunity
Closing below Interaction Line → acceptance lost, bias invalidated
Wicks touching only → normal retest, still valid
► No-Trade Conditions
Avoid trading when:
Price never crosses the Interaction Line
Price remains trapped between the extreme and the Interaction Line
Market rotates without forming new extremes
These indicate balance, not directional opportunity.
► Alerts
Optional alerts trigger when price crosses an Interaction Line for:
Asia session
London session
New York session
Alerts signal possible acceptance, not automatic trade entries.
► Who This Script Is For
Best suited for traders who:
Trade session structure in futures, indices, or FX
Follow Auction Market Theory principles
Prefer objective, rules-based confirmation
Want fewer but higher-quality trade opportunities
Not intended for:
Indicator stacking
Predictive trading
High-frequency scalping without structure
► Final Notes
This script does not tell you when to buy or sell.
It shows where the market has earned the right to be traded.
Use it as a decision filter, not a prediction engine.

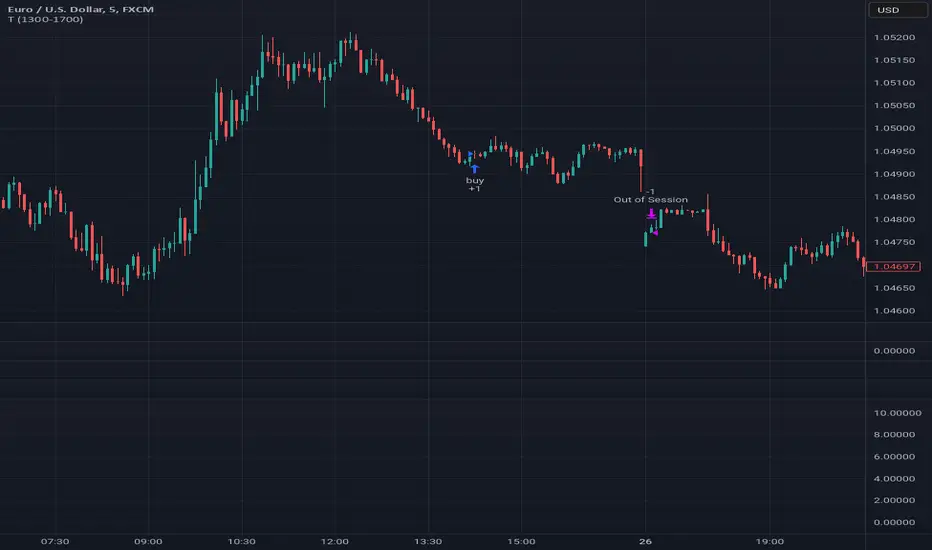
Tutorial - Adding sessions to strategiesA simple script to illustrate how to add sessions to trading strategies.
In this interactive tutorial, you'll learn how to add trading sessions to your strategies using Pine Script. By the end of this session (pun intended!), you'll be able to create custom trading windows that adapt to changing market conditions.
What You'll Learn:
Defining Trading Sessions: Understand how to set up specific time frames for buying and selling, tailored to your unique trading style.
RSI-Based Entry Signals: Discover how to use the Relative Strength Index (RSI) as a trigger for buy and sell signals, helping you capitalize on market trends.
Combining Session Logic with Trading Decisions: Learn how to integrate session-based logic into your strategy, ensuring that trades are executed only during designated times.
By combining these elements, we create an interactive strategy that:
1. Generates buy and sell signals based on RSI levels.
2. Checks if the market is open during a specific trading session (e.g., 1300-1700).
3. Executes trades only when both conditions are met.
**Tips & Variations:**
* Experiment with different RSI periods, thresholds, and sessions to optimize your strategy for various markets and time frames.
* Consider adding more advanced logic, such as stop-losses or position sizing, to further refine your trading approach.
Get ready to take your Pine Script skills to the next level!
~Description partially generated with Llama3_8B
London/NY Sessions [jpkxyz]London/NY Sessions Indicator Guide
This indicator tracks the forex market's most active trading periods: London session, New York session, and their overlap.
This characteristics of the London and New York trading sessions are well documented and many traders use them as a key element in their trading strategies. It is most relevant in forex trading, however it is to an extend also applicable in cryptocurrencies.
London Session (08:00-16:00 UTC)
Most active trading session (35% of daily forex volume)
Highest trading volume and liquidity
Major price movements and trend development
Significant institutional participation
New York Session (13:00-20:00 UTC)
Second most active trading period
High institutional order flow
Major US economic releases
Significant impact on USD pairs
London/New York Overlap (13:00-16:00 UTC)
The most active period in forex markets:
Maximum market liquidity
Highest daily trading volume
Strong price movements
Tightest spreads
Peak institutional activity
This indicator helps traders:
Visualize key trading sessions
Track session highs and lows
Monitor overlap dynamics
Identify potential support/resistance levels (session highs/lows)

FVG Sessions [LuxAlgo]The FVG Sessions indicator highlights the first fair value gap of the trading session as well as the session range. Detected fair value gaps extend to the end of the trading session.
Alerts are included on the formation of a session fair value gap, price being within a session fair value gap, mitigations, and price crossing session fair value gaps average.
🔶 USAGE
Trader ICT states that the first fair value gap of the trading session can attract the most significant reaction. Having only one FVG per session allows users to further focus on that precise imbalance as well as external elements.
The mitigation of a fair value gap is clearly indicated on the chart with a more transparent color allowing users to see inverse FVGs.
Extending the fair value gaps allows the imbalance area to provide potential support and resistance.
Do note that this script should be used on intraday charts.
🔶 ALERTS
The script includes the following alerts:
🔹 Bullish/Bearish FVG
Alerts on the formation of the first bullish or bearish FVG of the session.
🔹 Bullish/Bearish FVG Mitigation
Alerts when the first bullish or bearish FVG of the session is mitigated.
🔹 Price Within FVG
Alerts when price is within the first bullish or bearish FVG area of the session.
🔹 Price Cross FVG Average
Alerts when price cross the average level of the first bullish or bearish FVG of the session.

Tomorrow's Custom Sessions: 4x Sessions projected into next dayTool to visualize your favored sessions for the day ahead (4x custom sessions)
-Input four custom sessions; they will be projected into the next day.
-Toggle on/off each session independently.
-Adjust multiplier UP to show more days of history (setting 0 = tomorrow only; setting 1 = today and tomorrow).
-Increase number from 1>>125 to show historical sessions/days, for backtesting purposes.
-If Set to 0, showing tomorrow only; the projected session boxes will disappear as price passes through their right hand edge.
--note: the session defaults i've written are arbitrary/not special; please choose your own--
Setting '0'; shows next day's sessions only

Market Sessions - By LeviathanA simple indicator to help you keep track of 4 market sessions (default: Tokyo, London, New York, Sydney) in 4 different visual forms (boxes, timeline, zones, colored candles) with many other useful tools.
You can choose between 4 different market sessions. The default ones are Tokyo, London, New York and Sydney but you can easily customize the times, names and colors to make the script plot any session you need. Sessions can be viewed in 4 different ways: boxes, zones, timelines, or just colored candles, all with customizable appearances. You can make your chart cleaner by merging sessions overlaps, choosing a custom lookback period and also picking between various additional settings such as viewing session High/Low or Open/Close change in % or pips, hiding weekends, viewing the Open/Close Line to identify session’s direction and 0.5 level to see session’s “Equilibrium” and much more. More updates with interesting tools will be added in the future.
Note: The script will plot the correct default Tokyo, London, New York and Sydney sessions automatically, your chart/Tradingview app timezone does not matter! If you wish to tweak the open/close times of sessions, just make sure you input them in UTC (but even this can be changed later in the settings)
Settings Overview
SESSIONS
- You can show/hide Tokyo Session, rename it, change the color and set up start/end time.
- You can show/hide London Session, rename it, change the color and set up start/end time.
- You can show/hide New York Session, rename it, change the color and set up start/end time.
- You can show/hide Sydney Session, rename it, change the color and set up start/end time.
* Keep in mind that you can fully change and customize these sessions and therefore create any other sessions or a zone you wish to display.
ADDITIONAL TOOLS AND SETTINGS
1. “Change (Pips)” - this will add the pip distance between Session High and Session Low or the pip distance between Session Open and Session Close to the session label.
2. “Change (%)” - this will add the percentage distance between Session High and Session Low or the percentage distance between Session Open and Session Close to the session label.
3. “Merge Overlaps” - this will merge the overlapping sessions and show only one at a time (end of Tokyo is moved to start of London, the end of London is moved to the start of New York, end of New York is moved to start of Sydney and end of Sydney is moved to start of Tokyo).
4. “Hide Weekends” - this will prevent the script from plotting sessions over the weekend when the markets are closed.
5. “Open/Close Line” - this will draw a line from the session open to the session close (or current price, if session is ongoing).
6. “Session 0.5 Level” - this will draw a horizontal line halfway between the session’s high and the session’s low.
7. “Color Candles” - this will color the bars/candlesticks with the color of the session in which they occurred.
8. Display Type” - Choose between three different ways of session visualization (Boxes, Zones and Candles).
9. “Lookback (Days)” - this input tells the script to only draw sessions for X days back (1 = one day).
10. “Change (%/Pips) Source) - this is where you choose the source of “Change (Pips)” and ”Change (%) ” labels. Picking “Session High/Low” will show you the change between Session High and Session Low and picking “Session Open/Close” will show you the change between Session Open and Session Close.
11. “Input Timezone” - this defines the timezone of the session start/end inputs (you don’t have to change this unless you know what you’re doing)
Make sure to read future update logs to keep track of the most recent additions and settings of this script.
Box generation code inspired by Jos(TradingCode), session box visuals inspired by @boitoki's FX Market Sessions

Market Sessions and TPO (+Forecast)This indicator "Market Sessions and TPO (+Forecast)" shows various market sessions alongside a TPO profile (presented as the traditional lettering system or as bars) and price forecast for the duration of the session.
Additionally, numerous statistics for the session are shown.
Features
Session open and close times presented in boxes
Session pre market and post market shown
TPO profile generated for each session (normal market hours only)
A forecast for the remained of the session is projected forward
Forecast can be augmented by ATR
Naked POCs remain on the chart until violated
Volume delta for the session shown
OI Change for the session shown (Binance sourced)
Total volume for the session shown
Price range for the session shown
The image above shows processes of the indicator.
Volume delta, OI change, total volume and session range are calculated and presented for each session.
Additionally, a TPO profile for the most recent session is shown, and a forecast for the remainder of the active session is shown.
The image above shows an alternative display method for the session forecast and TPO profile!
Additionally, the pre-market and post-market times are denoted by dashed boxes.
The image above exemplifies additional capabilities.
That's all for now; further updates to come and thank you for checking this out!
And a special thank you to @TradingView of course, for making all of this possible!

market sessions by sellstreetIndicator of trading sessions:
Indicator created to track the opening of trading sessions:
Asia, Frankfurt, London, New York.
Tracking the opening of these key levels
- Day Opening (DO), Week Opening (WO), Month Opening (MO).
- New York (NYM) openings display.
- Highs and lows of the previous day (PDH/PDL).
- Day of the week display.
- Formation of the Сentral Bank Dealers Range (CBDR).
Indicator settings.
The open source code will help traders to understand the technical part of the script.
Flexible visual and technical setup of the indicator:
- Ability to enable/disable the display of trading sessions on the history.
- Enabling/disabling the display of the key opening levels on the chart history for a convenient backtest.
- Automatically switch to summer/winter time.
To use this indicator, add it to your favorites after the chart
TradingView must be overloaded to work correctly.

Take Session High/Low Alert [MsF]Japanese below / 日本語説明は英文の後にあります。
-------------------------
This indicator that displays High/Low lines for each session. The Key Levels of each session can be visually recognized, which is useful for PD Array analysis. You can display the last 3 days. Based on trinity by ICT.
The biggest feature is that the color shape of the line changes when reaching High/Low. Of course, you can also set alerts.
Unreached High/Low lines can be extended to the right. hides all timeframes over 1 hour. (alert is alive)
You can choose 4 sessions. If you only want to use 3 sessions, you can do that by setting the same session time for 2 of the 4 session settings.
About Parameter Settings
Session Time: Please set it to be a 24-hour cycle. You can also specify the time zone. The default is NY time.
Basis/Other color: The first time specified in "Session Time" in this indicator's parameter is the "Basis color". "Other color" is a line other than that.
Enable Time Lines: You can turn on/off the display of vertical lines.
High/Low color: High/Low line setting that has not been reached.
Taken color: High/Low line setting that has already been reached.
Extend Lines: Allows unreached High/Low lines to be extended to the right in the chart.
-------------------------
セッションごとのHigh/Lowをライン表示するインジケーターです。
過去約3日分を表示することができます。
最大の特徴はHigh/Low到達時にラインの色形が変わることです。もちろんアラート設定も可能です。
未到達のHigh/Lowラインは右側に延長することができます。
チャート表示がビジーとなる為、1時間を超える時間足ではすべて非表示とする仕様です。(アラートは生きてます)
セッションは4つ指定できます。
もしセッションを3つのみ使用したい場合は、4つのセッション設定の内2つに同じセッション時間を設定することで実現可能です。
■パラメータ設定
Session Time:24時間周期となるように設定してください。またタイムゾーンが指定できます。デフォルトはNY timeです。
Basis/Other color:パラメータの"Session Time"にて一番最初に指定した時間が基準=Basisとなります。Otherはそれ以外のラインとなります。
Enable Time Lines:垂直ラインの表示ON/OFFが可能です。
High/Low color:未到達のHigh/Lowライン設定となります。
Taken color:到達済みのHigh/Lowライン設定となります。
Extend Lines:未到達のHigh/Lowラインを右に延長できます。

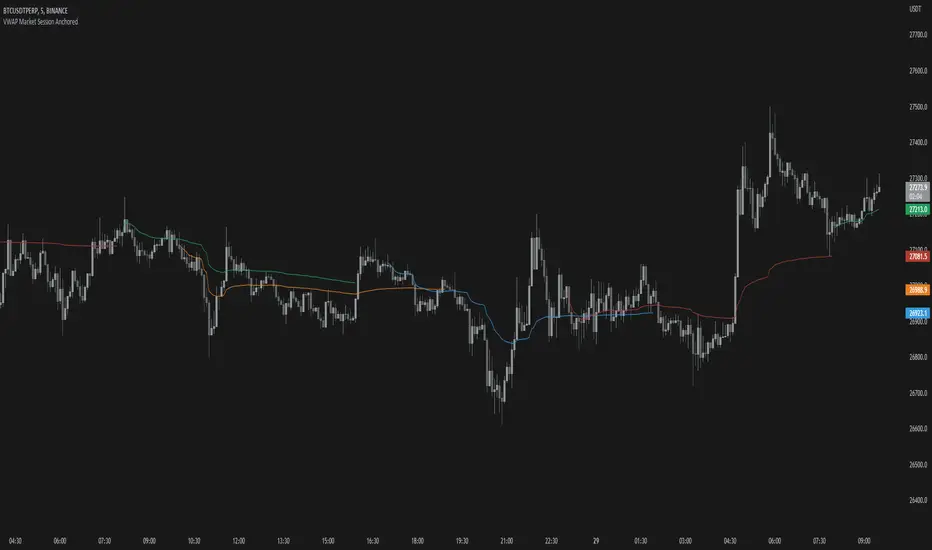
VWAP Market Session AnchoredVWAP Market Session Anchored differs from the traditional VWAP or VWAP Auto Anchored indicator in that the Volume Weighted Average Price calculation is automatically anchored to four major market session starts: Sydney, London, Tokyo, New York.
Settings
Source: the source for the VWAP calculation.
Offset: changing this number will move the VWAP either Forwards or Backwards, relative to the current market. Zero is the default.
Band: enabling this will show Standard Deviation bands.
Band Multiplier: the value the Standard Deviation bands will be multiplied by before being plotted on the chart.
Sessions : enabling the sessions will plot the respective anchored VWAP on chart.
Custom: enabling this will show a custom user-defined session.
Custom UTC : the custom session is defined by a starting UTC hour followed by the ending UTC hour.
Usage
Similar to the traditional VWAP, VWAP Market Session Anchored is a technical analysis tool used to measure the average price weighted by volume. VWAP Market Session Anchored can be used to identify the trend during a specific market session.
Limitations
When setting a custom session, be mindful that calculations are based off of the Coordinated Universal Time (UTC) time, you must convert your local time zone to UTC in order to have an accurate representation of your custom session.
It is not recommended to use this indicator on timeframes above 1 hour as market sessions only last a few hours.
Major Trading Sessions IndicatorsThis indicator displays vertical lines on your chart to mark the opening times of the major global trading sessions (Tokyo, Shanghai/HK, London, and New York). As a crypto trader I want to find price action patterns after sessions open.
It's fully customizable and extendable (you could add closing time for sessions as well)
Works best on short timeframes.
Features:
6 configurable vertical lines (4 preset for major sessions + 2 custom)
Each line shows a customizable label (e.g., "Tokyo", "London")
Individual time and color settings for each line
UTC offset for each line to handle Daylight Saving Time
Option to fix all labels at a specific price level for cleaner appearance (need to set and save it for each chart, it becomes a mess if you don't). Default behavior and limit of Pine Script is that it will be attached to the price wick.
Default Sessions:
Tokyo: 00:00 UTC (midnight)
Shanghai/HK: 01:30 UTC
London: 08:00 UTC (winter) - adjust offset to +1 for summer
New York: 13:00 UTC (winter) - adjust offset to -4 for summer
DST Adjustments:
Simply change the UTC offset when daylight saving time begins/ends:
London: 0 (winter) or +1 (summer)
New York: -5 (winter) or -4 (summer)
Lines extend from top to bottom of the chart and appear precisely when each session opens.
My preferred configuration: shorten names and reduce opacity of colors to 20-30%.
