Simple Sessions - [TTF]In working with a lot of new traders, one of the most common hurdles that they tend to encounter is properly identifying the various major trading sessions around the world. While it's pretty intuitive to grasp the basic concept, the biggest struggle is around the time conversion. Most people are pretty familiar with the trading session most local to them (e.g. US residents are generally pretty familiar with when the US session is relative to their local timezone), but tend to have much more difficulty in determining when exactly the start and end times are of "foreign" sessions (e.g. Europe or Tokyo). This can be even more challenging when trying to account for regional time differences (like Daylight Savings Time), and larger global time differences (e.g. seasons in opposite hemispheres are reversed). It was with these things in mind that we took to making this version of a sessions indicator to help people better visualize and interact with the various sessions in a more intuitive manner.
Key features include:
Individual settings and configuration for each major session (America/New York, Europe/London, and Asia/Tokyo), along with customizable highlighting color for the Europe/US Mixed session
Session start and end times are configured as the local time for those session (e.g. America/New York session time is configured relative to the US Eastern timezone)
The indicator will automatically handle the timezone conversion and correctly display the sessions on chart regardless of the user's on-chart configured timezone
Users can customize which days of the week that they want the sessions to include or exclude based on their personal preferences and trading schedule (e.g. exclude Fridays since that is when most news events occur)
There is an additional fully-customizable session that can be configured (including reference timezone) for a fully-custom trading window visualization (helpful for people with constraints in their trading availability and can't align with one of the "major" sessions)
We hope that the community finds this as helpful as we hope, and feedback is always welcome!
在腳本中搜尋"session"

Forex Session TrackerForex Session Tracker - Professional Trading Session Indicator
The Forex Session Tracker is a comprehensive and visually intuitive indicator designed specifically for forex traders who need precise tracking of major global trading sessions. This powerful tool helps traders identify active market sessions, monitor session-specific price ranges, and capitalize on volatility patterns unique to each trading period.
Understanding when major financial centers are active is crucial for forex trading success. This indicator provides real-time visualization of the Tokyo, London, New York, and Sydney trading sessions, allowing traders to align their strategies with peak liquidity periods and avoid low-volatility trading windows.
---
Key Features
📊 Four Major Global Trading Sessions
The indicator tracks all four primary forex trading sessions with precision:
- Tokyo Session (Asian Market) - Captures the Asian trading hours, ideal for JPY, AUD, and NZD pairs
- London Session (European Market) - Monitors the most liquid trading period, perfect for EUR, GBP pairs
- New York Session (American Market) - Tracks US market hours, essential for USD-based currency pairs
- Sydney Session (Pacific Market) - Identifies the opening of the trading week and AUD/NZD activity
Each session is fully customizable with individual color schemes, making it easy to distinguish between different market periods at a glance.
🎯 Session Range Visualization
For each active trading session, the indicator automatically:
- Draws rectangular boxes that highlight the session's time period
- Tracks and displays session HIGH and LOW price levels in real-time
- Creates horizontal lines at session extremes for easy reference
- Positions session labels at the center of each trading period
- Updates dynamically as new highs or lows are formed within the session
This visual approach helps traders quickly identify:
- Session breakout opportunities
- Support and resistance zones formed during specific sessions
- Range-bound vs. trending session behavior
- Key price levels that institutional traders are watching
📱 Live Information Dashboard
A sleek, professional information panel displays:
- Real-time session status - Instantly see which sessions are currently active
- Color-coded indicators - Green dots for active sessions, gray for closed sessions
- Timezone information - Confirms your current timezone settings
- Customizable positioning - Place the dashboard anywhere on your chart (Top Left, Top Right, Bottom Left, Bottom Right)
- Adjustable size - Choose from Tiny, Small, Normal, or Large text sizes for optimal visibility
The dashboard provides at-a-glance awareness of market conditions without cluttering your chart analysis.
⚙️ Extensive Customization Options
Every aspect of the indicator can be tailored to your trading preferences:
Session-Specific Controls:
- Enable/disable individual sessions
- Customize colors for each trading period
- Adjust session times to match your broker's server time
- Toggle background highlighting on/off
- Show/hide session high/low lines independently
General Settings:
- UTC Offset Control - Adjust timezone from UTC-12 to UTC+14
- Exchange Timezone Option - Automatically use your chart's exchange timezone
- Background Transparency - Fine-tune the opacity of session highlighting (0-100%)
- Session Labels - Show or hide session name labels
- Information Panel - Toggle the live status dashboard on/off
Style Settings:
- Turn session backgrounds ON/OFF directly from the Style tab
- Maintain clean charts while keeping all analytical features active
🔔 Built-in Alert System
Stay informed about session openings with customizable alerts:
- Tokyo Session Started
- London Session Started
- New York Session Started
- Sydney Session Started
Set up notifications to never miss important market opening periods, even when you're away from your charts.
---
How to Use This Indicator
For Day Traders:
1. Identify High-Volatility Periods - Focus your trading during London and New York session overlaps for maximum liquidity
2. Monitor Session Breakouts - Watch for price breaks above/below session highs and lows
3. Avoid Low-Volume Periods - Recognize when major sessions are closed to avoid false signals
For Swing Traders:
1. Mark Key Levels - Use session highs and lows as support/resistance zones
2. Track Multi-Session Patterns - Observe how price behaves across different trading sessions
3. Plan Entry/Exit Points - Time your trades around session openings for better execution
For Currency-Specific Traders:
1. JPY Pairs - Focus on Tokyo session movements
2. EUR/GBP Pairs - Monitor London session activity
3. USD Pairs - Track New York session volatility
4. AUD/NZD Pairs - Watch Sydney and Tokyo sessions
---
Technical Specifications
- Pine Script Version: 5
- Overlay Indicator: Yes (displays directly on price chart)
- Maximum Bars Back: 500
- Drawing Objects: Up to 500 lines, boxes, and labels
- Performance: Optimized for real-time data processing
- Compatibility: Works on all timeframes (recommended: 5m to 1H for session tracking)
---
Installation & Setup
1. Add to Chart - Click "Add to Chart" after copying the script to Pine Editor
2. Configure Timezone - Set your UTC offset or enable "Use Exchange Timezone"
3. Customize Colors - Choose your preferred color scheme for each session
4. Adjust Display - Enable/disable features based on your trading style
5. Set Alerts - Create alert notifications for session starts
---
Best Practices
✅ Combine with Price Action - Use session ranges alongside candlestick patterns for confirmation
✅ Watch Session Overlaps - The London-New York overlap (1300-1600 UTC) typically shows highest volatility
✅ Respect Session Highs/Lows - These levels often act as intraday support and resistance
✅ Adjust for Your Broker - Verify session times match your broker's server clock
✅ Use Multiple Timeframes - View sessions on both lower (15m) and higher (1H) timeframes for context
---
Why Choose Forex Session Tracker Pro?
✨ Professional Grade Tool - Built with clean, efficient code following TradingView best practices
✨ Beginner Friendly - Intuitive design with clear visual cues
✨ Highly Customizable - Adapt every feature to match your trading style
✨ Performance Optimized - Lightweight code that won't slow down your charts
✨ Actively Maintained - Regular updates and improvements
✨ No Repainting - All visual elements are fixed once the session completes
---
Support & Updates
This indicator is designed to provide reliable, accurate session tracking for forex traders of all experience levels. Whether you're a scalper looking for high-volatility windows or a position trader marking key institutional levels, the Forex Session Tracker Pro delivers the insights you need to make informed trading decisions.
Happy Trading! 📈
---
Disclaimer
This indicator is a tool for technical analysis and should be used as part of a comprehensive trading strategy. Past performance does not guarantee future results. Always practice proper risk management and never risk more than you can afford to lose. Trading forex carries a high level of risk and may not be suitable for all investors.

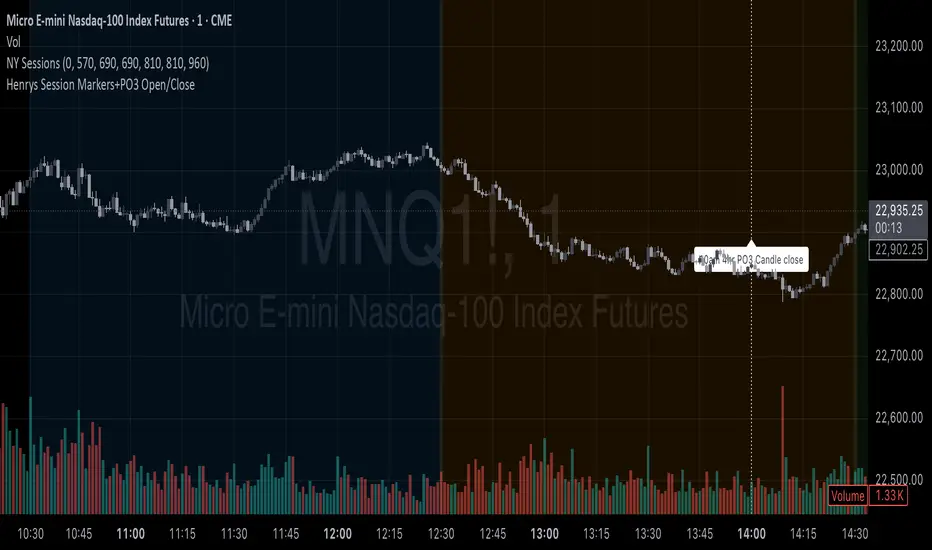
Henrys Session Markers+PO3 Open/CloseThis indicator marks out New Day, Asia, London, and New York Sessions. It also marks out when the 10am PO3 Candle opens and closes. I hope this helps out other traders who trade ICT/SMC who dont want to mark out session start/close each day and while backtesting.
Forex Session + Volume Profile [RunRox]📊 Forex Session + Volume Profile is built especially for traders who work with intra-session liquidity concepts or any strategy that needs a clear visual of trading sessions and the liquidity inside them.
Our team created this indicator to give you better session visibility, flexible session styling, and extra tools that help you navigate the market more easily.
📌 Features:
6 fully customizable sessions
Kill Zone (the high-impact trading window)
Volume Profile for each session
POC / VAL / VAH / LVN levels (Point of Control, Value Area Low, Value Area High, Low Volume Node)
PDH / PDL levels (Previous Day High / Low)
PWH / PWL levels (Previous Week High / Low)
NYM level (New York Market level)
Active sessions table
5 style options for each session
All of this gives you the flexibility to set up exactly the layout you need for your trading. Below, you’ll find a more detailed look at each feature.
🗓️ 6 CUSTOMIZABLE SESSION
The indicator includes six sessions that you can fully customize to fit your needs—everything from naming each session and choosing line colors to adjusting opacity, showing the volume profile, or even turning off a session entirely if you don’t need it.
Plus, you can pick different display styles for each session. As shown in the screenshot below, there are five style options you can apply individually to every session.
5 Style Options for Sessions
BOX
AREA
ZONES
LINES
CURVED
These styles can be customized for each session individually to help you highlight the sessions you care about on your chart. Example below
📢 VOLUME PROFILE
We’ve also integrated a Volume Profile into the indicator to pinpoint important levels on the chart. On top of that, we’ve added extra volume-based levels. Below, you’ll find the settings and a visual demo of how it appears on your chart.
To identify optimal entry points, you can use the following key reference levels:
POC (Point of Control)
VAL (Value Area Low)
VAH (Value Area High)
LVN (Low Volume Node)
You can also customize colors and line styles, or hide any levels you don’t need on your chart.
📐 ADDITIONAL LEVELS
You can display the following levels on your chart:
NYM (New York Market)
PDH (Previous Day High)
PDL (Previous Day Low)
PWH (Previous Week High)
PWL (Previous Week Low)
All of these are fully customizable with color selection and the option to extend lines into the next period.
💹 ACTIVE SESSION TABLE
The active sessions table helps you quickly identify the trading times for the sessions you care about. It’s fully customizable, with options to choose border and background colors for the table itself.
🟠 USAGE
This indicator is highly versatile: use it to simply mark trading sessions on your chart, set up the Kill Zone at your chosen time, or identify the context of the previous session by its most traded range levels. All of this makes the indicator an invaluable tool for any trader!

Session Breakouts & Trend Indicator# Session Breakouts & Trend Indicator
This indicator identifies high-probability trading opportunities by tracking key intraday sessions and their breakouts while aligning them with the overall market trend direction.
## What Makes This Indicator Unique
Unlike standard breakout indicators that only identify when price crosses a threshold, this indicator:
- Dynamically identifies and tracks important daily sessions (default: AM 09:00-10:00 and PM 15:00-16:00)
- Determines trend direction using a triple EMA system (20/50/200)
- Shows when breakouts align with the overall trend (higher probability setups)
- Provides visual confirmation with session ranges, breakout levels, and background highlighting
- Includes a comprehensive information panel showing trend/session alignment
## How It Works
The indicator tracks two important daily sessions:
1. **AM Session**: Typically the first hour of trading (default: 09:00-10:00)
2. **PM Session**: Typically the last hour of trading (default: 15:00-16:00)
For each session, it:
- Marks the high and low range
- Establishes breakout levels above/below these ranges
- Detects when price breaks beyond these levels
- Determines if the breakout aligns with the prevailing trend
The trend is calculated using three EMAs (20, 50, 200) for reliable trend identification.
## How To Use
1. Apply the indicator to your chart (works best on 5-minute timeframes)
2. Adjust session times to match your trading schedule if needed
3. Watch for breakouts above session highs (bullish) or below session lows (bearish)
4. Check the information panel to see if the breakout aligns with the trend
5. Enter trades in the direction of trend-aligned breakouts for higher probability setups
6. Set stop losses below the opposite side of the session range
## Settings
- **Session Times**: Customize AM and PM session times
- **EMA Lengths**: Adjust trend determination sensitivity
- **Visualization Options**: Toggle display of sessions, breakouts, and VWAP
- **Alert Settings**: Configure alerts for breakouts and trend-aligned conditions
This indicator is valuable for day traders and swing traders looking for objective entry points with higher probability of success.

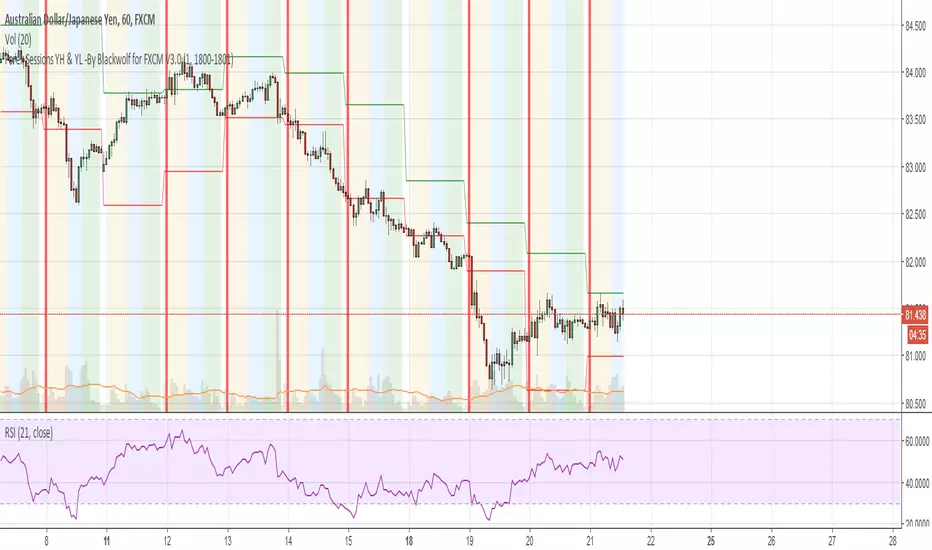
Forex Sessions YH & YL -By Blackwolf for FXCM V3.0This script is used to mark asian, european and american session for broker FXCM and it shows the yesterday high and yesterday low
Italian Translation
Indicatore per segnare sessioni Asiatica Europea ed Americana con Broker FXCM 5.18% ed inoltre traccia anche lo Yesterday High e Yesterday Low (massimo e minimo del giorno precedente).
ADO Sessions - New York, London, AsiaOverview
ADO Sessions is a clean and flexible session visualization indicator for TradingView.
It highlights the three major trading sessions — New York, London, and Asia — directly on the chart using vertical session boundaries, optional background shading, and clear session labels.
The indicator is designed to help traders quickly understand when liquidity, volatility, and session-specific behavior occur, without cluttering the chart.
Key Features
• Separate sessions for New York, London, and Asia
• Vertical start and end lines for each session
• Session name displayed directly on the chart
• Three background modes per session:
Off – no background shading
Price Only – background limited to the session price range
Everywhere – background across the full chart height
• Fully customizable colors and transparency
• Works on all intraday timeframes
How It Works
Each session is defined by a time range and operates independently.
When a session starts, a vertical line marks the beginning
When it ends, a second vertical line marks the close
The session name is displayed at the top-left of the session
Background behavior depends on the selected mode:
Off → only lines and label are shown
Price Only → background follows the session’s high and low
Everywhere → background fills the entire chart vertically
Best Use Cases
• Intraday trading
• Session-based strategies
• Liquidity and volatility analysis
• Crypto, Forex, Indices, and Futures
Notes
This indicator does not provide trading signals.
It is a visual tool intended to support discretionary trading and session awareness.

[ICT Sebo Lite] SessionOverview
This indicator visualizes the Asia, London and New York trading sessions using a DST-aware New York time reference. It dynamically tracks each session’s high, low and midpoint and highlights key interaction areas across sessions.
The script is designed as a lightweight session-structure and contextual reference tool and does not generate trade signals.
How it works
Each session is defined using configurable session times and is calculated with full daylight saving time support based on the New York timezone. When a session begins, the indicator starts tracking the session high and low in real time and continuously updates these levels until the session ends.
For each session, the following elements are plotted directly on the chart: the session high, the session low and a dynamic midpoint calculated from the current range. These levels extend forward and can remain visible into subsequent sessions to provide structural context.
Session interaction and level tracking
The indicator monitors how session highs and lows interact with later sessions. When a prior session’s high or low is traded during London or New York, the event is marked directly on the chart with a label. Each level is locked after being touched to avoid repeated signals.
This behavior helps highlight common session-based liquidity interactions, such as Asia range highs or lows being taken during London or New York.
Initial session range highlight
For each session, the indicator highlights the initial portion of the session range, corresponding to approximately the first third of the session duration. This area is displayed as a shaded box that dynamically adjusts to the evolving session high and low.
The highlighted range provides a visual reference for early-session price development and potential areas of interest as the session unfolds.
Intended use
This tool supports session-based market structure analysis, liquidity context evaluation and time-based price behavior studies. It is suitable for intraday analysis and should be used in combination with broader market context and risk management.
Notes
This indicator does not predict price direction, does not provide entry or exit signals and is intended purely as a visual and analytical aid.

Auction Session Ranges (AMT Edition) [ Alerts] Auction Session Ranges (AMT Edition)
► Overview
The Session Ranges ( AMT Edition) is a session-based market structure and auction analysis tool designed to visually reveal acceptance, rejection, imbalance, and continuation across the Asia, London, and New York CME trading sessions.
Unlike typical indicators, this script is grounded in Auction Market Theory (AMT) and session-based structure, focusing on how price behaves at session extremes rather than relying on lagging calculations, oscillators, or predictive algorithms. Its purpose is to highlight areas where the market has earned the right to be traded, providing traders with a clear, rules-based framework for high-probability directional trades.
Important for backtesting: To properly backtest session extremes, Interaction Lines, and Closest Opposite Extreme Lines, you must use TradingView’s replay mode, as real-time bar-by-bar progression is required to observe how the market interacts with session extremes over time.
► Key Innovations
This is not a conventional session high/low indicator. Its originality comes from several unique design elements:
Differentiates interaction from true acceptance: Price touching an extreme does not automatically indicate directional intent.
Separates directional confirmation from range-bound indecision: Only confirmed crossings beyond the Interaction Line signal actionable bias.
Tracks failed auctions and partial acceptance: No volume profile or order book data required.
Visual, rule-based trade permission: Signals are objective, minimizing subjective interpretation.
Interaction & Closest Opposite Extreme Lines: Together, these lines map how far an auction progresses after an extreme is tested, highlighting continuation, partial acceptance, or failed auctions.
► Core Concepts Explained
1. Session Highs & Lows (Solid Lines)
Plotted continuously for each CME session (Asia, London, New York).
Represent the current auction boundaries for that session.
2. True Interaction Lines (Thick Dotted Lines)
Drawn when price touches or breaks a session extreme:
Touching session high → dotted line at the low of that candle
Touching session low → dotted line at the high of that candle
Auction context:
Touching alone ≠ acceptance
Acceptance occurs only when price moves beyond the Interaction Line and holds
Trading principle:
Price has not crossed → no directional bias → do not trade
Price crosses and holds → directional bias established
3. Acceptance vs Rejection
Accepted direction: Price crosses and holds beyond the Interaction Line
Rejected direction: Price crosses the line but immediately reverses
Neutral / No-Trade: Price trapped between extreme and Interaction Line
Important: Acceptance is conditional and dynamic. Each time price crosses back over the Interaction Line, acceptance is lost.
4. New Extremes = Continuation
Once an Interaction Line is crossed, each new session extreme in that direction reinforces the trend.
Traders should only look for continuation setups along the established directional bias.
AMT interpretation:
Repeated new extremes → directional imbalance
Failure to make new extremes → potential balance or rotation
5. Closest Opposite Extreme Lines (Thin Dotted Lines)
After acceptance, the script tracks price progress toward the opposite session extreme.
Plotted only if price reaches a user-defined percentage of the session range.
Helps identify:
Full acceptance (price reaches opposite extreme)
Partial acceptance (price stalls)
Failed auctions (price cannot progress meaningfully)
Trading guidance once Closest Lines appear:
Partial acceptance: Price stalls near the Closest Line but does not fully reach the opposite extreme → bias remains valid, but the move may be weakening; consider scaling out or tightening stops.
Full acceptance: Price reaches the opposite extreme → directional auction fully confirmed; bias continues, but expect potential rotation or balance afterward.
Failed auction (cannot progress meaningfully): Price reverses before reaching the Closest Line → signals exhaustion; avoid chasing the move and treat as potential trend failure.
Note: Only relevant after Interaction Line is crossed; if price never crosses the Interaction Line, Closest Lines have no trading significance.
► Step-by-Step Usage
Wait for a session extreme
Let price interact with the session high or low.
Observe the Interaction Line
No cross → do not trade
Cross and hold → directional bias established
Trade in the direction of new extremes only
Ignore counter-trend trades unless the Interaction Line is lost
Manage risk using structure
Interaction Line acts as a dynamic invalidation level
Use Closest Lines for context
Partial acceptance → bias valid, watch for weakening
Full acceptance → bias strong, continuation likely
Failed attempt → potential exhaustion, do not chase
Useful for trade management, scaling, and expectation setting
► Price Retests & Pullbacks
Scenario:
Price crosses above the Interaction Line (e.g., from a low interaction).
Over the next 3–4 15-minute bars, price dips back toward the Interaction Line, with wicks touching it but no decisive close below.
Interpretation:
Initial Acceptance Confirmed: Bias remains valid while price holds above/below the line.
Temporary Pullback / Retest: Market is re-evaluating the auction; testing participant agreement.
Wicks Touching the Line: Partial probing or liquidity sweep; market still respects original acceptance.
Trading Implication:
Continuation bias remains intact.
Pullbacks near the Interaction Line offer lower-risk entries.
Decisive close below → acceptance lost, signaling trend failure or invalidation.
Market Psychology:
Healthy auction behavior: extreme tested → acceptance confirmed → boundary retested for liquidity → continuation.
Failure to hold above signals weak acceptance or exhaustion.
✅ Key Takeaways:
Holding above Interaction Line → bias intact, pullback = opportunity
Closing below Interaction Line → acceptance lost, bias invalidated
Wicks touching only → normal retest, still valid
► No-Trade Conditions
Avoid trading when:
Price never crosses the Interaction Line
Price remains trapped between the extreme and the Interaction Line
Market rotates without forming new extremes
These indicate balance, not directional opportunity.
► Alerts
Optional alerts trigger when price crosses an Interaction Line for:
Asia session
London session
New York session
Alerts signal possible acceptance, not automatic trade entries.
► Who This Script Is For
Best suited for traders who:
Trade session structure in futures, indices, or FX
Follow Auction Market Theory principles
Prefer objective, rules-based confirmation
Want fewer but higher-quality trade opportunities
Not intended for:
Indicator stacking
Predictive trading
High-frequency scalping without structure
► Final Notes
This script does not tell you when to buy or sell.
It shows where the market has earned the right to be traded.
Use it as a decision filter, not a prediction engine.

Market Session Clock# Market Session Clock - Real-Time Global Trading Hours
A professional, real-time dashboard that displays the current time and trading status across major global financial markets. Perfect for forex, futures, and stock traders who need to track multiple market sessions simultaneously.
## Key Features
**Live Market Status Tracking**
- Visual color-coded indicators show which markets are currently open (green) or closed (red)
- Automatic weekend detection - all markets show as closed on Saturdays and Sundays
- Real-time clock updates with optional seconds display
**Major Global Markets Covered**
- Tokyo (Asian Session)
- Hong Kong (Asian Session)
- Frankfurt (European Session)
- London (European Session)
- New York (American Session)
- Your Local Time (optional)
**Highly Customizable**
*Display Options:*
- Choose dashboard position (Top Left/Right, Bottom Left/Right)
- Toggle seconds display on/off
- Show/hide your local time
- Three size options: Compact, Normal, Large
*Timezone Settings:*
- Select your local timezone from 40+ global options
- Customize market opening and closing hours for each session
*Professional Styling:*
- Fully customizable color scheme
- Adjustable background, text, header, border colors
- Custom colors for open and closed sessions
- Clean, modern interface that won't clutter your charts
## How It Works
The indicator uses TradingView's `timenow` function to display live, continuously updating times for each market. Session status automatically updates based on the current hour in each timezone, factoring in weekends when markets are closed.
## Use Cases
- **Multi-Market Trading**: Track overlapping sessions for increased volatility opportunities
- **Forex Trading**: Know exactly when major currency pairs are most active
- **Global Portfolio Management**: Monitor when different exchanges are open
- **Session-Based Strategies**: Time your entries and exits around specific market opens/closes
## Default Session Hours
- Tokyo: 9:00 - 18:00 JST
- Hong Kong: 9:00 - 17:00 HKT
- Frankfurt: 8:00 - 17:00 CET
- London: 8:00 - 17:00 GMT
- New York: 8:00 - 17:00 EST
All session times can be adjusted to match your preferred trading hours or specific market schedules.
---
*Note: This indicator is for informational purposes only. Market hours may vary due to holidays and special trading days. Always verify with official exchange schedules.*

EDGE Session LevelsEDGE Session Levels - Comprehensive Intraday Reference Tool
═════════════════════════════════════════════════════════════
OVERVIEW:
EDGE Session Levels automatically plots the most critical price levels that professional traders reference throughout the trading day. This indicator eliminates the need to manually draw or track key session levels, giving you instant visual reference points for support, resistance, and market context.
Designed primarily for futures indices traders (ES, NQ, YM, RTY), this indicator comes pre-configured with the correct session times for equity index futures. However, all time windows are fully customizable, making it adaptable for any futures product including Gold, Crude Oil, Bonds, Stock and more.
═════════════════════════════════════════════════════════════
KEY FEATURES
▸ PRIOR SESSION LEVELS (Yesterday's High & Low)
Displays the previous day's RTH (Regular Trading Hours) high and low. These are among the most watched levels by institutional traders and frequently act as support/resistance zones.
▸ CASH SESSION CLOSE
Plots yesterday's closing price at the end of Regular Trading Hours (default: 3:15 PM CT / 4:15 PM ET). This level represents the final price where cash equity market participants ended their trading day and is a key reference for overnight gap analysis and mean reversion strategies.
▸ CASH SESSION OPEN
Marks today's opening price when the cash equity market opened (default: 8:30 AM CT / 9:30 AM ET). The cash open is a critical level as it represents the first price where stock market participants could execute trades, often leading to significant reactions at this level throughout the session. This time window is fully configurable for traders of other products with different pit open times.
▸ GLOBEX HIGH/LOW (Overnight Range)
Tracks and displays the overnight session's high and low. These levels update dynamically during the Globex session and become fixed once RTH begins. The overnight range often contains price during slower trading periods and breakouts from this range can signal directional momentum.
▸ INITIAL BALANCE (First Hour High/Low)
Captures and displays the high and low of the first hour of trading (8:30-9:30 AM CT). The Initial Balance is a cornerstone of Market Profile theory and is used to gauge whether the market is likely to trend or remain range-bound for the session.
▸ OPENING RANGE BOX
Draws a visual box representing the first 30 seconds of the RTH session. This micro-range can act as an early indication of opening sentiment and potential breakout direction.
═════════════════════════════════════════════════════════════
HOW TO USE THIS INDICATOR
SUPPORT & RESISTANCE
All plotted levels serve as potential support and resistance zones. Watch for price reactions, rejections, or breakouts at these levels to inform your trading decisions.
MARKET CONTEXT
• Trading above prior session levels = bullish context
• Trading below prior session levels = bearish context
• Trading within the overnight range = consolidation/balance
• Breaking out of overnight range = potential trend initiation
INITIAL BALANCE STRATEGY
• Price accepting above IB High = bullish bias for the session
• Price accepting below IB Low = bearish bias for the session
• Price remaining within IB = balanced/rotational day expected
CASH LEVELS
The Cash Open and Cash Close levels are particularly important because they represent where equity market participants (not just futures traders) began and ended their activity. Large institutions often reference these levels for portfolio rebalancing and hedging.
═════════════════════════════════════════════════════════════
CONFIGURATION OPTIONS
Each level group includes the following customization options:
• Display Toggle - Show or hide the entire level group
• Tags Toggle - Show or hide the text labels
• Color Selection - Customize the color of each line
• Line Style - Choose between solid, dashed, or dotted lines
• Line Thickness - Adjust width from 1-4 pixels
═════════════════════════════════════════════════════════════
SESSION TIME SETTINGS
DEFAULT SETTINGS (Equity Index Futures - ES, NQ, YM, RTY):
• Cash Open Window: 08:30-08:31 (8:30 AM CT / 9:30 AM ET)
• Cash Close Window: 15:15-15:16 (3:15 PM CT / 4:15 PM ET)
• Opening Range: 08:30-08:31
• Regular Hours: 08:30-15:15
• Initial Balance: 08:30-09:30
ADJUSTING FOR OTHER PRODUCTS:
If you trade products other than equity index futures, you will need to adjust the session times to match your product's trading hours.
Gold Futures (GC):
• Pit Open: 07:20 CT (8:20 AM ET)
• Adjust Cash Open Window to: 07:20-07:21
Crude Oil Futures (CL):
• Pit Open: 08:00 CT (9:00 AM ET)
• Adjust Cash Open Window to: 08:00-08:01
Treasury Futures (ZB, ZN):
• Pit Open: 07:20 CT (8:20 AM ET)
• Adjust Cash Open Window to: 07:20-07:21
Note: All times in TradingView use the exchange timezone. For CME products, this is Central Time (CT). Adjust the 4-digit time codes accordingly for your specific product and exchange.
═════════════════════════════════════════════════════════════
LEVEL LABELS REFERENCE
• YHi - Yesterday's High
• YLo - Yesterday's Low
• CashCl - Yesterday's Cash Session Close
• CashOpen - Today's Cash Session Open
• ONH - Overnight High (Globex High)
• ONL - Overnight Low (Globex Low)
• IBH - Initial Balance High
• IBL - Initial Balance Low
═════════════════════════════════════════════════════════════
TIMEFRAME RECOMMENDATIONS
This indicator is designed for intraday timeframes. Recommended usage:
• 1-minute to 15-minute charts: All features fully functional
• Hourly charts: Most features work; Opening Range Box may not display
• Daily and above: Indicator will not display (levels are intraday concepts)
For best results, use on 5-minute or 15-minute charts where all levels are clearly visible and price interaction can be easily observed.
═════════════════════════════════════════════════════════════
NOTES
• All levels automatically reset at the start of each new session
• Overnight High/Low levels update dynamically during Globex hours
• The Opening Range Box extends throughout the RTH session for visual reference
• Initial Balance levels appear after the first hour of trading completes

GT3_Trades Sessions Highs & LowsThis indicator automatically identifies and displays the session highs and lows for the three major global market sessions: Asia, London, and New York. It is designed for intraday traders who rely on session-based structure, liquidity levels, and volatility windows. The script dynamically tracks and plots the highest and lowest price reached during each session and extends these levels forward on the chart for strong visual clarity.
Key Features
Session-Based Highs & Lows
Calculates and updates the high and low for each session (Asia, London, New York) in real time as price develops within the session window.
Fully Customizable Display Options
Traders can individually toggle the visibility of each session’s high and low levels.
Line colors, styles (Solid, Dashed, Dotted), and thickness are also user-configurable.
Accurate Timezone Handling
Session times are defined using user-selected timezone settings (default UTC+3), ensuring session boundaries match the trader’s desired market timing.
Automatic Daily Reset
At the start of each new trading day, the indicator clears the previous levels and begins tracking fresh highs and lows for the new day.
Dynamic Line Drawing
Each level is plotted using real Pine Script line objects, which update automatically as new highs or lows form. Once created, each line extends forward to the right—providing clear, persistent references for potential liquidity zones, breakouts, and reversions.
Efficient Tracking Logic
The script keeps track of the bar index where each high/low occurs and updates the line endpoints in real time. Historical levels are not reused, ensuring clean, uncluttered visuals.
How It Helps Traders
Identifies liquidity pools and sweep areas based on session extremes.
Highlights intraday structure shifts when price breaks or respects session highs/lows.
Provides a clear overview of volatility cycles across the global trading day.
Helps detect potential reversal or continuation setups when interacting with session boundaries.
Ideal For
Intraday and scalping strategies
ICT-based session analysis
Liquidity, sweep, and FVG traders
Forex, indices, crypto, and commodities

3CRGANG - SESSIONSOverview
The "3CRGANG - SESSIONS" indicator is a comprehensive tool for visualizing and monitoring major global trading sessions on TradingView charts. It highlights sessions for key exchanges—New York (NYSE), London (LSE), Frankfurt (FSE), Sydney (ASX), Tokyo (TSE), and Hong Kong (HKSE)—with customizable alerts, background coloring on low timeframes, and an interactive dashboard table. Designed for traders who operate across timezones or need session-based context, it accounts for holidays, half-days, and daylight saving time (DST) adjustments to provide accurate, real-time session status. On charts of 1-minute or lower, it overlays semi-transparent background colors to mark active sessions visually. Across all timeframes, a compact table at the bottom center displays session cells with dynamic coloring, and hovering over each reveals a tooltip with the weekly schedule, time until open/close, and holiday notes.
Built on Pine Script v6, this overlay indicator enhances situational awareness for forex, stocks, futures, and other assets by syncing with exchange-specific calendars. Its invite-only status ensures access to refined features that go beyond standard session tools, making it ideal for multi-market strategies.
How It's Built: Core Concepts and Calculations
The indicator leverages a modular approach to session detection, drawing from time-based logic for precision. Sessions are defined by fixed start/end times in their native timezones (e.g., NYSE: 0930-1600 America/New_York), adjusted dynamically for DST via timezone-aware functions. Key components include:
Session Activation Checks: Using helper functions like f_isSessionActive, it evaluates if the current bar or real-time timestamp falls within session hours, excluding weekends. Time is broken into minutes since midnight for comparisons, with special handling for overnight sessions (though none here cross midnight significantly).
Holiday and Half-Day Integration: Pre-loaded holiday maps for each exchange detect full closures or early closes (e.g., NYSE half-days end at custom times like 1300). If a half-day is identified, session end times are overridden, and pre-close periods recalculated (e.g., 30/5 minutes before adjusted close).
Pre-Open/Pre-Close Detection: Sub-sessions (e.g., 30 minutes before open) use similar logic to flag impending events, triggering only on the first bar of these windows via f_SessionOpen and f_SessionClose for efficiency.
Timestamp Calculations: Functions like f_SessionTimes and f_SessionTimesForTooltip compute open/close timestamps from timenow, adjusting for next trading day if after close or on weekends/holidays. This ensures forward-looking accuracy in tooltips.
Alert System: Configurable per-session, it fires notifications for pre-open (30/5 min), open, pre-close (30/5 min), close, and holidays. Alerts use alert.freq_once_per_bar to avoid spam, gated by market open status.
Visual Dashboard: A 6-column table is drawn with table.new, positioned via input (default bottom-center). Cells update colors based on state: active (session color at 75% opacity), pre-active (yellow), or inactive (gray). Tooltips via f_getSessionTooltip compile weekly schedules using f_formatScheduleEntry, which converts session times to user timezone, formats dates (DD/MM), weekdays (padded for alignment), and notes holidays/early closes. Time remaining uses f_formatTimeRemainingtooltip for human-readable countdowns (e.g., "1h:30m").
Background Coloring: On ≤1m timeframes, bgcolor applies session-specific hues (e.g., green for NYSE) at 90-95% transparency, configurable via light/dark themes.
User Customization: Inputs handle timezone (90+ options with DST), time format (standard/military, though not fully implemented in script), device (adjusts text padding/sizes), and theme (swaps colors for readability).
This setup combines timestamp arithmetic, conditional mapping, and array-based date iteration to create a robust, adaptive system that respects global market nuances without relying on simplistic built-in session strings.
Why It's Useful
Trading sessions drive liquidity, volatility, and price action—e.g., London open often sparks trends in forex, while NYSE influences equities. This indicator demystifies these by providing at-a-glance visuals and alerts, reducing the need for manual timezone conversions or external calendars. Background colors on low TFs help spot session overlaps (e.g., London/NY for high volume), while the table's tooltips offer quick weekly overviews, ideal for planning around holidays like Lunar New Year (HKSE-specific additions). Alerts prevent missing key events, and holiday detection avoids false expectations during closures.
For global traders, it minimizes errors in multi-asset setups; scalpers benefit from pre-open warnings, while swing traders use schedules for longer-term context. Its non-intrusive design (transparent on higher TFs) keeps charts clean, enhancing overall workflow efficiency.
How to Use It
Add to Chart: Access via invite-only on TradingView; apply to any timeframe, best on intraday for backgrounds or any for the dashboard.
Configure Inputs:
Time Settings: Select your timezone (e.g., UTC+3 Jerusalem) for accurate tooltip conversions; choose time format (standard preferred for readability).
Visualization Setup: Pick device (Desktop/Tablet/Mobile) for optimized text sizing/padding; select Light/Dark theme to match your chart.
Sessions Dashboard: Adjust table position if needed (default bottom-center).
Notifications Settings: Toggle alerts per exchange (e.g., enable NYSE for US focus).
Trading Application:
Visual Cues: On ≤1m charts, watch for color changes to enter/exit during active sessions. Hover table cells for schedules—current day highlighted, future/past separated, holidays marked (*).
Alerts: Set up in TradingView's alert manager for "alert() function calls only" to get notifications like "New York Session is about to Open in less than 5 minutes!"
Strategies: Use pre-open for setups (e.g., range breaks), closes for profit-taking. Combine with volume indicators during overlaps.
Best Practices: Test on demo; adjust alerts to avoid overload. For non-realtime, tooltips use current date for projections.
Why It's Unique and Worth Invite-Only Access
Unlike basic session highlighters that use rigid time strings or ignore holidays, this indicator integrates a custom holiday library with half-day adjustments and additional events (e.g., Buddha's Birthday for HKSE), ensuring precision across exchanges. Its tooltip system—generating timezone-converted weekly schedules with day adjustments, countdowns, and holiday notes—provides unmatched planning utility, while adaptive visuals (device/theme-aware) and granular alerts (pre-events included) elevate it beyond public tools. The logic for timestamp forward-projection, weekend skipping, and formatted entries builds on but significantly enhances built-in functions and educational examples.
This originality—protecting the proprietary blend of global calendar handling, alert gating, and interactive dashboards—justifies closed-source status. As invite-only, it delivers premium value through reliable, low-maintenance features that free traders from external apps, warranting access for those seeking an edge in session-based trading. Contact via TradingView for support.
Disclaimer
This indicator is a tool for analyzing market sessions and does not guarantee success. Trading involves risk, and past performance is not indicative of future results. Always use proper risk management.

Session ORB 15m Synced + Pre-Sessions + MAs (final v3)Session ORB Live Pro — Pre-Market Boxes & MA Suite
Description (EN):
Session ORB Live Pro is a Pine v6 indicator built for intraday traders who rely on Opening Range Breakouts. It draws session boxes for London, New York, and Asia—plus configurable Pre-London and Pre-New York windows—live from the very first candle (no waiting for 10 bars). The high/low levels update in real time, and optional breakout alerts fire the moment price closes beyond the range. To keep charts clean and relevant for scalping, the boxes auto-hide on chart timeframes above 20 minutes.
Beyond ranges, the tool adds a compact moving-average suite: SMA-50 and RMA-200 out of the box, plus three fully customizable MAs (SMA/EMA/RMA/WMA/HMA) with selectable color, thickness, and style (line, stepline, circles). Each session and pre-session can be toggled on/off and tinted with its own color, so you can tailor the visual map of liquidity grabs and range breaks to your strategy.
Key features
Live ORB boxes for London, New York, Asia (no 10-bar delay).
Pre-sessions: Pre-London & Pre-New York with independent time windows and colors.
Auto visibility filter: boxes show only on ≤ 20m chart TF; hidden on higher TFs.
Breakout alerts when price closes above/below the session range (ready for alert() rules).
MA toolkit: SMA-50, RMA-200 + 3 user MAs (SMA/EMA/RMA/WMA/HMA) with color, style, and width.
Clean inputs using input.session; robust, low-friction UX.
How to use
Set your ORB calculation timeframe (e.g., 15m) and choose which sessions/pre-sessions to display.
Pick colors for each box and enable alerts if you want instant breakout notifications.
Configure the MA suite for trend bias and dynamic S/R (e.g., SMA-50 for momentum, RMA-200 for bias).
Trade the first clean break or the retest of the ORB extremes—your choice. The visual map updates tick by tick.

Market Sessions [APIDEVs]Description
The 🐸 Market Sessions 👑 indicator is an advanced and highly customizable tool designed for traders who want to visualize and manage market sessions directly on their TradingView charts. With support for up to four configurable sessions (by default: Sydney, Tokyo, London, and New York), this indicator allows you to adjust times, time zones, day filters, and display styles to suit your trading strategy.
In addition to displaying active sessions on the chart using dotted lines or colored backgrounds, it includes an interactive table that provides a quick overview of each session's status, active hours, and the current date adjusted to your time zone. Ideal for intraday traders, forex traders, or anyone needing precise control over market periods.
Main Features
Customizable Sessions: Define up to four sessions with unique names, times (HHMM-HHMM format), and colors.
Time Zone Adjustment: Select your time zone (UTC-12 to UTC+12) to align the sessions with your local time.
Day Filter: Enable or disable sessions by day of the week (Monday to Sunday).
Flexible Visualization: Choose between dotted lines ("Line"), colored background ("Background"), or no visual representation ("None").
Information Table: Displays session status (🟢 active / 🔴 inactive), active hours, and the current date in a compact and configurable format (adjustable size and position).
Daily Dividers: Optionally, add vertical lines and labels to mark the change of day (useful on timeframes ≤ 4 hours).
How to Use
Add the indicator to your chart.
Configure the sessions in the settings menu:
Enable/disable sessions and define their names, times, and colors.
Select your time zone to synchronize the times.
Choose the days of the week you want the sessions to be visible.
Customize the display:
Decide if you prefer lines, background, or no representation on the chart.
Adjust the size and position of the table according to your needs.
Analyze the sessions in real-time using the table and the chart.

London/NY Sessions [jpkxyz]London/NY Sessions Indicator Guide
This indicator tracks the forex market's most active trading periods: London session, New York session, and their overlap.
This characteristics of the London and New York trading sessions are well documented and many traders use them as a key element in their trading strategies. It is most relevant in forex trading, however it is to an extend also applicable in cryptocurrencies.
London Session (08:00-16:00 UTC)
Most active trading session (35% of daily forex volume)
Highest trading volume and liquidity
Major price movements and trend development
Significant institutional participation
New York Session (13:00-20:00 UTC)
Second most active trading period
High institutional order flow
Major US economic releases
Significant impact on USD pairs
London/New York Overlap (13:00-16:00 UTC)
The most active period in forex markets:
Maximum market liquidity
Highest daily trading volume
Strong price movements
Tightest spreads
Peak institutional activity
This indicator helps traders:
Visualize key trading sessions
Track session highs and lows
Monitor overlap dynamics
Identify potential support/resistance levels (session highs/lows)

Trading Sessions with Global HolidaysDescription:
This versatile Pine Script provides traders with a visual representation of major global trading sessions: London, New York, Sydney, Hong Kong, Tokyo, and Frankfurt. By highlighting these sessions on the chart, users can better identify optimal trading opportunities aligned with market activity.
Key Features:
Customizable Colors: Choose distinct colors for each trading session, with adjustable opacity to suit your visual preferences.
Holiday Awareness: The script takes into account significant holidays from various countries, ensuring that sessions are only highlighted when the markets are open.
Weekend Option: Users have the flexibility to display or hide weekend sessions, helping to tailor the analysis to specific trading strategies.
Session Activation: Easily enable or disable individual trading sessions based on your trading preferences, allowing for a customized experience.
Visual Clarity: With subtle color tones, the script maintains a clean and professional appearance, ensuring that the session highlights are noticeable without being overwhelming.
Perfect for: Day traders, swing traders, and anyone interested in global market dynamics. Whether you are a novice or an experienced trader, this tool enhances your ability to analyze market trends and make informed decisions.
Elevate your trading experience with this intuitive and informative Trading Sessions script!

Trading SessionsThis Indicator can show the following sessions:
-2 Asian Ranges
-Pre Frankfurt Session
-Frankfurt Session
-London Session
-Pre New York Session
-New York Session
-NYSE Session
-Post NYSE Session
-NYSE Power Hour
-NYSE ETH
For every session it's possible to draw a line on session open price
For the 2 asian Ranges and the NYSE ETH it's possible to draw a line on 50% price
The indicator also can show these elements:
-Daily Session Breaks (changes the background of first hour of every day candle)
-Weekly Session Breaks (changes the background of first hour of every week candle)
-Daily Highs & Lows (draws lines on highs & lows of every day)
Every session duration and time are editable
Every color is editable
Every element can be hidden or shown

FVG Sessions [LuxAlgo]The FVG Sessions indicator highlights the first fair value gap of the trading session as well as the session range. Detected fair value gaps extend to the end of the trading session.
Alerts are included on the formation of a session fair value gap, price being within a session fair value gap, mitigations, and price crossing session fair value gaps average.
🔶 USAGE
Trader ICT states that the first fair value gap of the trading session can attract the most significant reaction. Having only one FVG per session allows users to further focus on that precise imbalance as well as external elements.
The mitigation of a fair value gap is clearly indicated on the chart with a more transparent color allowing users to see inverse FVGs.
Extending the fair value gaps allows the imbalance area to provide potential support and resistance.
Do note that this script should be used on intraday charts.
🔶 ALERTS
The script includes the following alerts:
🔹 Bullish/Bearish FVG
Alerts on the formation of the first bullish or bearish FVG of the session.
🔹 Bullish/Bearish FVG Mitigation
Alerts when the first bullish or bearish FVG of the session is mitigated.
🔹 Price Within FVG
Alerts when price is within the first bullish or bearish FVG area of the session.
🔹 Price Cross FVG Average
Alerts when price cross the average level of the first bullish or bearish FVG of the session.

Tomorrow's Custom Sessions: 4x Sessions projected into next dayTool to visualize your favored sessions for the day ahead (4x custom sessions)
-Input four custom sessions; they will be projected into the next day.
-Toggle on/off each session independently.
-Adjust multiplier UP to show more days of history (setting 0 = tomorrow only; setting 1 = today and tomorrow).
-Increase number from 1>>125 to show historical sessions/days, for backtesting purposes.
-If Set to 0, showing tomorrow only; the projected session boxes will disappear as price passes through their right hand edge.
--note: the session defaults i've written are arbitrary/not special; please choose your own--
Setting '0'; shows next day's sessions only

Market Sessions - By LeviathanA simple indicator to help you keep track of 4 market sessions (default: Tokyo, London, New York, Sydney) in 4 different visual forms (boxes, timeline, zones, colored candles) with many other useful tools.
You can choose between 4 different market sessions. The default ones are Tokyo, London, New York and Sydney but you can easily customize the times, names and colors to make the script plot any session you need. Sessions can be viewed in 4 different ways: boxes, zones, timelines, or just colored candles, all with customizable appearances. You can make your chart cleaner by merging sessions overlaps, choosing a custom lookback period and also picking between various additional settings such as viewing session High/Low or Open/Close change in % or pips, hiding weekends, viewing the Open/Close Line to identify session’s direction and 0.5 level to see session’s “Equilibrium” and much more. More updates with interesting tools will be added in the future.
Note: The script will plot the correct default Tokyo, London, New York and Sydney sessions automatically, your chart/Tradingview app timezone does not matter! If you wish to tweak the open/close times of sessions, just make sure you input them in UTC (but even this can be changed later in the settings)
Settings Overview
SESSIONS
- You can show/hide Tokyo Session, rename it, change the color and set up start/end time.
- You can show/hide London Session, rename it, change the color and set up start/end time.
- You can show/hide New York Session, rename it, change the color and set up start/end time.
- You can show/hide Sydney Session, rename it, change the color and set up start/end time.
* Keep in mind that you can fully change and customize these sessions and therefore create any other sessions or a zone you wish to display.
ADDITIONAL TOOLS AND SETTINGS
1. “Change (Pips)” - this will add the pip distance between Session High and Session Low or the pip distance between Session Open and Session Close to the session label.
2. “Change (%)” - this will add the percentage distance between Session High and Session Low or the percentage distance between Session Open and Session Close to the session label.
3. “Merge Overlaps” - this will merge the overlapping sessions and show only one at a time (end of Tokyo is moved to start of London, the end of London is moved to the start of New York, end of New York is moved to start of Sydney and end of Sydney is moved to start of Tokyo).
4. “Hide Weekends” - this will prevent the script from plotting sessions over the weekend when the markets are closed.
5. “Open/Close Line” - this will draw a line from the session open to the session close (or current price, if session is ongoing).
6. “Session 0.5 Level” - this will draw a horizontal line halfway between the session’s high and the session’s low.
7. “Color Candles” - this will color the bars/candlesticks with the color of the session in which they occurred.
8. Display Type” - Choose between three different ways of session visualization (Boxes, Zones and Candles).
9. “Lookback (Days)” - this input tells the script to only draw sessions for X days back (1 = one day).
10. “Change (%/Pips) Source) - this is where you choose the source of “Change (Pips)” and ”Change (%) ” labels. Picking “Session High/Low” will show you the change between Session High and Session Low and picking “Session Open/Close” will show you the change between Session Open and Session Close.
11. “Input Timezone” - this defines the timezone of the session start/end inputs (you don’t have to change this unless you know what you’re doing)
Make sure to read future update logs to keep track of the most recent additions and settings of this script.
Box generation code inspired by Jos(TradingCode), session box visuals inspired by @boitoki's FX Market Sessions


Market Sessions and TPO (+Forecast)This indicator "Market Sessions and TPO (+Forecast)" shows various market sessions alongside a TPO profile (presented as the traditional lettering system or as bars) and price forecast for the duration of the session.
Additionally, numerous statistics for the session are shown.
Features
Session open and close times presented in boxes
Session pre market and post market shown
TPO profile generated for each session (normal market hours only)
A forecast for the remained of the session is projected forward
Forecast can be augmented by ATR
Naked POCs remain on the chart until violated
Volume delta for the session shown
OI Change for the session shown (Binance sourced)
Total volume for the session shown
Price range for the session shown
The image above shows processes of the indicator.
Volume delta, OI change, total volume and session range are calculated and presented for each session.
Additionally, a TPO profile for the most recent session is shown, and a forecast for the remainder of the active session is shown.
The image above shows an alternative display method for the session forecast and TPO profile!
Additionally, the pre-market and post-market times are denoted by dashed boxes.
The image above exemplifies additional capabilities.
That's all for now; further updates to come and thank you for checking this out!
And a special thank you to @TradingView of course, for making all of this possible!
