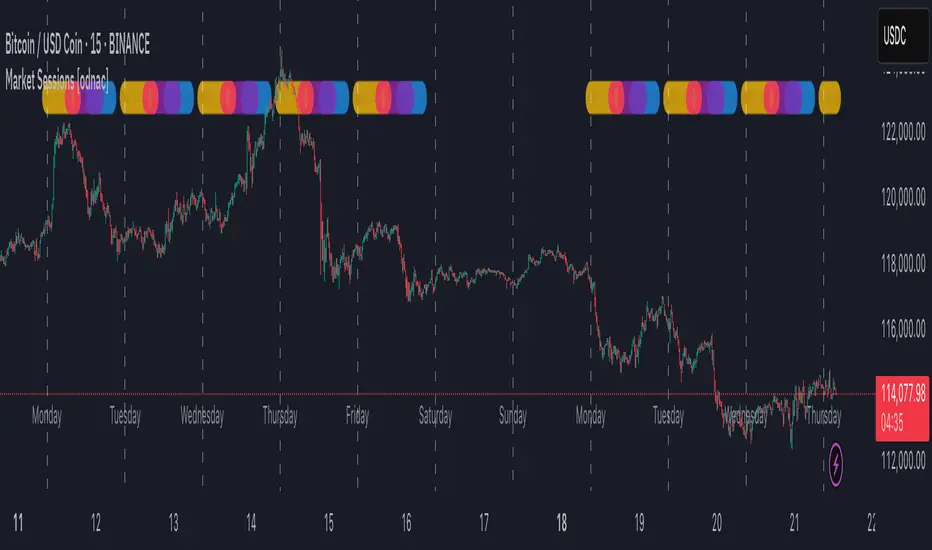
DR/IDR Candles [LuxAlgo]This indicator displays defining ranges (DR) and implied defining ranges (IDR) constructed from two user set sessions (RDR/ODR) as graphical candles on the chart. The script introduces additional graphical elements to the original DR/IDR concept and as such can be thought as a graphical method in addition to a technical indicator.
Additionally, this script can display various Fibonacci retracements from the constructed DR/IDR if enabled within the settings.
Settings
Regular Session: Enable/disable regular session's DR/IDR alongside setting the session time. By default, 09:30 - 10:30 am.
Overnight Session: Enable/disable overnight session's DR/IDR alongside setting the session time. By default, 03:00 - 04:00 am.
UTC Offset: UTC offset for the time zone, by default -5 (EST)
Retracements
Reverse: Inverts source range upper/lower value for constructing the retracements.
From: Source range used to construct the retracements, by default DR is used.
By default, the 0.5 retracement (average line) is displayed.
Usage
The used sessions are highlighted by a gray background. DRs are highlighted by dashed lines while IDRs are highlighted by solid ones. The maximum/minimum price between each user set session is highlighted by solid wicks.
The color of the DRs/IDRs/wicks are determined by the price position relative to the DR; if price is above the DR maximum, then a blue color is used. If price is below, then an orange color is used, and if price is within the DR range, then a gray color is used.
Additionally, the area of the DR range is used to highlight the number of time price is located within the DR, with a longer background highlighting a higher number of occurrences. This can help highlight if the DR levels were potentially useful as support/resistance.
When price is outside the IDR range, the area between the price and IDR is highlighted, in blue if price is above the IDR, and orange if it is under.
The original author of the DR/IDR concept describes 3 rules using the price position relative to the DR/IDR levels:
1.) If price on the 5-minute timeframe closes above the DR high after 10:30 AM or 04:00 AM then the DR low will likely be the low of the trading session.
2.) If price on the 5-minute timeframe closes below the DR low after 10:30 AM or 04:00 AM then the DR high will likely be the high of the trading session.
3.) If price closes above the IDR high after 10:30 AM or 04:00 AM it is an early indication that the low of the DR will be the low of the day and vice versa.
We can see that the above rules are cases of conditional probabilities.
There is no significant data supporting or regarding any statistical probability of the above rules to be true, which are more than uncertain given the stochastic nature of prices. The lack of precision of these rules is also a concern (time zone dependance, applicable markets, etc...).
Credits
Credits to trader TheMas7er who originally created the DR/IDR concept in November of 2022. This script was derived from his proposed session times & rules for trading.
在腳本中搜尋"sessions"
Time Zone / Market SessionsTime Zone / Market Sessions indicator is a handy tool to display current major Market Open / Close condition along with present time at that Exchange. Sydney, Tokyo, London, New York market sessions are included. Clear display of Overlap Zones and Kill Zones.. Can be used to estimate market Pumping and Dumping. Alerts can be set when a market opens.
Time is Displayed in Table Layout
Active Market is displayed as Dots on top and bottom
You can select as Timeline or Table display
Overlap is clearly displayed on top and bottom without any mess
Gray color in Table layout Shows Closed Markets
You are free to reuse this code No Limitations.
Kill Zones are indicated in Table format. When some of the markets are closed
Alerts included for market openings
BTMM R.NOODLEThis script aims to encompass the style of Traders Reality, Steve M (BTTM), and Stacey Burke (youtube)
yesterday and last wk high and low
Custom watermark with examples (good for fullscreen multicharts)
can set it to show the year and week x of year
Colored candles for ays of week.
The theory behind these colors are that monday and tuesday set your initial balance for the week . having color seperation helps identify the balance
mon-tues = initial balance :green
wed +thu : blue
friday: red
Session boxes and daily initial balance
displays the asian and european trading session as one
displays the ny session first 3 hrs
how to combine sessions, weekly ib, daily ib, and sessions
will add pip lines 00/.50 increments at a later date
Intraday predictive High Volume Activity sessions [BEA]Idea:
This indicator is designed to know the high traded volume sessions in advance before the day starts.
The predictive volume bars will be plotted in advance once a new trading session starts.
Logic Used:
The basic idea is to store each bar volume / Volume MA data for the selected time. So, the first bar of each data is stored for all selected historical days.
Once the data is stored, I am taking average of each bar data for the selected Historical days.
How to Use:
This gives me an idea of the volume behavior throughout the days based on historical data. So I decide my time of trading for that specific times sessions where the traded volume activity is high.
The bars which are more than the Moving average ( Highlighted Volume bars plotted in future ) is the time session to focus.
Designed only for intraday timeframes.
Here in the image, you can see the session in advance for high traded volume activity.
Try it test it , let me know if it can be improved further.
Have a happy trading.
DISCLAIMER
Any and all liability for risks resulting from investment transactions or other asset dispositions carried out by the user based on information received or a market analysis is expressly excluded by me.
All the information made available here is generally provided to serve as an example only, without obligation and without specific recommendations for action. It does not constitute and cannot replace investment advice. We therefore recommend that you contact your personal financial advisor before carrying out specific transactions and investments.
Do your own research, this is not a financial advice.
Market Profile with Past SessionsThis script plots market profiles that show the amount of time price has remained at a particular level during past sessions, often referred to as "time price opportunity".
TV user @LonesomeTheBlue created the original Market Profile indicator on which this script is based. This version makes minor changes to the automatic timeframes, and to show historic market profiles and points of control.
The market profile drawing begins at the START of the relevant session being profiled and extends to the right. There is a checkbox in the options that will plot the market profile at the END of the relevant session, if desired.
If you want to view the market profiles for shorter or longer sessions, use the drop down menu to take the Higher Time Frame setting off "Auto", and instead select a specific time interval that is HIGHER than the timeframe your chart is showing.
The market profile and points of control can be used to identify areas likely to serve as potential support or resistance, as well areas where price is likely to retest when it is ranging.
Cristina - Trading Sessions and Moving AveragesCombination of Trading Sessions and Moving Averages. You can easily edit the time frame background to give you a visual presentation of your most active trading hours or customize it to represent the different forex trading session inline with your local time.
The default moving average here is the 20, 50, 100, 200 and 250 MA. The use of moving averages could be in a (1) form of cross over to find out the dominant trend, (2) use it to find value zone or (3) use it to find dynamic support levels. It greatly depends on your trading system.
With the combination of the trading sessions and the moving averages, you could isolate the trades you will be taking inline with your active hours. Thus this is a great tool to add in terms of day trading or swing trading with the lower time frames.
Session Open PricelinesSimple Indicator which shows 5 customizeable Lines for the sessions opening price.
I use it with New York Timezone.
You can easily modify the code for the time, you can also add more sessions to it.
I am no coder and have no idea why the indicator is showing all lines just under m10. I use it with m1 and m3 most of the time.
If you know the answer, it would be so cool if you could write me to modify it and make it work in all timeframes.
London & New York Sessions ESTThis is a sessions displayer that displays only Lond and New York for EST. It is customizable for other sessions as well
Forex Session Breaks DST AWARE!There seems to be no open source forex trading session DST (Daylight Savings Time) aware scripts which I think is absurd. This amazing community deserves better. So I adapted some code by icostan adding DST capabilities.
Original code by icostan here
I added DST code. Warning may not be perfect yet. Could be a bug or two. It only supports 3 major sessions right now but you can add your own rules for the other timezones by copying my logic.
It is open source so please add the other sessions and regions as needed and update me please.
KJ Sessions (Today Only): Asia/London/US + OverlapKJ Sessions : Asia/London/US + Overlap.
best for people to clearly mark Asia, UK and US opening and closing timing.
KJ Sessions : Asia/London/US + OverlapKJ Sessions : Asia/London/US + Overlap.
times are set as per dubai time.
3 Sessions Box (ON/OFF)📖 The Story of the Three Gatekeepers (English Version)
Every trading day is a journey through three different worlds.
The chart is like a city, and price is like a crowd that never stops moving.
To bring structure into this movement, I built a script that summons three gatekeepers — each one guarding a different trading session, drawing a box that marks the boundaries of that time period.
These boxes are not just visuals.
They represent the true ranges where liquidity is built, tested, and finally released.
🌙 Session 1 — The Midnight Shadow
From 00:00 to 08:00 (MYT), the market enters its quietest state.
This is the time when price moves slowly, but it often sets the foundation for the entire day.
The first gatekeeper observes every candle, recording the highest high and lowest low, then seals it into a blue box.
This box becomes the “silent range” — a zone that later sessions may break, retest, or manipulate.
☀️ Session 2 — The Daylight Order
From 08:00 to 16:00 (MYT), the market wakes up.
Liquidity begins to flow, and structure starts to form.
The second gatekeeper draws a green box to capture this session’s true range.
He does not chase price.
He protects order — because real trends often begin here.
🔥 Session 3 — The Night Battlefield
From 16:00 to 23:59 (MYT), the market becomes a battlefield.
Volatility increases, and decisive moves are made.
The third gatekeeper draws a red box, locking in the highs and lows of the final session.
Red means war:
breakouts, fakeouts, liquidity sweeps, and explosive continuations.
This is often where winners and losers are separated.
🎛️ The Most Powerful Feature — You Control the Switch
This script is not fixed.
You can decide:
Focus only on Session 1 ✅
Turn off Session 2 completely ✅
Trade only Session 3 breakouts ✅
Because you are the commander.
The gatekeepers simply execute your rules.
World sessionsThe indicator highlights trading sessions of major global exchanges (Tokyo, Hong Kong, Frankfurt, London, New York, Chicago).
It highlights them with horizontal dashed lines from the start to the end of each session. At the session start, it draws a label with the exchange name above the bar, with adjustable height based on ATR.
With gratitude to God the Father, the Lord Jesus Christ - the Son of God, and the Holy Spirit.
// © icman — ic380.com
// Open Source: исходный код открыт (MPL-2.0)
Session Liquidity Raid ModelSession Liquidity Raid Model
This indicator helps you understand what each market session is doing with liquidity — without guessing, predicting, or over-complicating things.
It tracks the Asia, London, and New York sessions and shows you:
Where each session’s highs and lows are
Whether those levels have been taken (raided) or are still untouched
When New York is likely cleaning up liquidity left by London
The basic idea (very simple)
If London moves price strongly without taking Asia’s opposite side, New York often comes back to raid London levels first before the real move happens.
This indicator makes that process visible at a glance.
What it shows on the chart
Asia High & Low
London High & Low
Whether each level is taken or not
A simple Bullish / Bearish / Neutral session bias
Clean horizontal lines for key session levels
No buy or sell signals.
No indicators stacked on top of each other.
Just context.
How to use it
Use it to avoid bad trades, not force trades
Wait for liquidity to be taken before looking for entries
Combine it with your own price action, structure, or FVGs
If you trade CME_MINI:NQ1! , this helps you stay aligned with what New York is actually doing, instead of reacting late.
Important note
This is not a trading strategy and it does not predict the future.
It simply shows which session still owes liquidity and which one has already been cleared.
CVD Flow Labels for Sessions Ranges [AMT Edition]CVD Flow Labels for Session Ranges
Description:
This script provides a session-aware Cumulative Volume Delta (CVD) analysis designed to enhance the “Session Ranges ” framework by combining price extremes with detailed volume flow dynamics. Unlike generic trend or scalping indicators, this tool focuses on identifying aggressive buying and selling pressure, distinguishing between absorption (failed auctions where aggressive flows are rejected) and acceptance (confirmed continuation of flows).
How it works:
CVD Calculation: The script calculates delta for each bar using a choice of Total, Periodic, or EMA-based cumulative methods. Delta represents the net difference between estimated buying and selling volume per bar.
Normalization: By normalizing delta relative to recent volatility, it highlights extreme flows that are statistically significant, making large shifts in market sentiment easier to spot.
Session-Specific Analysis: The indicator separates Asia, London, and New York sessions to allow context-sensitive interpretation of price and volume interactions. Each session’s extremes are monitored, and flow labels are plotted relative to these extremes.
Flow Labels: Bullish and bearish absorption (“ABS”) and acceptance (“ACC WEAK/STRONG”) labels provide immediate visual cues about whether aggressive flows are being absorbed or accepted at key price levels.
Alerts: Configurable alerts trigger when absorption or acceptance occurs, supporting active trading or strategy automation.
Originality & Usefulness:
This script is original because it integrates volume-based auction theory with session-specific market structure, rather than simply showing trend or scalping signals. By combining CVD dynamics with session extreme levels from the “Session Ranges ” script, traders can:
Identify where price is likely to be accepted or rejected.
Confirm aggressive buying or selling flows before entering trades.
Time entries near session extremes with higher probability setups.
How to use:
Apply the “Session Ranges ” to see session highs, lows, and interaction lines.
Use this CVD Flow Labels script to visualize absorption and acceptance at these session levels.
Enter trades based on alignment of session extremes and flow signals:
Absorption at a session extreme may indicate a potential reversal.
Acceptance suggests continuation in the direction of the flow.
Alerts can help manage trades without constant screen monitoring.
This tool is designed to give traders a structured, session-based view of market auctions, providing actionable insights that go beyond typical trend-following or scalping methods. It emphasizes flow analysis and statistical extremes, enabling traders to make more informed decisions grounded in market microstructure.
ICT IRON-CLAD: Fixed Sessionsall sessions and killzones marked out with colours and lables as used by all traders
3 Trading Sessions [TickDaddy]Customizable 3 trading session indicator. Asia, Longdon, New York. Adjust times for each session, color, opacity. toggle if you want to see future sessions coming up.
New York Sessions High/Low with Liquidity Purge CriteriaDisplays horizontal lines at the highest high and lowest low of the NY AM (09:30–12:00) and NY PM (13:30–16:00) sessions in New York time.
Lines extend forward until price strongly breaks them by a user-defined threshold (N points), at which point they cease extending - liquidity purged.
Option to show only active lines (unpurged liquidity) - toggle to hide old liquidity pools for a cleaner chart.
Customizable colors, line styles, width, lookback days and purge threshold.
Intraday Sessions Ranges with Time SegmentationSession Ranges indicator overlays customizable range boxes on major trading sessions (e.g. London, Premarket, NY AM and NY PM) using New York time.
Toggle visibility, add evenly spaced vertical segment lines, and highlight key time zones. Perfect for traders marking price action and levels across multiple historical days.
ICT Asian & London Range + First Presented FVGIndicator: ICT Sessions + First Presented FVG
What it does: This tool automates the markup of key ICT (Inner Circle Trader) timeframes and entry signals. It allows you to trade on higher timeframes (like the 5m or 15m) while the script automatically "looks inside" the 1-minute chart to find specific setups for you.
Key Features:
Session Ranges (Asian & London)
Automatically highlights the Asian Session (8 PM - Midnight NY) and London Open (2 AM - 5 AM NY).
Draws a shaded box for the session's High and Low.
New: Extends the High and Low lines to 4:00 PM NY (end of the trading day) so you can use them as liquidity targets.
The "First Presented" FVG (Sniper Logic)
It detects the very first Fair Value Gap (FVG) that forms on the 1-minute chart immediately after a session starts.
It draws this 1-minute gap on your current chart, regardless of what timeframe you are viewing.
The FVG box automatically extends to the end of the trading day (4 PM NY), showing you where price might return to "mitigate" or react later in the day.
J&A Sessions & NewsProject J&A: Session Ranges is a precision-engineered tool designed for professional traders who operate based on Time & Price. Unlike standard session indicators that clutter the chart with background colors, this tool focuses on Dynamic Price Ranges to help you visualize the Highs, Lows, and liquidity pools of each session.
It is pre-configured for Frankfurt Time (Europe/Berlin) but is fully customizable for any global location.
Key Features
1. Dynamic Session Ranges (The Boxes) Instead of vertical stripes, this indicator draws Boxes that encapsulate the entire price action of a session.
Real-Time Tracking: The box automatically expands to capture the Highest High and Lowest Low of the current session.
Visual Clarity: Instantly see the trading range of Asia, London, and New York to identify breakouts or range-bound conditions.
2. The "Lunch Break" Logic (Unique Feature) Institutional volume often dies down during lunch hours. This indicator allows you to Split the Session to account for these breaks.
Enabled: The script draws two separate boxes (Morning Session vs. Afternoon Session), allowing you to see fresh ranges after the lunch accumulation.
Disabled: The script draws one continuous box for the full session.
3. Manual High-Impact News Scheduler Never get caught on the wrong side of a spike. Since TradingView scripts cannot access live calendars, this tool includes a Manual Scheduler for risk management.
Input: Simply input the time of high-impact events (e.g., CPI, NFP) from ForexFactory into the settings.
Visual: A dashed line appears on the chart at the exact news time.
Audio Alert: The system triggers an alarm 10 minutes before the event, giving you time to manage positions or exit trades.
Default Configuration (Frankfurt Time)
Asian Session: 01:00 - 10:00 (Lunch disabled)
London Session: 09:00 - 17:30 (Lunch: 12:00-13:00)
New York Session: 14:00 - 22:00 (Lunch: 18:00-19:00)
How to Use
Setup: Apply the indicator. The default timezone is Europe/Berlin. If you live elsewhere, simply change the "Your Timezone" setting to your local time (e.g., America/New_York), and the boxes will align automatically.
Daily Routine: Check the economic calendar in the morning. If there is a "Red Folder" event at 14:30, open the indicator settings and enter 14:30 into the News Scheduler.
Trade: Use the Session Highs and Lows as liquidity targets or breakout levels.
Settings & Customization
Timezone: Full support for major global trading hubs.
Colors: Customize the Box fill and Border colors for every session.
Labels: Rename sessions (e.g., "Tokyo" instead of "Asia") via the settings menu.
TNT TRADER Sessions and Zones Premarket sessions and zone indicator full customization for premarket, yesterdays high and low , london, asia after hours etc.


