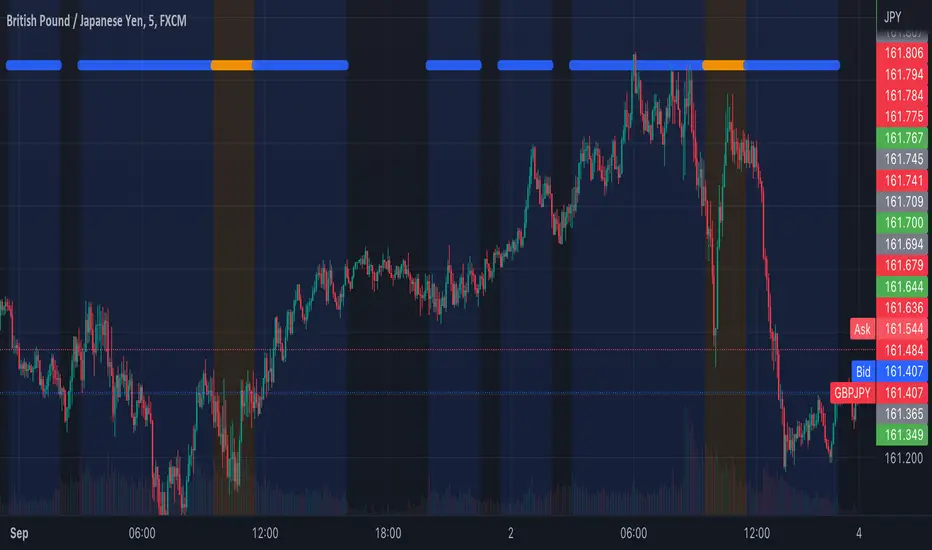
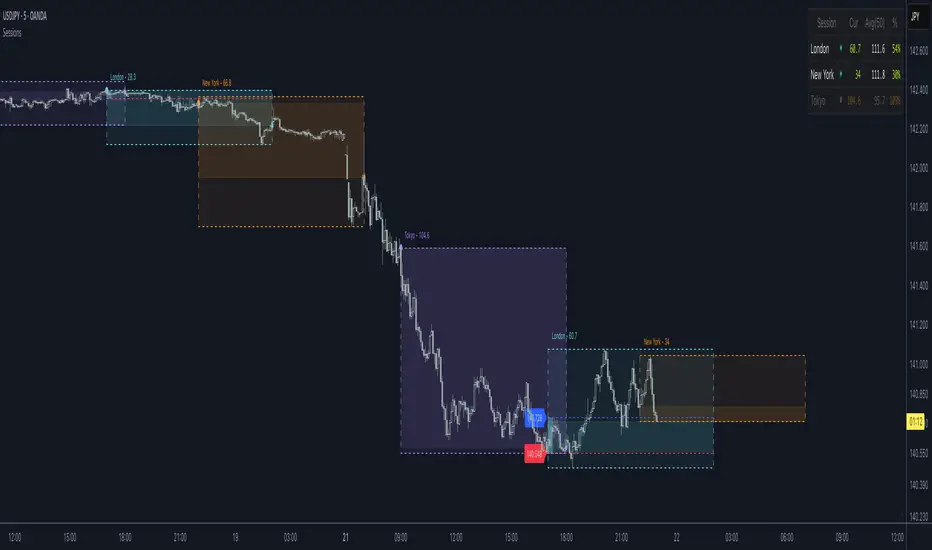
Session LiquidityThe “Session Liquidity” TradingView indicator by Infinity Trading creates dynamic horizontal lines at the high and low points of a specified time span within the trading day. This indicator gives the user control of three separate time spans so the user can dynamically see the highs and lows of their favorite daily time spans.
Purpose
This indicator is similar to my TradingView indicator “Futures Exchange Sessions 3.0”. In that indicator the user gets control of dynamic price boxes. For me, these boxes made it difficult to spot ICT’s Orderblocks. So instead of boxes I made independently controllable lines and now I can spot ICT Orderblocks and easily identify Liquidity Pools.
Inputs and Style
Everything about the three dynamic lines can but independently configured. Start & End Times, Line Color, Line Style, Line Width, Text Characters, Text Size, Text Color can all be adjusted. The high and low lines as well as their text labels can be individually toggled on or off for maximum control.
Timezone
All of the start and end times are in EST. Additionally, each time span line needs a specific start of each day. This is controlled by a setting called “Line Start Day Timezone” where the user sets a timezone that corresponds with the start time. In general if a timespan resides within a particular Session pick the corresponding timezone. If the users line fits in the Asian Session then choose Asia/Shanghai. If the line is within the London Session then choose Europe/London. And the same goes for the New York Session.
Special Notes
If the Line Start Time is within one candle of the Start Day Timezone in the Settings, then the line/box won’t display. So choose the previous timezone
Lines only display when the timeframe is <= 30 minute
Gallery
在腳本中搜尋"sessions"


Market Sessions Day & Candles JRA V2.0Market Sessions Day & Candles JRA V2.0
This indicator will allow you to:
- Create boxes for the Market Hours for:
'♯1 SESSION TOKYO'
'♯2 SESSION LONDON'
'♯3 SESSION NEW YORK'
You will be able to change the Hours depending your TimeFrame
You will be able to extend the boxes for the Market Hours and Have Fibonacci Levels on it.
- With every one of it you can change the style of Box for the Market Hours
- You can show Labels for the Market hours as well other options like Price or Pips
- Show the Candles for the TimeFrames depending your settings
- You can change the Candles settings to be Candle or Bar
- Candle Resolution on Timeframe
-Maximum candles to Display
-Show or Unshown Timeframes Candles
-Change colors on candles
Every option has a Tip to understand the function to it

Tosch Market Sessions (US/GB/JP)Library "Tosch Market Sessions"
Returns if the NYSE, London SE, Tokyo SE are open
@function Returns if the NYSE (US), London SE (GB), Tokyo SE (JP) are open
@returns
bus, bgb, bjp - bool: true if the corresponding exchange is open
count - int: count of how many exchanges are open at the moment
ccolor - color: color that indicates the number of open exchanges
0 => color.black
1 => color.blue
2 => color.orange
3 => color.white
All-In-One Sessions, Weekly, Monday, Previous Highs/LowsWe are forever drawing key levels on our charts with saved drawing templates, but finding the levels, adding the labels, is all tedious stuff. We have indicators, but we have multiple different ones at a time.
What if you could just tick a box on/off?
Well now you can.
This all in one 'levels' indicator is designed to show all the key highs and lows from previous weeks, Monday, the current week, as well as an option to highlight the market sessions and their highs and lows.
There are lots of options available for extending lines and choosing their colors, so once you have set it up how you want, don't forget to save YOUR defaults.
Oorah.

Time Sessions - S/RThis scripts shows you some time sessions such as NY open, NY mid, London Open and Daily Close for UTC - 0
It also plots resistance and support based on the last 15 candles but you can change it in settings.

ICT Sessions (Kill Zones)Inspired by the work of ICT (Inner Circle Trader - @ICT_MHuddleston)
What are ICT KillZones:
All ICT students know that certain moments of the day are more indicated to search for good frameworks. These moments are indicated like "Kill Zones".
The best kill zones to search for profittable tradings are during the London session and during the New York session.
How This Indicator Can Help You:
With this indicator you'll see plotted in the charts the London Kill Zone and the New York Kill Zone, you'll see exactly when they start and finish, so you'll be able to understand better the price action and recognize if there are ICT framework to trade. You'll also will see when the New York lunch hour happen (this moment is not favorable for searching frameworks) and you'll see also 2 very important moments of the day, the 8.30 New York Time and the 9.30 New York Time, infact in these 2 particular moments it is most likely that some very profittable framework will appear as there are alway important economic news released in these 2 hours.
Also you'll see the New York Midnight Open, that always forms a very important level for the day trading, you could see the New York Midnight open as a real opening for markets.
Why This Indicator:
I looked for indicators working with these concepts and I could not find one that offered the kill zones sections in the way are showed in my indicator, also they just had the kill zones without showing the 8.30 and 9.30 hours and without the Ney York midnight opening, and these are very important time frames for who works with ICT concepts.
About The Indicator:
In this indicator you'll have displayed:
The regular trading sessions displayed, that is: Asian Session, London Session, New York Session.
The London Kill Zone
The New York Kill Zone
The New York Midnight Open
The New York Lunch Hour
The 8:30 News Release Hour
The 9:30 News Release Hour
All these level can be adjusted and changed as you prefer.

Market Sessions(4sessions)Special for CLUB SM))) Special for CLUB SM))) Special for CLUB SM))) Special for CLUB SM))) Special for CLUB SM))) Special for CLUB SM))) Special for CLUB SM))) Special for CLUB SM))) Special for CLUB SM))) Special for CLUB SM))) Special for CLUB SM))) Special for CLUB SM))) Special for CLUB SM))) Special for CLUB SM))) Special for CLUB SM))) Special for CLUB SM))) Special for CLUB SM))) Special for CLUB SM))) Special for CLUB SM))) Special for CLUB SM))) Special for CLUB SM))) Special for CLUB SM))) Special for CLUB SM))) Special for CLUB SM))) Special for CLUB SM))) Special for CLUB SM))) Special for CLUB SM))) Special for CLUB SM))) Special for CLUB SM))) Special for CLUB SM))) Special for CLUB SM))) Special for CLUB SM))) Special for CLUB SM))) Special for CLUB SM))) Special for CLUB SM))) Special for CLUB SM))) Special for CLUB SM))) Special for CLUB SM))) Special for CLUB SM))) Special for CLUB SM))) Special for CLUB SM))) Special for CLUB SM))) Special for CLUB SM))) Special for CLUB SM))) Special for CLUB SM))) Special for CLUB SM))) Special for CLUB SM))) Special for CLUB SM))) Special for CLUB SM))) Special for CLUB SM))) Special for CLUB SM))) Special for CLUB SM))) Special for CLUB SM))) Special for CLUB SM))) Special for CLUB SM))) Special for CLUB SM))) Special for CLUB SM))) Special for CLUB SM))) Special for CLUB SM))) Special for CLUB SM))) Special for CLUB SM))) Special for CLUB SM))) Special for CLUB SM))) Special for CLUB SM))) Special for CLUB SM))) Special for CLUB SM))) Special for CLUB SM))) Special for CLUB SM))) Special for CLUB SM))) Special for CLUB SM))) Special for CLUB SM))) Special for CLUB SM))) Special for CLUB SM))) Special for CLUB SM))) Special for CLUB SM))) Special for CLUB SM))) Special for CLUB SM))) Special for CLUB SM))) Special for CLUB SM))) Special for CLUB SM))) Special for CLUB SM))) Special for CLUB SM))) Special for CLUB SM))) Special for CLUB SM))) Special for CLUB SM))) Special for CLUB SM))) Special for CLUB SM))) Special for CLUB SM))) Special for CLUB SM))) Special for CLUB SM))) Special for CLUB SM))) Special for CLUB SM))) Special for CLUB SM))) Special for CLUB SM))) Special for CLUB SM))) Special for CLUB SM))) Special for CLUB SM))) Special for CLUB SM))) Special for CLUB SM))) Special for CLUB SM))) Special for CLUB SM))) Special for CLUB SM))) Special for CLUB SM))) Special for CLUB SM))) Special for CLUB SM))) Special for CLUB SM))) Special for CLUB SM))) Special for CLUB SM))) Special for CLUB SM))) Special for CLUB SM))) Special for CLUB SM))) Special for CLUB SM))) Special for CLUB SM))) Special for CLUB SM))) Special for CLUB SM))) Special for CLUB SM))) Special for CLUB SM))) Special for CLUB SM))) Special for CLUB SM))) Special for CLUB SM))) Special for CLUB SM))) Special for CLUB SM))) Special for CLUB SM))) Special for CLUB SM))) Special for CLUB SM))) Special for CLUB SM))) Special for CLUB SM))) Special for CLUB SM))) Special for CLUB SM))) Special for CLUB SM))) Special for CLUB SM))) Special for CLUB SM))) Special for CLUB SM))) Special for CLUB SM))) Special for CLUB SM))) Special for CLUB SM))) Special for CLUB SM))) Special for CLUB SM))) Special for CLUB SM))) Special for CLUB SM))) Special for CLUB SM))) Special for CLUB SM))) Special for CLUB SM))) Special for CLUB SM))) Special for CLUB SM))) Special for CLUB SM))) Special for CLUB SM))) Special for CLUB SM))) Special for CLUB SM))) Special for CLUB SM))) Special for CLUB SM))) Special for CLUB SM))) Special for CLUB SM))) Special for CLUB SM))) Special for CLUB SM))) Special for CLUB SM))) Special for CLUB SM))) Special for CLUB SM))) Special for CLUB SM))) Special for CLUB SM))) Special for CLUB SM))) Special for CLUB SM))) Special for CLUB SM))) Special for CLUB SM))) Special for CLUB SM))) Special for CLUB SM))) Special for CLUB SM))) Special for CLUB SM))) Special for CLUB SM))) Special for CLUB SM))) Special for CLUB SM))) Special for CLUB SM))) Special for CLUB SM))) Special for CLUB SM))) Special for CLUB SM))) Special for CLUB SM))) Special for CLUB SM))) Special for CLUB SM))) Special for CLUB SM))) Special for CLUB SM))) Special for CLUB SM))) Special for CLUB SM))) Special for CLUB SM))) Special for CLUB SM))) Special for CLUB SM))) Special for CLUB SM))) Special for CLUB SM))) Special for CLUB SM))) Special for CLUB SM))) Special for CLUB SM))) Special for CLUB SM))) Special for CLUB SM))) Special for CLUB SM))) Special for CLUB SM))) Special for CLUB SM))) Special for CLUB SM))) Special for CLUB SM))) Special for CLUB SM))) Special for CLUB SM))) Special for CLUB SM))) Special for CLUB SM))) Special for CLUB SM))) Special for CLUB SM))) Special for CLUB SM))) Special for CLUB SM))) Special for CLUB SM))) Special for CLUB SM))) Special for CLUB SM))) Special for CLUB SM))) Special for CLUB SM))) Special for CLUB SM))) Special for CLUB SM))) Special for CLUB SM))) Special for CLUB SM))) Special for CLUB SM))) Special for CLUB SM))) Special for CLUB SM))) Special for CLUB SM))) Special for CLUB SM))) Special for CLUB SM))) Special for CLUB SM))) Special for CLUB SM))) Special for CLUB SM))) Special for CLUB SM))) Special for CLUB SM))) Special for CLUB SM))) Special for CLUB SM))) Special for CLUB SM))) Special for CLUB SM))) Special for CLUB SM))) Special for CLUB SM))) Special for CLUB SM))) Special for CLUB SM))) Special for CLUB SM))) Special for CLUB SM))) Special for CLUB SM))) Special for CLUB SM))) Special for CLUB SM))) Special for CLUB SM))) Special for CLUB SM))) Special for CLUB SM))) Special for CLUB SM))) Special for CLUB SM))) Special for CLUB SM))) Special for CLUB SM))) Special for CLUB SM))) Special for CLUB SM))) Special for CLUB SM))) Special for CLUB SM))) Special for CLUB SM))) Special for CLUB SM))) Special for CLUB SM))) Special for CLUB SM))) Special for CLUB SM)))

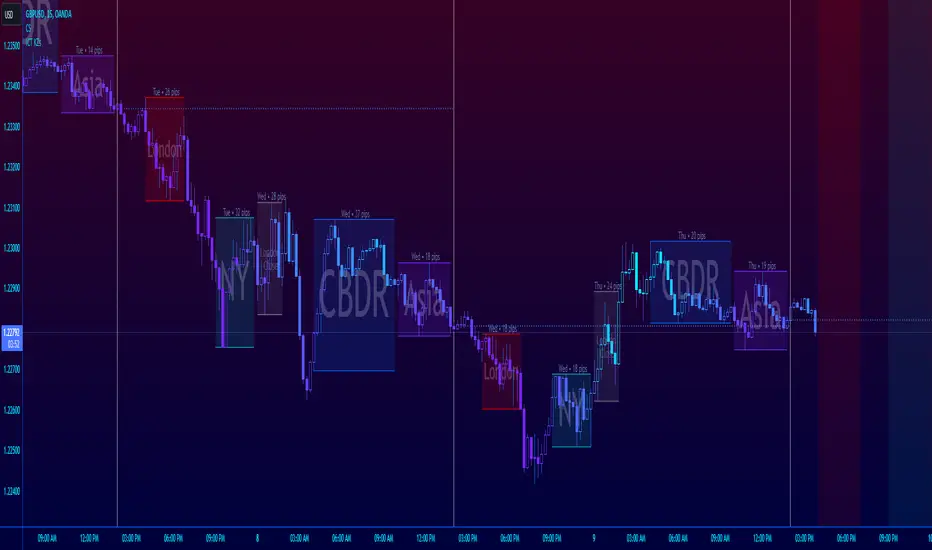
ICT Session Killzone Boxes & DeviationsICT Killzone Sessions Boxes & Deviations is a convenience indicator that marks out past and future ICT killzones for Asia, London, and New York, London Close and CBDR.
The boxes highlights the highest and lowest candle opens of that session/killzone, which is what the deviations are based on. Two lines mark out the highest high and lowest low of that session.
This indicator also includes New York midnight opening price and a vertical divider showing you that time.
Future killzones are also marked out.
All times are set to GMT-4 so these boxes should work across most exchanges. Times and code can be changed if a few don't match up.
Included are week of day labels for your convenience.
For those who are unfamiliar, ICT Killzones are optimal times to look for trades during or before a session, often providing entry for trades with orderblock tests, FVG fills or stophunts.
Please note: This indicator only works well on 1HR timeframe and below. The default max timeframe setting is set to 15min, which can be changed in the menu.
There may be some bugs so please highlight anything you find in the comments below :)
Shout out to @Ryazn for all the ideas!
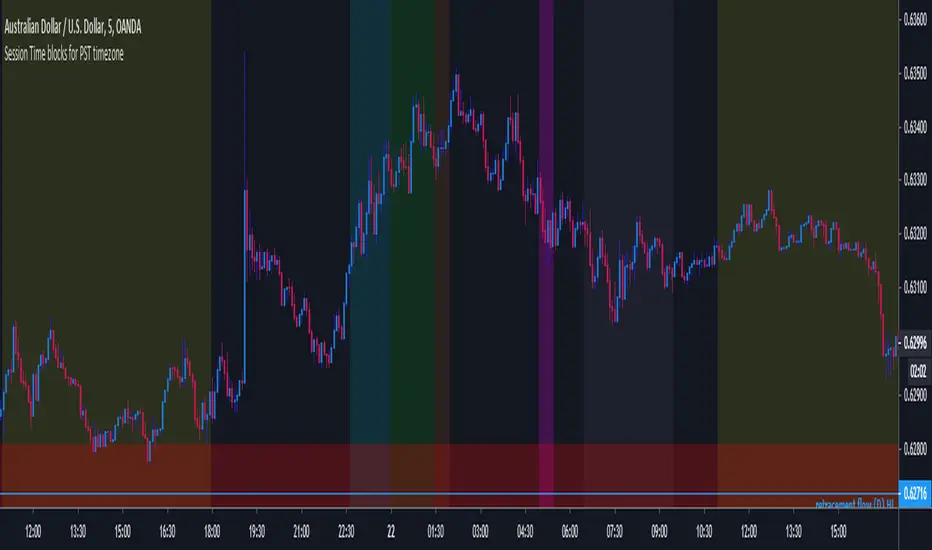
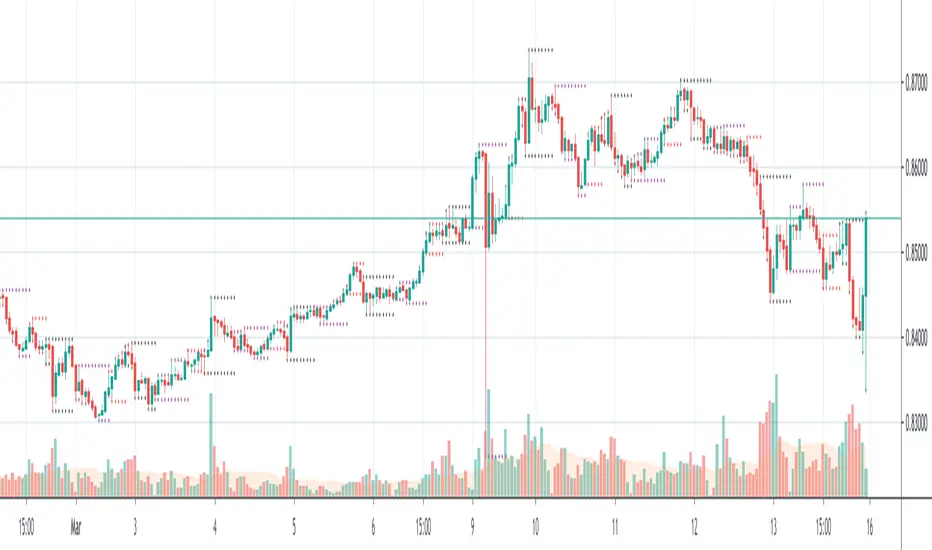
AltSessionHello World
It’s no secret that trading sessions play a massive role in market movement and liquidity. We can clearly see in the image about how important identifying international trading hours are for a trader.
The Asian session starts around 1am GMT and often has a bearish bias through this session lasting for a few hours, after which Frankfurt and London traders start to come online and can often reverse the Asian sentiment.
The London session is the best session to trade traditionally starting around 7am GMT before the American traders come online and reverse market once again.
We have designed this indicator to help identify different trading hours easily with a background shade on the chart and also high/lows of the training session, as these levels can often be revisited.
We hope you find this indicator useful and please feel free to drop a comment if you have any updates you wish to be made or any future indicator script ideas, thank you.

ICT Market SessionsThis indicator highlights sessions, kill-zones and significant time elements on the chart based on ITC's method.
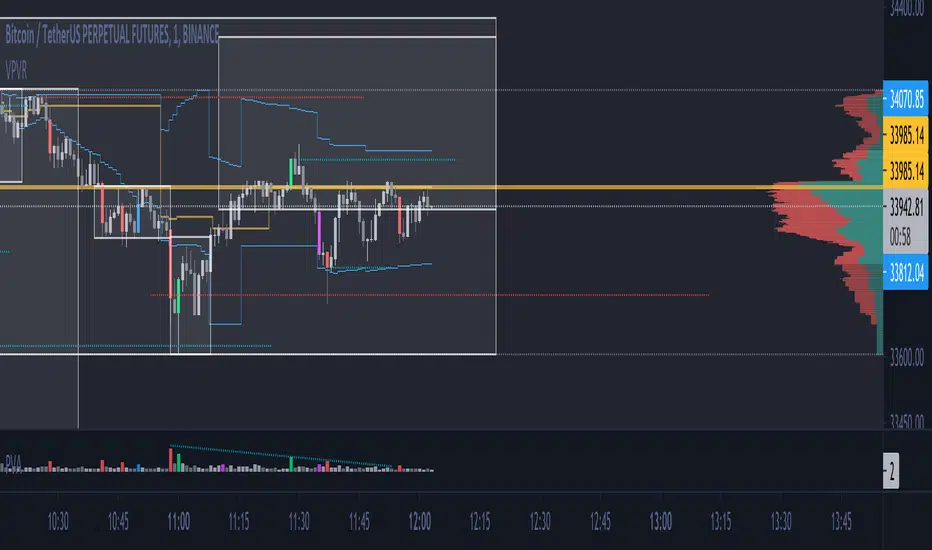
Initial Balance Monitoring PanelInitial Balance Monitoring Panel
Allows you to have an instant view of 16 Crypto pairs within a monitoring panel, monitoring Initial Balance (Asia, London, New York Stock Exchanges).
The code can easily be changed to suit the crypto pairs you are trading.
The setup of my chart would also include this indicator and the " Initial Balance Markets Time Zones - Overall Highest and Lowest " (with all IBs enabled) as shown above.
Initial Balance is based on the highest and lowest price action within the first 60 minutes of trading. Reading online this can depict which way the market can trend for the session.
The indicator has been coded for Crypto (so other symbols may not work as expected).
Though Initial Balance is based off the first 60 minutes of the trading markets opening, but Crypto is 24/7, this indicator looks at how Asia, London and New York Stock Exchanges opening trading can affect Crypto price action.
As the current Market sentiment is bullish if the price action fell below all Initial balances I would be looking at completing Technical Analysis for a long trade and to see if price action can find support from the trading sessions Initial Balance:
Please see below an example of this....
IOTAUSDT signaled red (that it had dropped below all IBs) but then found support and moved on up.
Also a similar example as above for BTCUSDT....
If the signal is green do your technical analysis, but as shown below once the highest Initial Balance has been broken price can increase.
LINKLUSDT
I would like to say thanks to AnyDozer from StackOverFlow for helping me get my idea onto the charts and wugamlo for allowing me to use some of his panel code.

MF Custom Sessions (PST)Public Version - This is a session timing indicator for people in the PST time zone and represents each major session with a different color time block for intraday studies.
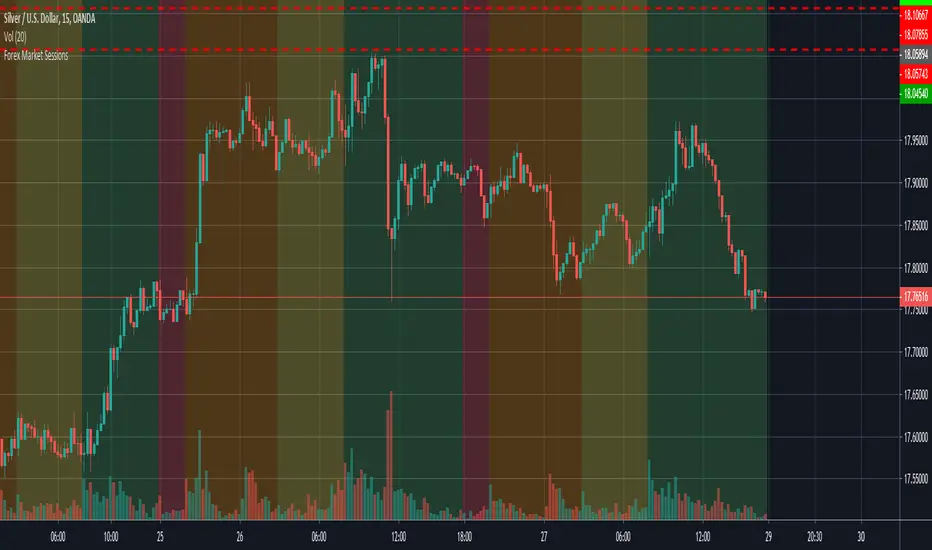
CM_Forex-Sessions-HighLowDay_V1Este indicador presenta las sesiones forex de Asia Londres y Nueva York junto a los altos y bajos del precio durante la jornada, se puede complementar con el indicador CM_Forex-AsiaSession-8H_V1 para ver los segmentos de 8 horas de la sesión de Asia.
This indicator presents the forex sessions of Asia London and New York along with the highs and lows of the price during the day, it can be complemented with the indicator CM_Forex-AsiaSession-8H_V1 to see the 8-hour segments of the Asian session.

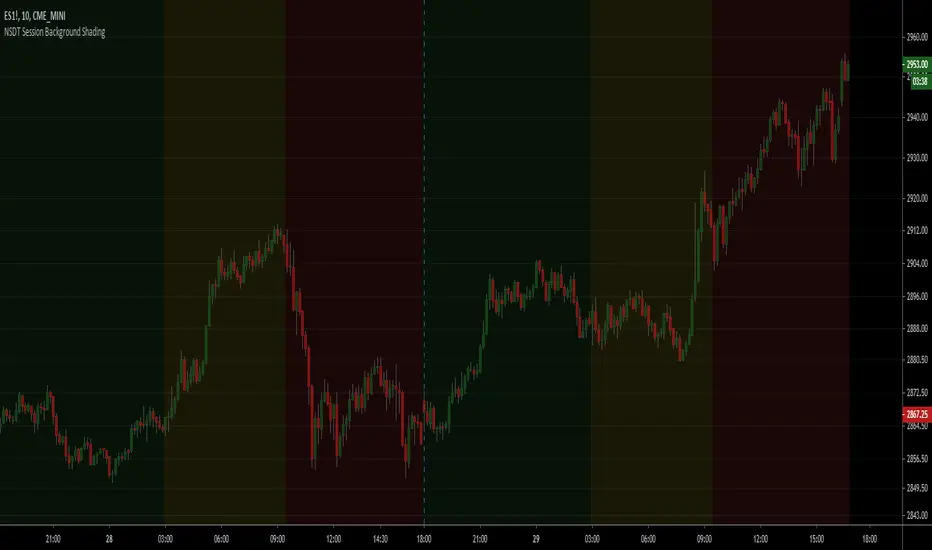
NSDT Session Background ShadingA simple script to add background colors to specific timeframes. Great for trading futures so you can separate sessions for easier viewing. Use for stocks to separate pre, open, and post market times.
There are three timeframes that can be set and all colors can be modified.

Trading Sessions by Aflaq for UF TradersThis indicator is meant for traders under the UF Program who needs a quick way to show multiple sessions high and low
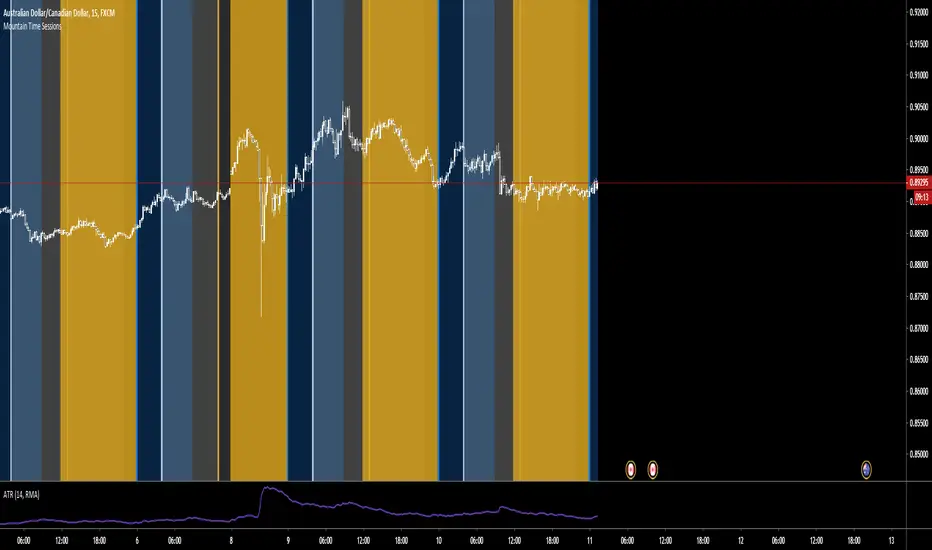
Mountain Time SessionsEdited sessions time zones for people in the Mountain Time Zone. thanks to original creator ChrisMoody.

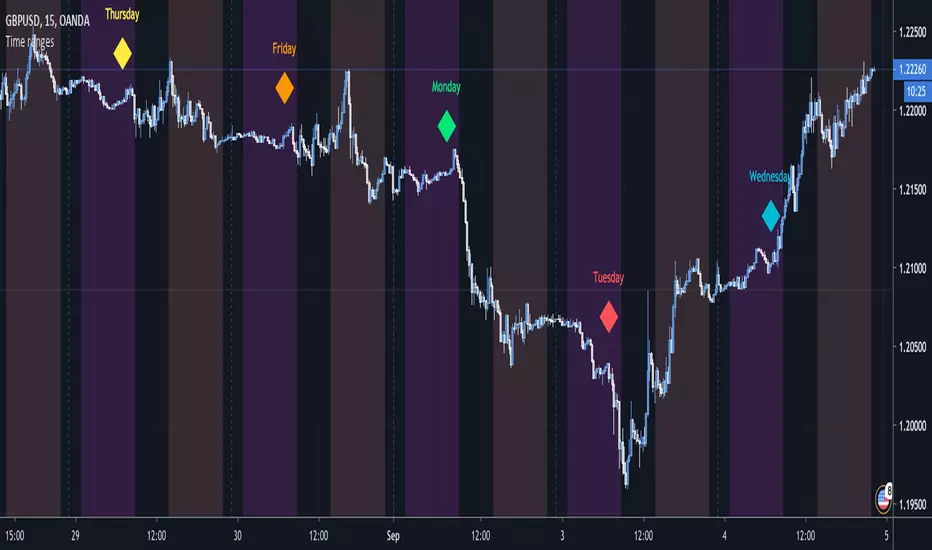
Time rangesThis script visualizes the different time sessions during the day.
The time ranges are set to the default Frankfurt, London, NY, Sydney and Tokyo, but can be
freely modified and turned off (I personally use to display only Tokyo and NY).
If you are a day trader, e.g. you trade with the Market Makers, this tool is a "must have".
It also displays the day of the week, which can be set off as well.
vitelot/yanez/Vts Sept 2019
PS I chose this script to belong to the "volatility" category since it can be used to highlight the Asian session,
and there was no suitable category available.
Fx220 Market Sessions IndicatorFx220 NATION! Welcome. Here's a script to add the Market Sessions without altering any settings! Enjoy - Brian
