Sessions RangesAn indicator that displays each trading session. Each box represents a single session (Asian, London and NY) and their respective overlaps.Pine Script®指標由raudaproductions提供22399
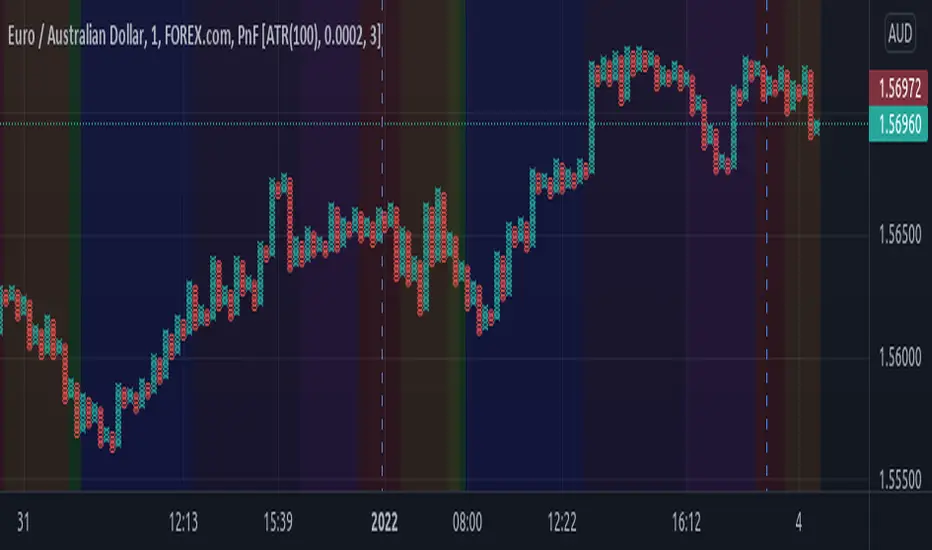
Sessions Rainbow EST with overlapsThis script displays the trading zones with overlaps based on the color of the rainbow. It is used with a Point&Figure chart to show trends associated with trading periods and overlapping trading periods.Pine Script®指標由jlc3fx提供已更新 53
Sessions - London NY overlapOther scripts show London closing at 5pm GMT whereas i believe the forex market on London closes at 4pm GMT. So i have adjusted an already published script to reflect thisPine Script®指標由AHam提供44
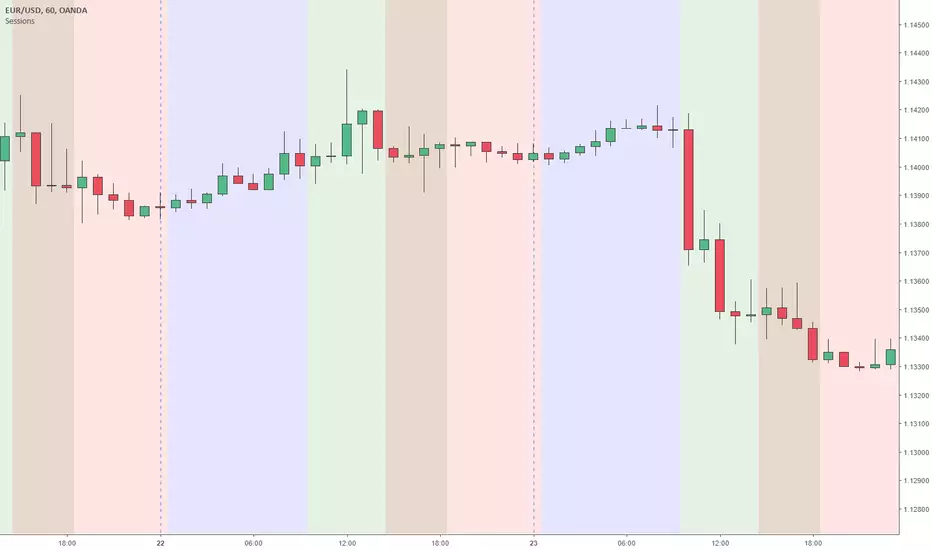
Sessions Asia, London, NY colored USED FOR GMT+2Simple script making easy to see when what session begins also overlaps and ends. This script used for GMT+2 time zone, if you want to edit it just overite script time cycle.Pine Script®指標由vaidas.maldzius1995提供1616 2.8 K
Time Zone PSenseiTitle: Time Zone PS Indicator Author: Orlando Depablos Description: The Time Zone PS Indicator is a tool designed to help traders visualize different trading sessions on their charts. It allows users to specify three different trading sessions: the start of the day, the London session, and the New York (NYC) session. Each session is represented by a distinct color-coded background on the chart. Features: Customizable Sessions: Traders can define the start time and end time for each trading session according to their preference. This flexibility enables users to tailor the indicator to their specific trading strategies session time zones. Session Display Control: Users have the option to choose whether they want to display each trading session on the chart. This feature allows for a clutter-free charting experience, where traders can focus on the sessions relevant to their analysis. Visual Clarity: The indicator uses distinct colors for each trading session, making it easy for traders to differentiate between different time zones. This visual clarity aids in quickly identifying key trading periods throughout the day. How to Use: Setting Up Sessions: Use the input options to define the start and end times for the start of the day, the London session, and the NYC session. Adjust these values based on your trading preferences and time zone. Display Preferences: Toggle the display options to choose which trading sessions you want to visualize on the chart. This allows for a customizable charting experience tailored to your specific needs. Interpreting the Chart: Once configured, the indicator will display color-coded backgrounds on the chart corresponding to the defined trading sessions. Interpret these visual cues to identify key trading periods and plan your trading strategies accordingly. Originality: The Time Zone PS Indicator adds value to the TradingView community by providing traders with a customizable tool to visualize different trading sessions. While similar indicators exist, this script offers flexibility and ease of use, enhancing the charting experience for traders across various time zones. Use Cases: Session-Based Analysis: Traders can use the indicator to analyze price action within specific trading sessions, such as the London or NYC session, to identify potential trading opportunities. Time Zone Adjustment: Traders operating in different time zones can adjust the indicator settings to align with their local trading hours, ensuring accurate visualization of relevant trading sessions. Strategy Development: The indicator can aid in the development of trading strategies that capitalize on price movements during specific trading sessions, helping traders optimize their trading performance. Chart Visualization: The indicator provides a clear and concise visualization of different trading sessions on the chart. Each session is represented by a color-coded background, allowing traders to quickly identify key trading periods and make informed trading decisions.Pine Script®指標由mc_bosc提供已更新 22147
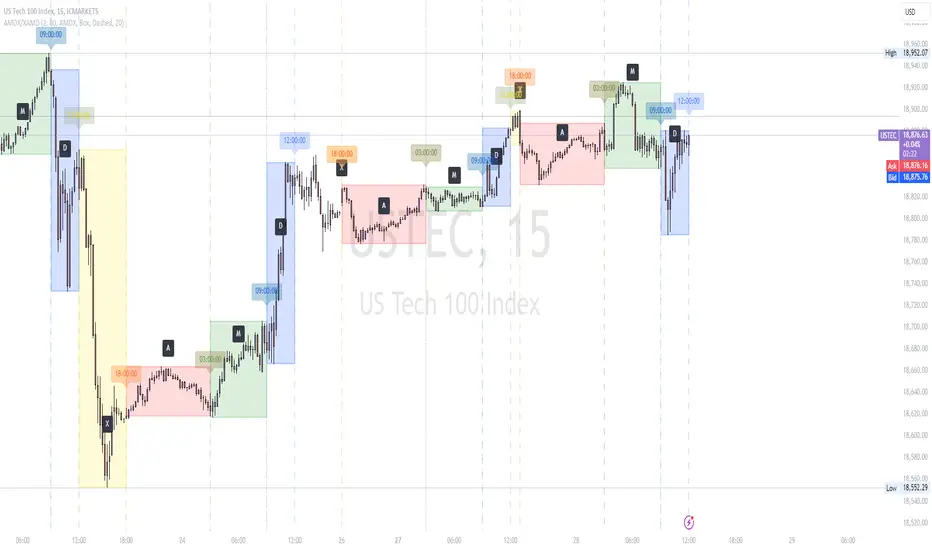
AMDX/XAMD indicatorThe AMDX/XAMD indicator is designed to highlight specific trading sessions on the chart using distinct colors and optional vertical lines. Users can choose between two session types, AMDX or XAMD, and customize the visual appearance of the sessions. This tool is particularly useful for traders who want to analyze market behavior during different trading periods. Meaning of AMDX: A: Accumulation M: Manipulation D: Distribution X: Continuation Or Reversal Features: Session Highlighting: AMDX Sessions: Split into four segments - A, M, D, X. XAMD Sessions: Split into four segments - X, A, M, D. Customizable Colors: Choose individual colors for each session (A, M, D, X). Adjust the transparency of the session boxes for better visual integration with the chart. Drawing Styles: Box Style: Draws colored boxes around the session ranges. Line Style: Draws vertical lines at session start and end times. Vertical Lines: Option to enable or disable vertical lines at session boundaries. Customizable line style: Solid, Dotted, or Dashed. Session Labels: Automatically labels each session for easy identification. Customization Options: Session Type: Select between AMDX and XAMD session types. Colors: Set custom colors for each session and vertical lines. Border Width: Adjust the width of the session box borders. Transparency: Control the transparency level of the session boxes. Drawing Style: Choose between Box and Line styles for session representation. Vertical Lines: Enable or disable vertical lines and select the line style. How It Works: The indicator calculates the start and end times for each session based on the selected session type (AMDX or XAMD). It then draws either boxes or lines to highlight these sessions on the chart. The indicator also includes options to draw vertical lines at the session boundaries and labels each session with a corresponding letter (A, M, D, X). Use Cases: Market Session Analysis: Easily identify and analyze market behavior during different trading sessions. Intraday Trading: Helps intraday traders to focus on specific time segments of the trading day. Visual Segmentation: Provides a clear visual segmentation of the trading day, aiding in better decision-making. Times for AMDX/XAMD session: A Session: 18:00 (previous day) to 03:00 (current day) M Session: 03:00 to 09:00 D Session: 09:00 to 12:00 X Session: 12:00 to 18:00 Time for the XAMD session : X Session: 18:00 (previous day) to 00:00 (current day) A Session: 00:00 to 09:00 M Session: 09:00 to 12:00 D Session: 12:00 to 18:00Pine Script®指標由Noxthinmarket提供已更新 33 1.5 K
Custom V2 KillZone US / FVG / EMAThis indicator is designed for traders looking to analyze liquidity levels, opportunity zones, and the underlying trend across different trading sessions. Inspired by the ICT methodology, this tool combines analysis of Exponential Moving Averages (EMA), session management, and Fair Value Gap (FVG) detection to provide a structured and disciplined approach to trading effectively. Indicator Features Identifying the Underlying Trend with Two EMAs The indicator uses two EMAs on different, customizable timeframes to define the underlying trend: EMA1 (default set to a daily timeframe): Represents the primary underlying trend. EMA2 (default set to a 4-hour timeframe): Helps identify secondary corrections or impulses within the main trend. These two EMAs allow traders to stay aligned with the market trend by prioritizing trades in the direction of the moving averages. For example, if prices are above both EMAs, the trend is bullish, and long trades are favored. Analysis of Market Sessions The indicator divides the day into key trading sessions: Asian Session London Session US Pre-Open Session Liquidity Kill Session US Kill Zone Session Each session is represented by high and low zones as well as mid-lines, allowing traders to visualize liquidity levels reached during these periods. Tracking the price levels in different sessions helps determine whether liquidity levels have been "swept" (taken) or not, which is essential for ICT methodology. Liquidity Signal ("OK" or "STOP") A specific signal appears at the end of the "Liquidity Kill" session (just before the "US Kill Zone" session): "OK" Signal: Indicates that liquidity conditions are favorable for trading the "US Kill Zone" session. This means that liquidity levels have been swept in previous sessions (Asian, London, US Pre-Open), and the market is ready for an opportunity. "STOP" Signal: Indicates that it is not favorable to trade the "US Kill Zone" session, as certain liquidity conditions have not been met. The "OK" or "STOP" signal is based on an analysis of the high and low levels from previous sessions, allowing traders to ensure that significant liquidity zones have been reached before considering positions in the "Kill Zone". Detection of Fair Value Gaps (FVG) in the US Kill Zone Session When an "OK" signal is displayed, the indicator identifies Fair Value Gaps (FVG) during the "US Kill Zone" session. These FVGs are areas where price may return to fill an "imbalance" in the market, making them potential entry points. Bullish FVG: Detected when there is a bullish imbalance, providing a buying opportunity if conditions align with the underlying trend. Bearish FVG: Detected when there is a bearish imbalance, providing a selling opportunity in the trend direction. FVG detection aligns with the ICT Silver Bullet methodology, where these imbalance zones serve as probable entry points during the "US Kill Zone". How to Use This Indicator Check the Underlying Trend Before trading, observe the two EMAs (daily and 4-hour) to understand the general market trend. Trades will be prioritized in the direction indicated by these EMAs. Monitor Liquidity Signals After the Asian, London, and US Pre-Open Sessions The high and low levels of each session help determine if liquidity has already been swept in these areas. At the end of the "Liquidity Kill" session, an "OK" or "STOP" label will appear: "OK" means you can look for trading opportunities in the "US Kill Zone" session. "STOP" means it is preferable not to take trades in the "US Kill Zone" session. Look for Opportunities in the US Kill Zone if the Signal is "OK" When the "OK" label is present, focus on the "US Kill Zone" session. Use the Fair Value Gaps (FVG) as potential entry points for trades based on the ICT methodology. The identified FVGs will appear as colored boxes (bullish or bearish) during this session. Use ICT Methodology to Manage Your Trades Follow the FVGs as potential reversal zones in the direction of the trend, and manage your positions according to your personal strategy and the rules of the ICT Silver Bullet method. Customizable Settings The indicator includes several customization options to suit the trader's preferences: EMA: Length, source (close, open, etc.), and timeframe. Market Sessions: Ability to enable or disable each session, with color and line width settings. Liquidity Signals: Customization of colors for the "OK" and "STOP" labels. FVG: Option to display FVGs or not, with customizable colors for bullish and bearish FVGs, and the number of bars for FVG extension. ------------------------------------------------------------------------------------------------------------- Cet indicateur est conçu pour les traders souhaitant analyser les niveaux de liquidité, les zones d’opportunité, et la tendance de fond à travers différentes sessions de trading. Inspiré de la méthodologie ICT, cet outil combine l'analyse des moyennes mobiles exponentielles (EMA), la gestion des sessions de marché, et la détection des Fair Value Gaps (FVG), afin de fournir une approche structurée et disciplinée pour trader efficacement.Pine Script®指標由LauryGinal提供104
Liquidity Day Series V1 Short Description (English): Automatically tracks Previous Day High (PDH) and Low (PDL) as key institutional liquidity levels with customizable session visualizations and real-time alerts. Full Description (English): Liquidity Day Series V1 is a specialized tool designed to identify critical price action levels used by institutional traders. By focusing on the Previous Day’s High (PDH) and Previous Day’s Low (PDL), this script highlights zones where massive liquidity often rests, leading to significant breakouts or reversals. Key Features: High-Visibility Liquidity Lines: Automatically plots bold, high-contrast lines for daily levels. The thickness and colors are fully customizable to fit any chart theme. Smart Market Sessions: Features integrated background shading for Asia, London, and New York sessions. This helps traders identify market context and volatility windows where liquidity sweeps are most likely to occur. Precision Signals: Includes built-in Buy/Sell signals triggered when the price confirms a breakout above or below the daily liquidity walls. Advanced Alert System: Supports both static alertcondition and dynamic alert() functions, delivering real-time price data notifications directly to your device. How to Use: Monitor the Walls: Watch how price reacts as it approaches the bold PDH (Green) or PDL (Red) lines. Trade the Sessions: Focus on breakouts that occur during the London or New York sessions for higher probability setups. Confirm the Break: Look for the triangle signals which confirm a successful crossover/crossunder of the liquidity levels. Session Visibility: Toggle individual market sessions (Asia/London/NY) to clear chart clutter. Line Styles: Adjust the "Line Thickness" (1-5) for maximum visibility on high-resolution monitors. Data Source: Uses non-repainting request.security with lookahead enabled to ensure levels are plotted correctly from the start of the day. Past performance is not indicative of future results. This script is for educational purposes. Trading involves risk; please use appropriate risk management.Pine Script®指標由GodeyeThelasthope提供20
High Low Levels by JZCustom High Low Levels Indicator - features Clearly plotted high and low levels for specific trading sessions. This indicator provides visual representations of key price levels during various trading periods. Below are the main features and benefits of this indicator: 1. Display high and low levels for each session - previous day high/low: display the high and low from the previous day, giving you a better understanding of how the price moves compared to the prior day. - asia, london, and custom sessions: track the high and low levels for the major trading sessions (asian and london) and two custom user-defined sessions. 2. Complete line and label customization - custom line appearance: choose the color, line style (solid, dashed, dotted), and line thickness for each trading session. you can also decide if the lines should extend beyond the current price action. - custom labels: define your own label texts for each custom session. this way, you can label the levels precisely and easily track price movements. 3. Define your own trading sessions - add up to two custom sessions (custom and custom 2), which can be defined using precise start and end times (hour and minute). - each custom session allows you to specify the label text for the high and low levels, enabling you to easily differentiate different parts of the day on the chart. 4. Clear and intuitive design - grouped settings: all settings are grouped based on trading sessions, so you can easily customize every aspect of the visual representation. - simple toggle on/off: you can easily enable or disable each line (previous day, asia, london, custom 1, custom 2). this allows you to keep your chart clean and focus only on the important levels you need at any moment. 5. Flexible time zones - time zone settings: set the time zone (utc, europe/london, america/new_york, asia/tokyo) to properly align the timeframes for each level depending on the market you're focusing on. 6. Automatic cleanup of old lines and labels - old levels removal: automatically remove old lines and labels to prevent clutter on your chart. this ensures that only current, relevant levels for each trading day or session are displayed. 7. Precise plotting and line extension - accurate level markings: the indicator calculates the precise times when the high and low levels were reached and plots lines that visually represent these levels. - line extension options: you have the option to extend the high/low lines beyond their point of calculation, which helps with identifying price action trends beyond the current period. Dec 7, 2024 Release Notes Changes and Improvements for Users: 1. Customizable Offset for Lines and Labels: - A new input, `Line and Label Offset`, allows users to control how far the lines and their associated text labels extend. This ensures the labels and lines remain aligned and can be adjusted as needed. 2. Unified Offset Control: - The same offset value is applied to all types of lines and labels (e.g., Previous Day High/Low, Asia High/Low, London High/Low, and custom sessions). Users can change this in one place to affect the entire script consistently. 3. Enhanced Flexibility: - Users now have more control over the appearance and position of their lines and labels, making the indicator adaptable to different chart setups and personal preferences. These updates aim to enhance user convenience and customization, ensuring a more tailored charting experience.Pine Script®指標由JanZhor提供13
Volume Profile [Makit0]VOLUME PROFILE INDICATOR v0.5 beta Volume Profile is suitable for day and swing trading on stock and futures markets, is a volume based indicator that gives you 6 key values for each session: POC, VAH, VAL, profile HIGH, LOW and MID levels. This project was born on the idea of plotting the RTH sessions Value Areas for /ES in an automated way, but you can select between 3 different sessions: RTH, GLOBEX and FULL sessions. Some basic concepts: - Volume Profile calculates the total volume for the session at each price level and give us market generated information about what price and range of prices are the most traded (where the value is) - Value Area (VA): range of prices where 70% of the session volume is traded - Value Area High (VAH): highest price within VA - Value Area Low (VAL): lowest price within VA - Point of Control (POC): the most traded price of the session (with the most volume) - Session HIGH, LOW and MID levels are also important There are a huge amount of things to know of Market Profile and Auction Theory like types of days, types of openings, relationships between value areas and openings... for those interested Jim Dalton's work is the way to come I'm in my 2nd trading year and my goal for this year is learning to daytrade the futures markets thru the lens of Market Profile For info on Volume Profile: TV Volume Profile wiki page at www.tradingview.com For info on Market Profile and Market Auction Theory: Jim Dalton's book Mind over markets (this is a MUST) BE AWARE: this indicator is based on the current chart's time interval and it only plots on 1, 2, 3, 5, 10, 15 and 30 minutes charts. This is the correlation table TV uses in the Volume Profile Session Volume indicator (from the wiki above) Chart Indicator 1 - 5 1 6 - 15 5 16 - 30 10 31 - 60 15 61 - 120 30 121 - 1D 60 This indicator doesn't follow that correlation, it doesn't get the volume data from a lower timeframe, it gets the data from the current chart resolution. FEATURES - 6 key values for each session: POC (solid yellow), VAH (solid red), VAL (solid green), profile HIGH (dashed silver), LOW (dashed silver) and MID (dotted silver) levels - 3 sessions to choose for: RTH, GLOBEX and FULL - select the numbers of sessions to plot by adding 12 hours periods back in time - show/hide POC - show/hide VAH & VAL - show/hide session HIGH, LOW & MID levels - highlight the periods of time out of the session (silver) - extend the plotted lines all the way to the right, be careful this can turn the chart unreadable if there are a lot of sessions and lines plotted SETTINGS - Session: select between RTH (8:30 to 15:15 CT), GLOBEX (17:00 to 8:30 CT) and FULL (17:00 to 15:15 CT) sessions. RTH by default - Last 12 hour periods to show: select the deph of the study by adding periods, for example, 60 periods are 30 natural days and around 22 trading days. 1 period by default - Show POC (Point of Control): show/hide POC line. true by default - Show VA (Value Area High & Low): show/hide VAH & VAL lines. true by default - Show Range (Session High, Low & Mid): show/hide session HIGH, LOW & MID lines. true by default - Highlight out of session: show/hide a silver shadow over the non session periods. true by default - Extension: Extend all the plotted lines to the right. false by default HOW TO SETUP BE AWARE THIS INDICATOR PLOTS ONLY IN THE FOLLOWING CHART RESOLUTIONS: 1, 2, 3, 5, 10, 15 AND 30 MINUTES CHARTS. YOU MUST SELECT ONE OF THIS RESOLUTIONS TO THE INDICATOR BE ABLE TO PLOT - By default this indicator plots all the levels for the last RTH session within the last 12 hours, if there is no plot try to adjust the 12 hours periods until the seesion and the periods match - For Globex/Full sessions just select what you want from the dropdown menu and adjust the periods to plot the values - Show or hide the levels you want with the 3 groups: POC line, VA lines and Session Range lines - The highlight and extension options are for a better visibility of the levels as POC or VAH/VAL THANKS TO @watsonexchange for all the help, ideas and insights on this and the last two indicators (Market Delta & Market Internals) I'm working on my way to a 'clean chart' but for me it's not an easy path @PineCoders for all the amazing stuff they do and all the help and tools they provide, in special the Script-Stopwatch at that was key in lowering this indicator's execution time All the TV and Pine community, open source and shared knowledge are indeed the best way to help each other IF YOU REALLY LIKE THIS WORK, please send me a comment or a private message and TELL ME WHAT you trade, HOW you trade it and your FAVOURITE SETUP for pulling out money from the market in a consistent basis, I'm learning to trade (this is my 2nd year) and I need all the help I can get GOOD LUCK AND HAPPY TRADINGPine Script®指標由makit0提供已更新 6565 4.7 K
[Statistics] killzone SFPSFP Statistics (ICT Sessions) This indicator automatically finds and draws the high and low of the Asia, London, and New York trading sessions. It then hunts for Swing Failure Patterns (SFPs) that sweep these key session levels. The main purpose of this script is to gather statistics on when these high-probability SFPs occur, allowing you to map out and identify the times of day when they are most frequent. How to Use This Indicator Set Your SFP Timeframe: In the settings, choose the timeframe you want to hunt for SFPs on (e.g., 1H, 15m). Important: You must also set your main chart to this exact same timeframe for the statistics to be collected correctly. Define Your Sessions: Go to the "Session Definitions" tab. Set the Global Timezone to your preferred trading timezone (e.g., "America/New_York"). This controls all session times and table times. Adjust the start and end times for Asia, London, and NY AM sessions. You can turn off sessions you don't want to track (like NY Lunch or NY PM). You can also change the colors and text style for the session boxes here. Set Confirmation Bars: In "SFP Engine Settings," the "Confirmation Bars" (default is 2) defines how many bars must close after the SFP bar without invalidating the level. An SFP is only "confirmed" and drawn after this period. 0 = Confirms immediately on the SFP candle's close. 2 = Confirms 2 bars after the SFP candle's close. Read the Statistics: The "Custom SFP Statistics" table will appear on your chart. This table logs every confirmed SFP and tells you: Which time of day they happen most. How many were Bearish (swept a high) vs. Bullish (swept a low). It's set by default to show the "Top 20" most frequent times, sorted chronologically. Filter Your Chart (Optional): If your chart feels cluttered, go to "Visual Time Filter" and turn it ON. Set a time window (e.g., "09:30-11:00"). The indicator will now only draw SFP signals that occurred within that specific time window. This is perfect for focusing on a single killzone. How to Set Up Alerts You can set up server-side alerts to be notified every time a new SFP is confirmed. Check the "Enable SFP Alerts" box at the top of the indicator's settings. Click the "Alert" button (alarm clock icon) on the TradingView toolbar. In the "Condition" dropdown, select "SFP Statistics (ICT Sessions)". In the second dropdown, choose "Any alert() function call". Most Important Step: In the "Message" box, delete any default text and type in this exact placeholder: {{alert_message}} Set the trigger to "Once Per Bar Close". Click "Create". How Alerts Work (Triggers & Filtering) Trigger: Alerts are tied to the confirmed signal. An alert will only fire after your "Confirmation Bars" have passed and the SFP is locked in. This prevents you from getting alerts on fake-outs. Alert Filtering: The alerts are linked to the "Visual Time Filter". If you turn on the Visual Time Filter (e.g., to 09:30-11:00), you will only receive alerts for SFPs that are confirmed within that time window. If an SFP happens at 14:00, the script will ignore it, it will not be drawn, and it will not send you an alert. This allows you to get alerts only for the session you are actively trading. Note: This is a first draft of this indicator. I will continue to work on it and improve it over time, as it may still contain small bugs. Acknowledgements: A big thank you to TFO (tradeforopp). The session detection logic and the visual style for the session boxes were adapted from his excellent "ICT Killzones & Pivots " indicator.Pine Script®指標由nickbonenkamp提供已更新 1158
ICT Kill Zones PanelICT Kill Zones Panel - Clean & Simple Trading Sessions Indicator A simple, objective indicator to identify ICT Kill Zones with real-time status and smart visual highlighting based on New York timezone. WHAT MAKES IT DIFFERENT: Traditional indicators clutter charts with dozens of colored boxes from past sessions. This tool provides a clean alternative: - Real-time information panel showing current active session - Smart dual-transparency painting: ACTIVE session displays stronger (more visible), historical sessions display softer (less clutter) - Accurate session timing: Only shows active when session is actually happening - Mobile-optimized size for phone trading - Professional interface that doesn't interfere with price action FEATURES: - Real-Time Detection: Panel uses actual NYC time (timenow) to show which session is active NOW - Precise Timing: Sessions activate ONLY during their specific time windows - all zones show inactive outside trading hours - Smart Visual System: Currently active session has stronger background color, past sessions are softer - Color Synchronization: Active session color in panel matches chart background color automatically - Clean Highlighting: Optional background painting with adjustable transparency levels - Full Customization: 9 panel positions, 4 sizes (Mobile/Small/Normal/Large), fully customizable colors - All Sessions: Asian (20:00-01:00), London (02:00-05:00), NY AM (08:00-11:00), London Close (10:00-12:00), NY PM (13:00-16:00) KILL ZONE SCHEDULE (NYC TIME): 1. Asian: 20:00 - 01:00 (5 hours) 2. INACTIVE: 01:00 - 02:00 3. London: 02:00 - 05:00 (3 hours) 4. INACTIVE: 05:00 - 08:00 5. NY AM: 08:00 - 11:00 (3 hours) - overlaps with London Close 6. London Close: 10:00 - 12:00 (2 hours) - overlaps with NY AM 7. INACTIVE: 12:00 - 13:00 8. NY PM: 13:00 - 16:00 (3 hours) 9. INACTIVE: 16:00 - 20:00 During INACTIVE periods, all sessions show as inactive in the panel. COLOR SYSTEM: ALL COLORS ARE FULLY CUSTOMIZABLE: - Each Kill Zone has its own color setting (Asian, London, NY AM, London Close, NY PM) - Default colors shown in screenshots are just examples - Active session in panel: displays with its assigned color (e.g., green for NY AM by default) - Same color appears on chart background with adjustable transparency - Inactive sessions in panel: display with gray (also customizable) - Panel background and text colors: fully customizable - Choose colors that match your chart theme The green color shown for active sessions in examples is the DEFAULT color for NY AM - you can change it to any color you prefer. TRANSPARENCY SYSTEM EXPLAINED: ACTIVE SESSION (happening right now): - Default 70% transparency = STRONGER/MORE VISIBLE background - Instantly shows which Kill Zone is unfolding - Panel row highlights with the session's assigned color - Chart background displays same color stronger HISTORICAL SESSIONS (already passed): - Default 90% transparency = SOFTER/LESS VISIBLE background - Provides context without visual clutter - Panel rows show gray (inactive color) - Both transparency levels fully adjustable in settings MOBILE OPTIMIZED: Select "Mobile" panel size for optimal viewing on phone screens - compact layout perfect for smaller displays. REPAINTING BEHAVIOR: Panel Status & Colors: Update in real-time as sessions change - panel color switches to match the new active session (intentional for current awareness) Active Session Highlighting: Adjusts in real-time to show current session stronger on chart Historical Background Colors: Do NOT repaint - accurately mark when sessions occurred Session Activation: Sessions activate and deactivate precisely at their scheduled times CUSTOMIZATION: - Panel: 9 positions, 4 sizes including Mobile - Colors: Individual customizable color for each Kill Zone - Panel Colors: Customizable background, text, and inactive zone colors - Transparency: Separate controls for active (default 70%) and historical (default 90%) sessions - Toggle: Show/hide individual zones - Chart Painting: On/off HOW TO USE: 1. Add to chart - panel appears top-right 2. Active session displays with its assigned color in panel and stronger on chart 3. Panel shows all zones as inactive during non-trading hours (accurate timing) 4. Panel color automatically changes when new session begins 5. Adjust all colors in settings to match your preferences 6. Adjust transparency settings for optimal visibility 7. Use "Mobile" size for phone trading BEST FOR: - ICT traders timing entries during high-liquidity periods - Smart money concepts (FVG, Order Blocks, Liquidity) - Traders who want clean charts with essential information - Traders needing accurate session timing without false signals - Mobile traders needing compact, clear displays - Traders who want to customize colors to match their chart theme TECHNICAL: - Works on all timeframes - Built with Pine Script v6 - NYC timezone with automatic DST adjustment - Precise hour-based session detection - Lightweight and optimized - Open source FEEDBACK WELCOME: All comments, critiques, and suggestions are welcome! Your input helps improve this tool for the trading community. Created by ivrank13 for traders who value simplicity, accuracy, and clean charts. © 2026 ivrank13. All Rights Reserved. #ICT #KillZones #SmartMoney #ForexSessions #CleanCharts #MobileTrading #CustomColors #AccurateTimingPine Script®指標由ivrank13提供7
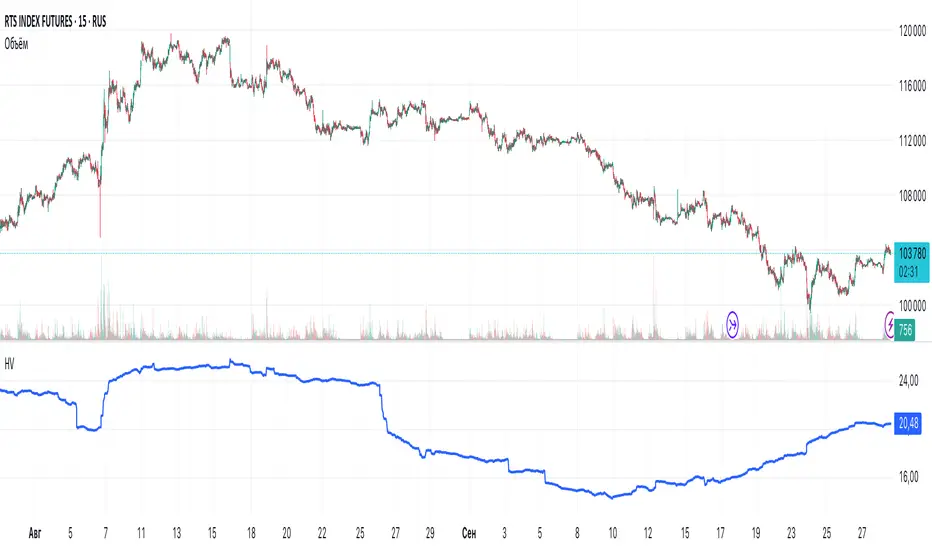
Historical VolatilityHistorical Volatility Indicator with Custom Trading Sessions Overview This indicator calculates **annualized Historical Volatility (HV)** using logarithmic returns and standard deviation. Unlike standard HV indicators, this version allows you to **customize trading sessions and holidays** for different markets, ensuring accurate volatility calculations for options pricing and risk management. Key Features ✅ Custom Trading Sessions - Define multiple trading sessions per day with precise start/end times ✅ Multiple Markets Support - Pre-configured for US, Russian, European, and crypto markets ✅ Clearing Periods Handling - Account for intraday clearing breaks ✅ Flexible Calendar - Set trading days per year for different countries ✅ All Timeframes - Works correctly on intraday, daily, weekly, and monthly charts ✅ Info Table - Optional display showing calculation parameters How It Works The indicator uses the classical volatility formula: σ_annual = σ_period × √(periods per year) Where: - σ_period = Standard deviation of logarithmic returns over the specified period - Periods per year = Calculated based on actual trading time (not calendar time) Calculation Method 1. Computes log returns: ln(close / close ) 2. Calculates standard deviation over the lookback period 3. Annualizes using the square root rule with accurate period count 4. Displays as percentage Settings Calculation - Period (default: 10) - Lookback period for volatility calculation Trading Schedule - Trading Days Per Year (default: 252) - Number of actual trading days - USA: 252 - Russia: 247-250 - Europe: 250-253 - Crypto (24/7): 365 - Trading Sessions - Define trading hours in format: `hh:mm:ss-hh:mm:ss, hh:mm:ss-hh:mm:ss` Display - Show Info Table - Shows calculation parameters in real-time Market Presets United States (NYSE/NASDAQ) Trading Sessions: 09:30:00-16:00:00 Trading Days Per Year: 252 Trading Minutes Per Day: 390 Russia (MOEX) Trading Sessions: 10:00:00-14:00:00, 14:05:00-18:40:00 Trading Days Per Year: 248 Trading Minutes Per Day: 515 Europe (LSE) Trading Sessions: 08:00:00-16:30:00 Trading Days Per Year: 252 Trading Minutes Per Day: 510 Germany (XETRA) Trading Sessions: 09:00:00-17:30:00 Trading Days Per Year: 252 Trading Minutes Per Day: 510 Cryptocurrency (24/7) Trading Sessions: 00:00:00-23:59:59 Trading Days Per Year: 365 Trading Minutes Per Day: 1440 Use Cases Options Trading - Compare HV vs IV - Historical volatility compared to implied volatility helps identify mispriced options - Volatility mean reversion - Identify when volatility is unusually high or low - Straddle/strangle selection - Choose optimal strikes based on historical movement Risk Management - Position sizing - Adjust position size based on current volatility - Stop-loss placement - Set stops based on expected price movement - Portfolio volatility - Monitor individual asset volatility contribution Market Analysis - Regime identification - Detect transitions between low and high volatility environments - Cross-market comparison - Compare volatility across different assets and markets Why Accurate Trading Hours Matter Standard HV indicators assume 24-hour trading or use simplified day counts, leading to significant errors in annualized volatility: - 5-minute chart error : Can be off by 50%+ if using wrong period count - Options pricing impact : Even 2-3% HV error affects option values substantially - Intraday vs overnight : Correctly excludes non-trading periods This indicator ensures your HV calculations match the methodology used in professional options pricing models. Technical Notes - Uses actual trading minutes, not calendar days - Handles multiple clearing periods within a single trading day - Properly scales volatility across all timeframes - Logarithmic returns for more accurate volatility measurement - Compatible with Pine Script v6 Author Notes: This indicator was designed specifically for options traders who need precise volatility measurements across different global markets. The customizable trading sessions ensure your HV calculations align with actual market hours and industry-standard options pricing models.Pine Script®指標由kni85提供1
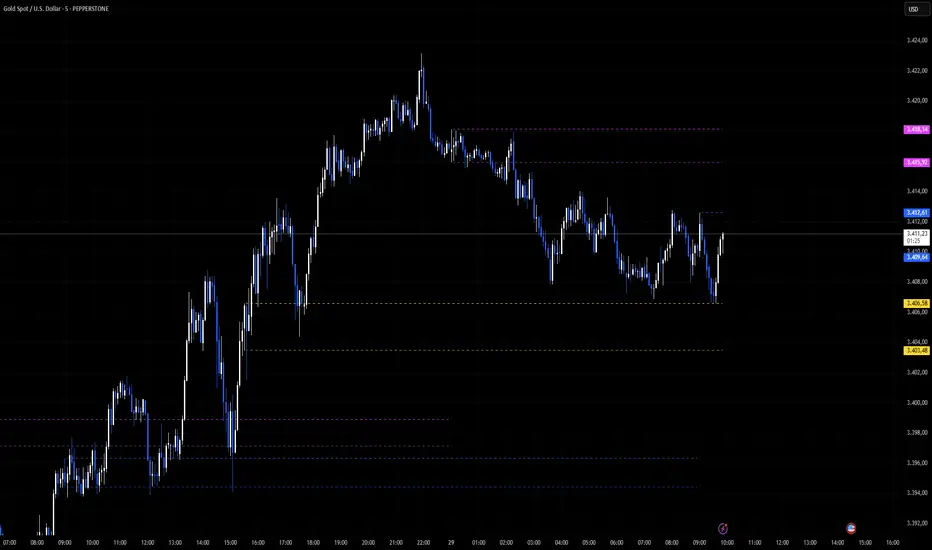
TRIZONACCI_Mean reversal_signalsMarket State Engine Deterministic Confidence-Scoring System for TradingView A professional-grade PineScript v5 indicator that scores market conditions from 0-100, helping traders identify high-quality trading opportunities through systematic structure analysis, VWAP positioning, order flow dynamics, and time-based context. 🎯 Overview The Market State Engine is not a trading bot—it's a noise-reduction and opportunity-ranking system designed to filter market conditions and surface only the highest-quality setups. Instead of blindly taking every signal, this indicator: ✅ Scores market conditions objectively (0-100 scale) ✅ Filters out low-probability setups automatically ✅ Classifies opportunities into A, A+, and A++ grades ✅ Alerts only on confirmed structure shifts with supporting context ✅ Keeps the human in control - provides intelligence, not automation Philosophy: Reduce Noise. Enforce Discipline. Surface Quality. 🚀 Key Features Deterministic Scoring - No black boxes, fully explainable logic Multi-Factor Analysis - Combines 4 independent market state components Structure-First Approach - Only alerts on confirmed pivot breaks VWAP Mean Reversion Logic - Directional filtering based on VWAP zones Order Flow Proxy - CVD divergence and confirmation detection Session-Aware Scoring - Prioritizes high-volume New York sessions Alert De-Duplication - One alert per unique structure shift Zero Repainting - Uses confirmed pivots only (left=2, right=2) Fully Configurable - All parameters exposed as inputs Visual Feedback - VWAP bands, setup labels, and real-time score panel 📊 Scoring System (0-100) The Market State Engine evaluates four independent components, each contributing up to 25 points for a maximum total score of 100. 🎯 Component Breakdown Component Max Points Description VWAP Context 25 Measures price deviation from session VWAP Structure Shift 25 Confirms pivot breakout (HARD GATE) CVD Alignment 25 Detects order flow divergence/confirmation Time-of-Day 25 Identifies high-probability trading sessions 1️⃣ VWAP Context (Max 25 Points) Purpose: Identifies extreme price deviations from fair value for mean-reversion opportunities. VWAP (Volume-Weighted Average Price) is calculated session-anchored to New York market time, with standard deviation bands creating zones of opportunity. Band Structure: 1st Band: ±1σ from VWAP (fair value zone) 2nd Band: ±2σ from VWAP (moderate deviation) 3rd Band: ±3σ from VWAP (extreme deviation) Scoring Logic (Exclusive): Price in 3rd VWAP Band (>2σ and ≤3σ) → +25 points Price in 2nd VWAP Band (>1σ and ≤2σ) → +15 points Otherwise (inside 1σ or beyond 3σ) → 0 points Key Insight: The further price stretches from VWAP, the higher the probability of mean reversion. 2️⃣ Structure Shift (Max 25 Points) — HARD GATE Purpose: Confirms momentum shift through confirmed pivot breakouts. ⚠️ CRITICAL: Structure shift is mandatory. If no valid structure shift occurs, the total score becomes 0 regardless of other factors. Detection Method: Uses TradingView's ta.pivothigh() and ta.pivotlow() functions with locked parameters: Left bars: 2 Right bars: 2 Source: Configurable (Wick or Body) Break confirmation: Candle close only Bullish Structure Shift: ✅ Prior swing high exists (confirmed pivot) ✅ Current candle closes above swing high + tick buffer ✅ Must occur in VWAP 2nd or 3rd band ✅ VWAP Filter: Price must be at or below VWAP (lower bands) Bearish Structure Shift: ✅ Prior swing low exists (confirmed pivot) ✅ Current candle closes below swing low - tick buffer ✅ Must occur in VWAP 2nd or 3rd band ✅ VWAP Filter: Price must be at or above VWAP (upper bands) Scoring: Valid structure shift → +25 points No structure shift → Total score = 0 Tick Buffer: Default 5 ticks (configurable) - prevents false breaks from minor price noise. 3️⃣ CVD Alignment (Max 25 Points) Purpose: Detects institutional order flow through volume delta analysis. CVD (Cumulative Volume Delta) is a proxy for order flow: Close > Open → +Volume (buying pressure) Close < Open → -Volume (selling pressure) Scoring Logic: Condition Points Description Divergence +25 Price makes higher high + CVD makes lower high (bearish) Price makes lower low + CVD makes higher low (bullish) Confirmation +20 Price and CVD both make higher highs or lower lows Neutral 0 No clear divergence or confirmation Lookback Window: Last 20 bars (configurable) - prevents stale divergences. Key Insight: Divergences suggest weakening momentum, while confirmations validate the trend. 4️⃣ Time-of-Day Context (Max 25 Points) Purpose: Prioritizes high-volume, high-volatility New York sessions. Scored Sessions (America/New_York timezone): Session Time Range (NY) Points Description Pre-Market 03:00 - 04:00 +25 Early liquidity injection Market Open 09:30 - 11:30 +25 Highest volume period Off-Hours All other times 0 Lower probability setups Key Insight: Structure shifts during active sessions have higher follow-through probability. 🏆 Setup Classification Setups are graded based on total score thresholds (configurable): Grade Score Range Typical Components Quality Level A++ Setup ≥90 All 4 factors aligned (VWAP 3rd band + Structure + CVD + Session) Premium - Rare A+ Setup ≥75 Structure + VWAP + CVD or Session (3 of 4 factors) High - Select A Setup ≥60 Structure + VWAP + Session (Minimum viable setup) Good - Regular No Grade <60 Insufficient confluence Filtered out Default Thresholds: A Setup: 60 points A+ Setup: 75 points A++ Setup: 90 points 📥 Installation Step 1: Download the Indicator Download the market_state_engine.pine file from this repository. Step 2: Add to TradingView Open TradingView Open the Pine Editor (bottom panel) Click "New" → "Blank indicator" Delete all default code Paste the contents of market_state_engine.pine Click "Add to Chart" Step 3: Configure for Your Symbol Click the gear icon next to the indicator name Adjust Tick Size for your instrument: ES futures: 0.25 NQ futures: 0.25 Stocks: 0.01 Save settings ⚙️ Configuration Symbol Settings Parameter Default Description Tick Size 0.25 Minimum price movement for your symbol Tick Buffer Count 5 Ticks beyond swing for valid break VWAP Settings Parameter Default Description VWAP Band 1 (σ) 1.0 1st standard deviation multiplier VWAP Band 2 (σ) 2.0 2nd standard deviation multiplier VWAP Band 3 (σ) 3.0 3rd standard deviation multiplier Session Settings Parameter Default Description Session 1 0300-0400 Pre-market window (NY time) Session 2 0930-1130 Market open window (NY time) Score Thresholds Parameter Default Description A Setup Threshold 60 Minimum score for A grade A+ Setup Threshold 75 Minimum score for A+ grade A++ Setup Threshold 90 Minimum score for A++ grade CVD Settings Parameter Default Description CVD Divergence Lookback 20 Maximum bars for divergence detection Swing Settings Parameter Default Options Description Swing Detection Method Wick Wick / Body Use high/low or open/close for pivots Visual Settings Parameter Default Description Show VWAP Bands ✅ Display VWAP and standard deviation bands Show Setup Labels ✅ Display setup markers on chart Show Score Panel ✅ Display real-time score breakdown 📖 How to Use Step 1: Apply to 1-Minute Chart ⚠️ The indicator is locked to 1-minute timeframe - do not use on other timeframes. Step 2: Understand the Visual Signals Setup Labels Green Triangle (▲) - Bullish (Long) setup detected Red Triangle (▼) - Bearish (Short) setup detected Label shows Grade (A/A+/A++) and Total Score VWAP Bands Yellow Line - Session VWAP (fair value) Blue Bands - ±1σ (fair value zone) Purple Bands - ±2σ (moderate deviation) Red Bands - ±3σ (extreme deviation) Score Panel (Top Right) Real-time breakdown of all four components: Component Score VWAP Zone 15/25 Structure 25/25 CVD 20/25 Session 25/25 TOTAL 85/100 (A+) Step 3: Interpret Signals Valid Long Setup: ✅ Green triangle below candle ✅ Price in lower VWAP bands (below VWAP) ✅ Structure shift breaks swing high ✅ Score ≥60 Valid Short Setup: ✅ Red triangle above candle ✅ Price in upper VWAP bands (above VWAP) ✅ Structure shift breaks swing low ✅ Score ≥60 Step 4: Set Up Alerts (See Alert Conditions section) 🚦 Signal Filters (VWAP Zone Logic) The indicator uses directional VWAP filtering to prevent counter-trend signals: Long Signals (Green) Only allowed when price is AT or BELOW VWAP ✅ Lower 2nd band (-2σ to -1σ) ✅ Lower 3rd band (-3σ to -2σ) ✅ At VWAP exactly ❌ BLOCKED in upper bands (above VWAP) Logic: Longs when price is stretched below fair value (mean reversion) Short Signals (Red) Only allowed when price is AT or ABOVE VWAP ✅ Upper 2nd band (+1σ to +2σ) ✅ Upper 3rd band (+2σ to +3σ) ✅ At VWAP exactly ❌ BLOCKED in lower bands (below VWAP) Logic: Shorts when price is stretched above fair value (mean reversion) 🎨 Visual Elements Chart Overlays Element Color Description VWAP Line Yellow Session-anchored fair value ±1σ Bands Blue Fair value zone (no score) ±2σ Bands Purple Moderate deviation (15 pts) ±3σ Bands Red Extreme deviation (25 pts) Swing Highs Red ▼ Confirmed pivot highs Swing Lows Green ▲ Confirmed pivot lows Session Background Light Green Active high-value session Setup Labels Bullish Setup: A+ ▲ 75 Green label below candle, shows grade and score Bearish Setup: A++ ▼ 90 Red label above candle, shows grade and score Score Panel Real-time table in top-right corner: Individual component scores (0-25 each) Total score (0-100) Current setup grade (A/A+/A++) Updates in real-time as market conditions change 🔔 Alert Conditions Setting Up Alerts Method 1: Built-in Alert Conditions Click "Create Alert" in TradingView Select Market State Engine as condition Choose alert type: Bullish Setup - Long signals only Bearish Setup - Short signals only Any Setup - All signals Set to "Once Per Bar Close" Configure notification method (app, email, webhook) Method 2: Custom Alert Message Alert messages include full breakdown: A+ Setup Detected (Score: 85) Components: VWAP(25) + Structure(25) + CVD(20) + Time(15) CVD State: Confirmation Direction: Long Timeframe: 1m Alert Behavior ✅ One alert per unique pivot break - no spam ✅ Fires on candle close only - no repainting ✅ Minimum score filter - only A grade or higher (≥60) ✅ Direction-specific - separate bullish/bearish conditions ⚠️ No cooldown between different pivots - multiple alerts per session allowed if different swing levels break 🔧 Technical Details Timeframe Lock Required: 1-minute chart only Reason: Scoring model calibrated for 1m micro-structure Future: Multi-timeframe support planned for v2 Timezone Configuration Hard-coded: America/New_York Session Detection: Uses TradingView's native session functions Consistency: All time-based logic uses NY timezone Swing Detection Parameters Locked to specification: ta.pivothigh(source, left=2, right=2) ta.pivotlow(source, left=2, right=2) Implications: Pivots confirmed 2 bars after formation No repainting - historical pivots don't move 4-bar minimum swing structure (2 left + pivot + 2 right) VWAP Calculation Type: Session-anchored (resets daily) Source: Typical price (high + low + close) / 3 Weighting: Volume-weighted Standard Deviation: True population standard deviation CVD Proxy Formula barDelta = close > open ? volume : close < open ? -volume : 0 CVD = cumulative sum of barDelta (session-reset) Performance Limits Max Labels: 500 (TradingView limit) Max Bars Back: 500 Memory: Lightweight - uses only essential variables 💡 Best Practices 1. Use as a Filter, Not a Strategy ❌ Don't: Blindly take every signal ✅ Do: Use score as confluence for your existing analysis 2. Higher Grades = Better Probability A Setups (60-74): Regular opportunities, still require discretion A+ Setups (75-89): High-quality, multiple factors aligned A++ Setups (90-100): Rare premium opportunities, strongest edge 3. Respect the VWAP Zone Filter The indicator automatically blocks: Longs in upper VWAP bands (counter-trend) Shorts in lower VWAP bands (counter-trend) Trust this logic - it enforces mean reversion discipline. 4. Monitor the Score Panel Watch which components are scoring to understand why a setup formed: Missing CVD score? → No order flow confirmation Missing Time score? → Outside high-volume sessions Low VWAP score? → Weak deviation from fair value 5. Combine with Risk Management The indicator provides opportunity scoring, not position sizing: Use stop losses based on swing structure Scale position size with setup grade (larger on A++, smaller on A) Set profit targets at VWAP or opposing band 6. Session Awareness Prioritize signals during active sessions: 03:00-04:00 NY: Pre-market momentum 09:30-11:30 NY: Highest volume, tightest spreads Off-hours signals (0 time score) are lower probability but still valid if other factors strong. 7. Understand the Hard Gate If no structure shift occurs: Total score = 0 No alerts fire Other components irrelevant Why? Structure shift confirms momentum change - without it, there's no tradable opportunity. 8. Avoid Over-Optimization Default settings are well-calibrated: Don't chase "perfect" parameters Test changes on historical data before live use Document any modifications 9. Leverage Alert De-Duplication The indicator prevents spam automatically: One alert per unique swing break New swing levels = new alerts No need to manually filter notifications 10. Supplement with Price Action Use the indicator alongside: Support/resistance levels Order flow footprint charts Volume profile Market internals (breadth, TICK, etc.) 📚 Example Scenarios Example 1: A++ Premium Setup (Score: 95) Price: In lower 3rd VWAP band (-2.8σ) → VWAP: 25 pts Structure: Close breaks swing high → Structure: 25 pts CVD: Price LL + CVD HL (bullish div) → CVD: 25 pts Time: 10:15 AM NY (market open) → Time: 25 pts Direction: LONG (price below VWAP) → Valid Grade: A++ (95/100) Interpretation: All factors aligned - premium mean-reversion long opportunity. Example 2: A+ Strong Setup (Score: 80) Price: In upper 2nd VWAP band (+1.5σ) → VWAP: 15 pts Structure: Close breaks swing low → Structure: 25 pts CVD: Price HH + CVD LH (bearish div) → CVD: 25 pts Time: 2:00 PM NY (off-hours) → Time: 0 pts Direction: SHORT (price above VWAP) → Valid Grade: A+ (65/100) Interpretation: Strong setup despite off-hours, bearish divergence adds confidence. Example 3: Filtered Setup (Score: 0) Price: In upper 3rd VWAP band (+2.5σ) → VWAP: 25 pts (if allowed) Structure: Close breaks swing high → Structure: BLOCKED CVD: Price HH + CVD HH (confirmation) → CVD: 20 pts (if allowed) Time: 10:00 AM NY → Time: 25 pts (if allowed) Direction: LONG (price ABOVE VWAP) → ❌ INVALID ZONE Grade: None (0/100) - NO ALERT Interpretation: VWAP filter blocked long signal in upper band - prevents counter-trend trade. 🛠️ Troubleshooting No Signals Appearing ✅ Verify you're on 1-minute chart ✅ Check Tick Size matches your symbol ✅ Ensure VWAP Bands are visible ✅ Wait for confirmed pivots (requires at least 5 bars of history) Alerts Not Firing ✅ Confirm alert is set to "Once Per Bar Close" ✅ Check score threshold (must be ≥60 by default) ✅ Verify VWAP zone filter isn't blocking signals ✅ Check that structure shift is actually occurring Score Always Zero ✅ No structure shift detected (hard gate active) ✅ Price may not be in valid VWAP zone (2nd or 3rd band) ✅ Insufficient swing history (wait for pivots to form) Too Many/Too Few Signals Too many signals: Increase A Setup Threshold (e.g., 70 instead of 60) Increase Tick Buffer Count (reduces false breaks) Too few signals: Decrease A Setup Threshold (e.g., 50 instead of 60) Decrease Tick Buffer Count (more sensitive to breaks) 📜 License This indicator is provided under the Mozilla Public License 2.0. 🤝 Credits Developed as a professional trading tool for systematic opportunity identification. Philosophy: Reduce noise. Enforce discipline. Keep the human in control. 📞 Support For questions, issues, or feature requests, please consult: This README documentation The specification document (pinescript_market_state_engine_spec.docx) Inline code comments in market_state_engine.pine 🔄 Version History v1.0 (Current) Initial release 4-component scoring model (VWAP + Structure + CVD + Time) VWAP zone directional filtering Alert de-duplication Configurable inputs Real-time score panel Session-aware logic 🎓 Understanding the Numbers Quick Reference Card Score Range Grade Quality Typical Use 90-100 A++ Premium Highest conviction trades 75-89 A+ High Strong probability setups 60-74 A Good Acceptable with discretion 0-59 None Filtered Skip or wait for confluence Component Contribution Examples Minimum A Setup (60 points): Structure (25) + VWAP 3rd band (25) + Time (25) = 75 ✅ Typical A+ Setup (75 points): Structure (25) + VWAP 2nd band (15) + CVD confirm (20) + Time (25) = 85 ✅ Maximum A++ Setup (100 points): Structure (25) + VWAP 3rd band (25) + CVD divergence (25) + Time (25) = 100 ✅ 🎯 Final Reminder This is NOT a trading bot. This is NOT financial advice. This is a decision-support tool. Always: ✅ Use proper risk management ✅ Understand the logic before trading ✅ Backtest on your symbols ✅ Keep the human in control Happy Trading! 📈Pine Script®指標由TC_BE提供4
Session High/Low [gdad]There are many strategies that use the 5 min, 10 min or 15 min opening candle. There are also strategies that look at the behavior of other markets such as Tokyo and London as well as the pre-market. Along with these strategies, there is one by The Rumers (@the.rumers) that also looks at the Day ATR with his Padder Scalp strategy. I trade Futures and like to see how the market has done for varying trading sessions. I found it was time consuming and distracting to my trading to manually mark all these different things up. This indicator takes TradingView's Trading Sessions indicator and combined ideas borrowed the idea of taking the opening range breakout and extending it to the end of the trading session from Opening Range & Prior Day High/Low along with some additional enhancements and provided information. It comes pre-built with eight different sessions: Session 1: Futures Session Session 2: Tokyo Session 3: London Session 4: NY Pre-Market Session 5: New York Session 6: 5 min open Session 7: 10 min open Session 8: 15 min open The names, time spans, time zones, colors, whether to show the mid-line or averages and whether and how far to extend them are all customizable once you click Show Session. You can show none, one or multiple sessions. You can also choose which text shows up in the text box (the same will show for each session). Warning: The Extend to Time range must start during the Session Time. You cannot have a Session Time of 9:30-9:45 and an Extend Time from 10:00-4:00. Average is calculated by the sum of the close divided by the number of bars for the session.Pine Script®指標由gdad提供已更新 30
ICT Opening Range Projections (tristanlee85)ICT Opening Range Projections This indicator visualizes key price levels based on ICT's (Inner Circle Trader) "Opening Range" concept. This 30-minute time interval establishes price levels that the algorithm will refer to throughout the session. The indicator displays these levels, including standard deviation projections, internal subdivisions (quadrants), and the opening price. 🟪 What It Does The Opening Range is a crucial 30-minute window where market algorithms establish significant price levels. ICT theory suggests this range forms the basis for daily price movement. This script helps you: Mark the high, low, and opening price of each session. Divide the range into quadrants (premium, discount, and midpoint/Consequent Encroachment). Project potential price targets beyond the range using configurable standard deviation multiples . 🟪 How to Use It This tool aids in time-based technical analysis rooted in ICT's Opening Range model, helping you observe price interaction with algorithmic levels. Example uses include: Identifying early structural boundaries. Observing price behavior within premium/discount zones. Visualizing initial displacement from the range to anticipate future moves. Comparing price reactions at projected standard deviation levels. Aligning price action with significant times like London or NY Open. Note: This indicator provides a visual framework; it does not offer trade signals or interpretations. 🟪 Key Information Time Zone: New York time (ET) is required on your chart. Sessions: Supports multiple sessions, including NY midnight, NY AM, NY PM, and three custom timeframes. Time Interval: Supports multi-timeframe up to 15 minutes. Best used on a 1-minute chart for accuracy. 🟪 Session Options The Opening Range interval is configurable for up to 6 sessions: Pre-defined ICT Sessions: NY Midnight: 12:00 AM – 12:30 AM ET NY AM: 9:30 AM – 10:00 AM ET NY PM: 1:30 PM – 2:00 PM ET Custom Sessions: Three user-defined start/end time pairs. This example shows a custom session from 03:30 - 04:00: 🟪 Understanding the Levels The Opening Price is the open of the first 1-minute candle within the chosen session. At session close, the Opening Range is calculated using its High and Low . An optional swing-based mode uses swing highs/lows for range boundaries. The range is divided into quadrants by its midpoint ( Consequent Encroachment or CE): Upper Quadrant: CE to high (premium). Lower Quadrant: Low to CE (discount). These subdivisions help visualize internal range dynamics, where price often reacts during algorithmic delivery. 🟪 Working with Ranges By default, the range is determined by the highest high and lowest low of the 30-minute session: A range can also be determined by the highest/lowest swing points: Quadrants outline the premium and discount of a range that price will reference: Small ranges still follow the same algorithmic logic, but may be deemed insignificant for one's trading. These can be filtered in the settings by specifying a minimum ticks limit. In this example, the range is 42 ticks (10.5 points) but the indicator is configured for 80 ticks (20 points). We can select which levels will plot if the range is below the limit. Here, only the 00:00 opening price is plotted: You may opt to include the range high/low, quadrants, and projections as well. This will plot a red (configurable) range bracket to indicate it is below the limit while plotting the levels: 🟪 Price Projections Projections extend beyond the Opening Range using standard deviations, framing the market beyond the initial session and identifying potential targets. You define the standard deviation multiples (e.g., 1.0, 1.5, 2.0). Both positive and negative extensions are displayed, symmetrically projected from the range's high and low. The Dynamic Levels option plots only the next projection level once price crosses the previous extreme. For example, only the 0.5 STDEV level plots until price reaches it, then the 1.0 level appears, and so on. This continues up to your defined maximum projections, or indefinitely if standard deviations are set to 0. This example shows dynamic levels for a total of 6 sessions, only 1 of which meet a configured minimum limit of 50 ticks: Small ranges followed by significant displacement are impacted the most with the number of levels plotted. You may hide projections when configuring the minimum ticks. A fixed standard deviation will plot levels in both directions, regardless of the price range. Here, we plot up to 3.0 which hiding projections for small ranges: 🟪 Legal Disclaimer This indicator is provided for informational and educational purposes only. It is not financial advice, and should not be construed as a recommendation to buy or sell any financial instrument. Trading involves substantial risk, and you could lose a significant amount of money. Past performance is not indicative of future results. Always consult with a qualified financial professional before making any trading or investment decisions. The creators and distributors of this indicator assume no responsibility for your trading outcomes. Pine Script®指標由tristanlee85提供已更新 1010374
Session Seed Range (LON / FRA / NY / CME / ASIA + 3 Custom) — v6Session Seed Range → Lines (LON / FRA / NY / CME / ASIA + 3 Custom) What it does This tool draws two horizontal levels—the High and Low of a short seed window at each market open (e.g., London 09:00–09:05)—and extends them to the session close (e.g., 17:30). An optional Mid line (average of seed High/Low) can be displayed as well. Included sessions • London, Frankfurt, New York, CME, Asia • Plus 3 fully custom sessions (name, seed window, session end) Key features • Seed window → extended lines: Capture the initial opening move and project it across the trading session. • Timezone dropdown: Choose from common IANA timezones (incl. Europe/Istanbul)—no manual offset math. • Label language: DE / EN / TR (or Off) for price labels at the right edge. • Show/Hide Mid line per your preference. • 3 custom sessions: Add your own schedules with custom names. • Per-session styling: Colors and widths for High/Low/Mid. • Lightweight: Works on any timeframe. ________________________________________ Quick start 1. Pick your Timezone in the Inputs. 2. Enable a session (e.g., London) and set its Seed (HHMM–HHMM) and Session End (HHMM). 3. Optionally turn on Show mid line and Labels (DE/EN/TR). 4. Repeat for other sessions or use the Custom A/B/C blocks. Tip: The seed window must be visible on the chart’s timeframe so the High/Low can be collected. If you don’t see lines, zoom in or use a lower timeframe. ________________________________________ Inputs overview • Timezone: IANA timezone selection. • Labels: Off / DE / EN / TR + label offset (ticks). • Show mid line: Toggle Mid (average of seed High/Low). • Session blocks (London, Frankfurt, New York, CME, Asia, Custom A/B/C): o Enable, Seed (HHMM–HHMM), Session End (HHMM) o High/Low/Mid colors, Width ________________________________________ Notes & limitations • Lines are built from the seed window only; they do not repaint once the seed completes. • If the chart timeframe is too high to include the seed window, switch to a lower TF or widen the seed. • This indicator is for analysis/education only and not financial advice. ________________________________________ Changelog (suggested) • v1.0.0 — Initial release: LON/FRA/NY/CME/ASIA + 3 Custom, TZ dropdown, labels DE/EN/TR, Mid toggle. ________________________________________ If you want a shorter “store blurb” version, use: Draws High/Low of a small opening seed window (e.g., London 09:00–09:05) and extends them to session close. Includes London, Frankfurt, New York, CME, Asia + 3 custom sessions. Timezone dropdown (incl. Europe/Istanbul), labels in DE/EN/TR (or Off), optional Mid line, per-session styling. Seed window must be visible on your timeframe. Not financial advice.Pine Script®指標由ayhan_yuecel提供已更新 25
DCStatCalcs_v0.1DCStatCalcs_v0.1 - Session-Based Statistical Projections This Pine Script indicator overlays customizable horizontal lines on your chart to visualize a session's opening price and its statistical projections based on historical standard deviation (SD). Designed for traders who want to analyze price behavior within defined time sessions, it calculates and plots the session open price along with optional projection lines at 0.5, 1.0, 1.5, 2.0, and 2.5 standard deviations above and below the open, derived from past session data. Key Features: Customizable Sessions: Define your session time (e.g., 0600-1500) and timezone (e.g., America/New_York). Historical Analysis: Uses a user-specified number of past sessions (default: 20) to compute the standard deviation of price movements relative to the session open. Projection Lines: Displays toggleable lines at multiple SD levels with adjustable styles, colors, and widths for easy visualization. Flexible Display: Extend lines beyond the current bar with an offset setting, and adjust label sizes for clarity. Real-Time Updates: Lines dynamically extend as the session progresses, keeping projections relevant to the current bar. How It Works: At the start of each user-defined session, the indicator records the opening price and calculates the SD based on price deviations from the open across historical sessions. It then plots the open price line and, if enabled, projection lines at the specified SD intervals. These lines help traders identify potential support, resistance, or volatility zones based on statistical norms. Use Case: Ideal for day traders or analysts working with intraday charts to gauge price ranges and volatility within specific trading sessions, such as market opens or key economic hours. Published under the Mozilla Public License 2.0. Created by dc_77.Pine Script®指標由dc_77提供已更新 66442
SPX Iron Fly Session TrackerOverview This indicator provides visual tracking for iron fly option structures designed for SPX 0-day-to-expiration (0DTE) intraday trading. It implements a two-phase position management system that adapts to different market conditions throughout the trading day. This is a visualization and tracking tool only. It does not execute trades, access real options data, or calculate actual profit and loss. All displayed positions are theoretical representations based on underlying price movement. Strategy Goal and Context The Core Objective: The strategy aims to have SPX price expire within your iron fly positions at end of day. When price expires inside a fly's profit zone (between the wings), that position captures maximum premium. The challenge is that price moves throughout the day, so static positioning rarely succeeds. The Solution: Active Management Rather than setting positions and hoping price cooperates, this approach continuously manages and repositions flies to keep price centered within your profit zones. As SPX drifts during the trading session, you add new flies at current price levels and close flies that price has moved away from. The Goal: Multiple Profitable Expirations By session end, you want as many flies as possible to have price expire within their center zones. This requires: Adding new flies as price moves away from existing positions Closing flies when price crosses beyond their optimal range Building layered coverage in the afternoon to increase probability of capture Adapting wing widths to time of day and volatility The Reality: Capital and Time Intensive This is not a passive strategy. Successful implementation requires: Substantial capital (each fly requires margin, multiple flies compound this) Active monitoring throughout trading sessions Quick decision-making as positions trigger Multiple position adjustments per session Disciplined adherence to management rules How This Indicator Helps: For backtesting: Use replay mode to study how positions would have managed on historical sessions Test different parameter combinations to find optimal settings Observe position behavior during various market conditions Understand timing and frequency of position adds and closes Validate whether your capital can support the required position count For live session support: Real-time visual tracking shows current position coverage Alerts notify you immediately when new positions should be added Position closure alerts help you manage exits promptly Reference strike tracking shows where you're measuring movement from History table provides audit trail of all position activity The indicator handles the complex tracking and rule application, allowing you to focus on execution and risk management. Key Use Cases 1. Replay Mode - Backtest and Study Use TradingView's replay feature to validate the strategy on historical sessions: Step through past SPX sessions bar-by-bar See exactly when positions would have opened and closed Count how many flies would have expired profitably Analyze different parameter settings on the same historical data Study position behavior during trending vs ranging conditions Calculate approximate capital requirements for your setup Refine your parameters before risking real capital 2. Live Session Alerts Set up real-time notifications for active trading sessions: Get alerted immediately when new positions trigger Receive notifications when positions close Alerts include strike level, wing width, and closure reason Works on mobile, desktop, email, or webhook Never miss a position signal during active trading Maintain awareness even when away from screens briefly 3. Fully Customizable Parameters Adapt every aspect to your risk tolerance and capital: Adjust trigger distances for more or fewer position adds Modify wing widths for different volatility environments Change session timing to match your trading schedule Set maximum concurrent positions to your capital limits Fine-tune spacing to match available strike increments Iron Fly Structure An iron fly is a neutral options strategy with four legs: - Short 1 ATM Call - Short 1 ATM Put - Long 1 OTM Call (upper wing protection) - Long 1 OTM Put (lower wing protection) The structure creates a defined risk zone. Maximum profit occurs when price expires at the center strike. Loss increases as price moves toward the wings (breakeven points). Maximum loss is defined and occurs beyond the wings. Expiration Goal: You want SPX to close inside the fly's wings. If SPX expires at the strike, you capture maximum premium. If SPX expires between the strike and either wing, you still profit (reduced). If SPX expires beyond the wings, you realize a loss (but it's defined and limited by the wings). Two-Phase Management System The indicator tracks positions across two distinct trading phases with different management rules: Phase 1: TWO_GLASS - Morning Session (Default 10am-1pm ET) Conservative positioning with active repositioning: - Trigger new positions when price moves 7.5 points from reference strike (configurable) - Maintain maximum 2 concurrent positions (configurable) - 10-point spacing between position strikes (configurable) - 40-point wing width (configurable) - Exit rule: When two positions are active and price crosses to one strike level, close the OTHER position This phase uses a "follow the price" approach. You're not trying to stack multiple positions yet - you're maintaining one or two flies centered on wherever price currently is. As price drifts, you add a new fly at the current level and close the old one when price moves too far away. Phase 2: THREE_GLASS - Afternoon Session (Default 1pm-4pm ET) Accumulation mode with layered coverage: - Trigger new positions every 2.5 points of price movement (configurable) - Maintain maximum 6 concurrent positions (configurable) - 5-point spacing between strikes (configurable) - 20-point wings early, reducing to 10 points after 3pm (configurable) - Exit rule: Positions only close when price reaches wing extremes This phase builds a stacked profit zone. Instead of swapping positions, you accumulate multiple flies as price moves. The goal is to have several flies active at expiration, creating a wider net to capture price. Tighter spacing and more frequent triggers create this layered coverage. Why Two Different Phases? Morning (Phase 1): Earlier in the day, price has more time to move substantially. Maintaining many concurrent positions is riskier because price could trend and hit multiple wings. The strategy uses selective positioning with wider wings and active replacement. Afternoon (Phase 2): Closer to expiration, price movements typically compress. Time for large moves decreases. The strategy shifts to accumulation, building a net of positions to increase probability that final expiration price falls within at least one (ideally several) of your flies. Tighter wings and more positions become appropriate. Exit Mechanisms Strike Cross Exit (Phase 1 Only) When two positions are active, if price moves to or beyond one position's strike level, the OTHER position closes. This keeps your coverage centered on current price action rather than maintaining positions price has moved away from. Example: Flies at 5900 and 5910 are open. Price moves to 5910. The fly at 5900 closes because price has moved to the 5910 level. You're now positioned at current price (5910) rather than maintaining coverage at old price (5900). Wing Extreme Exit (Both Phases) Any position closes immediately when price touches its upper or lower wing boundary. This represents the breakeven/maximum loss point, so the position is closed to prevent further deterioration. Dynamic Wing Adjustment Wing widths automatically adjust based on time of day: - Phase 1 (Morning): 40 points (customizable) - Phase 2 Early (1pm-3pm): 20 points (customizable) - Phase 2 Late (3pm-4pm): 10 points (customizable) This progressive tightening reflects decreasing price movement potential as expiration approaches. Wider wings earlier provide more protection when price could move substantially. Tighter wings later allow more precise positioning when price movements typically compress. All values are fully adjustable to match your risk parameters and observed market volatility. Customization Guide Every parameter can be modified to suit your trading style, risk tolerance, and capital: Session Timing - TWO_GLASS Start Hour: When Phase 1 begins (default: 10am ET) - THREE_GLASS Start Hour: When Phase 2 begins (default: 1pm ET) - Wing Width Change Hour: When wings tighten (default: 3pm ET) - Session End Hour: When tracking stops (default: 4pm ET) Phase 1 Parameters (Fully Adjustable) - Trigger Distance: How far price must move from reference strike to add new position (default: 7.5, range: 0.1+) - Fly Spacing: Distance between position strikes (default: 10, range: 1.0+) - Wing Width: Distance from strike to wings (default: 40, range: 5.0+) - Max Flies: Maximum concurrent positions (default: 2, range: 1-10) Phase 2 Early Parameters (Fully Adjustable) - Trigger Distance: Movement needed to add new position (default: 2.5, range: 0.1+) - Fly Spacing: Distance between strikes (default: 5, range: 1.0+) - Wing Width: Strike to wing distance (default: 20, range: 5.0+) - Max Flies: Maximum concurrent positions (default: 6, range: 1-20) Phase 2 Late Parameters - Wing Width: Reduced width after 3pm (default: 10, range: 5.0+) General Settings - Strike Rounding: Round strikes to nearest multiple (default: 5.0, range: 1.0+) - Bars Before Check: Bars to wait before allowing closure (default: 2, prevents premature exits) Display Options - Show History Table: Toggle detailed position log (default: on) - History Table Rows: Number of positions displayed (default: 15, range: 5-30) Alert Settings - Enable Alerts: Toggle notifications for opens/closes (default: on) How to Use For Backtesting in Replay Mode: Select a historical SPX trading session Apply indicator to 1-5 minute timeframe Configure your preferred parameters Activate TradingView's replay feature Play through the session (step-by-step or continuous) Observe when positions open (green boxes appear) Watch position closures (boxes turn gray) Count how many flies would have expired with price inside (green at session end) Note total number of position adds throughout session Calculate approximate capital needed (positions × margin per fly) Test different parameter combinations on same historical data Study position behavior during trending vs ranging sessions For Live Trading Sessions: Apply indicator to SPX on 1-5 minute timeframe Configure parameters based on your backtest results Create alerts for "Iron Fly Opened" and "Iron Fly Closed" Set alert frequency to "Once Per Bar Close" Choose notification method (popup, mobile app, email, webhook) Monitor the status table (top-right) for current session and reference strike Review history table (bottom-right) for position log with timestamps When alert triggers, use visual cues to manually place actual option orders Execute position adds and closes as indicated by the tracker Visual Interpretation: Green boxes = Active positions (theoretical profit zones) White lines (Phase 1) / Aqua lines (Phase 2) = Strike levels Red/Blue dotted lines = Wing boundaries (breakeven/risk limits) Gray boxes = Closed positions (historical reference) Current SPX price line = Shows where price is relative to positions Top-right table = Current session status, reference strike, open/closed counts Bottom-right table = Complete position history with open/close timestamps Alert System Details The indicator generates detailed alert messages for position management: Position Opened: - Strike level where fly should be placed - Wing width (±points from strike) - Session phase (Phase 1 or Phase 2) - Alert format example: "Iron Fly OPENED | Strike: 5900 | Wings: ±40 | Session: TWO_GLASS" Position Closed: - Strike level of fly being closed - Closure reason (strike cross, wing extreme, etc.) - Session phase - Alert format example: "Iron Fly CLOSED | Strike: 5900 | Reason: Price crossed to lower fly | Session: TWO_GLASS" Configure alerts once before market open, then receive automatic notifications as positions trigger throughout the trading session. Parameter Optimization Suggestions For Higher Volatility Environments: - Increase trigger distances (e.g., Phase 1: 10-15 points, Phase 2: 3-5 points) - Widen wing widths (e.g., Phase 1: 50-60 points, Phase 2: 25-30 points early, 15-20 late) - Increase strike spacing to reduce position frequency For Lower Volatility Environments: - Decrease trigger distances (e.g., Phase 1: 5-7 points, Phase 2: 1.5-2 points) - Tighten wing widths (e.g., Phase 1: 30-35 points, Phase 2: 15-18 points early, 8-10 late) - Reduce strike spacing for more granular coverage For Conservative Risk Management: - Reduce maximum concurrent positions (Phase 1: 1, Phase 2: 3-4) - Widen wing widths for more breathing room - Increase bars before check to avoid whipsaws - Use wider trigger distances to reduce position frequency For Aggressive Positioning: - Increase maximum concurrent positions (Phase 2: 8-10) - Tighten trigger distances for more frequent adds - Reduce bars before check for faster responses - Use tighter spacing to create denser coverage Capital Considerations: Remember that each fly requires margin. If Phase 2 allows 6 concurrent flies and each requires $10,000 margin, you need $60,000 in available capital just for position requirements, plus additional cushion for adverse movement. Use replay mode to count maximum concurrent positions that would have occurred on historical sessions with your parameters, then calculate total capital needed. Practical Application This tool provides visual guidance and management support. To implement the strategy: Backtest thoroughly in replay mode first Validate capital requirements for your parameter settings Confirm you can actively monitor positions during trading hours Use displayed positions as reference for manual order placement Match indicator parameters to your actual option contracts Account for real-world factors: commissions, slippage, bid-ask spreads, option availability Implement proper position sizing based on available capital Set up alerts before market open to catch all signals Execute actual trades manually in your brokerage platform Track actual results versus indicator expectations Important Limitations Theoretical tracking only - not an automated trading system No access to real option prices, Greeks, or implied volatility No profit/loss calculations or risk metrics Does not account for time decay (theta), delta, gamma, vega changes Assumes continuous price action - gaps or halts not handled Designed for 0DTE SPX options - not suitable for other timeframes or instruments Assumes option availability at all strike levels - may not reflect reality Does not model actual option bid/ask spreads or liquidity Assumes instant execution at desired strikes - slippage not considered Historical replay shows theoretical behavior only - actual market conditions may differ Does not adjust for changing implied volatility throughout session Position count and timing may not match what's executable in real markets Capital and Time Requirements This strategy is resource-intensive: Capital Requirements: Each iron fly requires margin (varies by broker and strike width) Multiple concurrent positions multiply capital needs Example: 6 flies at $10,000 each = $60,000 minimum Additional cushion needed for adverse movement Pattern Day Trader rules may apply (requires $25,000 minimum) Time Requirements: Active monitoring during trading hours (typically 10am-4pm ET) Quick response to position add/close signals Multiple position adjustments per session possible Cannot be passive or set-and-forget Requires ability to place orders promptly when alerted Use replay mode to understand the commitment level before attempting live implementation. Risk Considerations Iron fly trading involves substantial risk. This indicator provides visualization and management support only - it does not constitute financial advice or trading recommendations. Options trading can result in total loss of capital. The indicator's theoretical positions do not reflect actual trading results. Backtest analysis and historical visualization do not guarantee similar future outcomes. Multiple concurrent positions multiply both profit potential and loss risk. Always conduct independent research, understand all risks, validate capital requirements, and never trade with funds you cannot afford to lose. Consider starting with paper trading to validate execution capability before risking real capital. Technical Notes The indicator uses price-based triggers only. It does not: Connect to options data feeds Calculate theoretical option values or Greeks Execute trades automatically Provide specific trading signals or recommendations Account for option-specific factors (implied volatility, time decay, bid/ask spreads) All displayed information represents theoretical position placement based solely on underlying SPX price movement and user-configured parameters. The tool helps visualize the management framework but requires the trader to handle all actual execution and risk management decisions. This is an educational and analytical tool for understanding iron fly position management concepts. It requires active interpretation, backtesting validation, and manual implementation by the user. Pine Script®指標由luiscaballero提供已更新 1
AllDay Session TimesIndicator: Custom Session Times This indicator is designed to assist traders by visualizing specific trading session times on the TradingView platform. It highlights two important trading sessions: the Day Session and the Evening Session, providing a visual aid that helps traders navigate the markets with greater accuracy. Day Session Time Range: Starts: 10:55 UTC+2 Ends: 13:30 UTC+2 Evening Session Time Range: Starts: 16:55 UTC+2 Ends: 18:30 UTC+2 How It Works: Colors and Backgrounds: This indicator uses background colors to differentiate the sessions. The green background appears during the Day Session, while the blue background indicates the Evening Session. Lines: Session time ranges are also marked with clear lines on the chart, making it easier to identify the specific session periods. Time Zone: The time zone is set to UTC+2 (Europe/Helsinki), but it can easily be adjusted to match your local time zone. Why Use This Indicator? This indicator is especially useful for traders who focus on specific market sessions. For example: The Day Session might be when the market is more active, and trends are clearer. The Evening Session could be a good time to observe market adjustments based on the events of the day and find potential trading opportunities. By visualizing these specific time frames, the indicator helps reduce distractions and enables a more focused approach to trading. Use Cases: This indicator is ideal for: Day traders and swing traders who want to focus on certain market sessions. Technical analysts who prefer to visualize market behavior within specific time frames. Strategy optimization and a more precise assessment of market conditions. Features: Visual session markers that help traders focus on key trading periods. Easy customization of time zone and session time ranges. Background colors and lines that improve chart readability and session tracking. Made By AllDayEsaPine Script®指標由esa_takamaki提供8
Luxy VWAP Magic - MTF Projection EngineThis indicator transforms the classic VWAP into a comprehensive trading system. Instead of switching between multiple indicators, you get everything in one place: multi-timeframe analysis, statistical bands, momentum detection, volume profiling, session tracking, and divergence signals. What Makes This Different Traditional VWAP indicators show a single line. This tool treats VWAP as a foundation for complete market analysis. The indicator automatically detects your asset type (stocks, crypto, forex, futures) and adjusts its behavior accordingly. Crypto traders get 24/7 session tracking. Stock traders get proper market hours handling. Everyone gets institutional-grade analytics. Anchor Period Options The anchor period determines when VWAP resets and recalculates. You have three categories of options: Time-Based Anchors: Session - Resets at market open. Best for intraday stock trading where you want fresh VWAP each day. Day - Resets at midnight UTC. Standard option for most traders. Week / Month / Quarter / Year - Longer reset periods for swing traders and position traders who want broader context. Rolling Window Anchors: Rolling 5D - A sliding 5-day window that never resets. Solves the Monday problem where weekly VWAP equals daily VWAP on first day of week. Rolling 21D - Approximately one month of trading data in continuous calculation. Excellent for crypto and forex markets that trade 24/7 without clear session breaks. Event-Based Anchors: Dividends - Resets on ex-dividend dates. Track institutional cost basis from dividend events. Splits - Resets on stock split dates. Useful for analyzing post-split trading behavior. Earnings - Resets on earnings report dates. See where volume-weighted trading occurred since last quarterly report. Standard Deviation Bands Three sets of bands surround the main VWAP line: Band 1 (Aqua) - Plus and minus one standard deviation. Approximately 68% of price action occurs within this range under normal distribution. Touches suggest minor extension. Band 2 (Fuchsia) - Plus and minus two standard deviations. Only 5% of trading should occur outside this range statistically. Touches here indicate significant overextension and high probability of mean reversion. Band 3 (Purple) - Plus and minus three standard deviations. Touches are rare (0.3% probability) and represent extreme conditions. Often marks climax moves or panic selling/buying. Each band can be toggled independently. Most traders show Band 1 by default and add Band 2 and 3 for specific setups or volatile instruments. Multi-Timeframe VWAP System The MTF section plots previous period VWAPs as horizontal support and resistance levels: Daily VWAP - Previous day's final VWAP value. Key intraday reference level. Weekly VWAP - Previous week's final VWAP. Important for swing traders. Monthly VWAP - Previous month's final VWAP. Institutional benchmark level. Quarterly VWAP - Previous quarter's final VWAP. Major support/resistance for position traders. Previous Day VWAP - Yesterday's closing VWAP specifically, separate from current daily calculation. The Confluence Zone percentage setting determines how close multiple VWAPs must be to trigger a confluence alert. When two or more timeframe VWAPs converge within this threshold, you get a high-probability support/resistance zone. Session VWAPs for Global Markets For forex, crypto, and futures traders who operate in 24/7 markets, the indicator tracks three major global sessions: Asia Session - UTC 21:00 to 08:00. Gold colored line. Typically lower volatility, range-bound action that sets overnight levels. London Session - UTC 08:00 to 17:00. Orange colored line. Often determines daily direction with high volume European participation. New York Session - UTC 13:00 to 22:00. Blue colored line. Highest volume session globally. Sharp directional moves common. Previous session VWAP values display as horizontal lines when each session closes, acting as intraday support and resistance. The table shows which sessions are currently active with checkmarks. On-Chart Labels and Signals The indicator plots several types of labels directly on price action when significant events occur: Volume Spike Labels Fire when current bar volume exceeds configurable thresholds relative to both the previous bar and the 20-bar average. Default settings require 300% of previous bar AND 200% of average volume. Green labels indicate bullish candles. Red labels indicate bearish candles. These spikes often mark institutional entry points. Momentum Shift Labels Appear when VWAP acceleration changes direction. The Slowing label warns when an active trend loses steam, often preceding reversal. The Accelerating label confirms trend continuation or potential bottom during downtrends. Filters available to show only reversal signals in existing trends. VWAP Squeeze Labels Detect when standard deviation bands contract relative to ATR (Average True Range). Low volatility compression often precedes explosive breakout moves. When the squeeze fires (releases), a label appears with directional prediction based on VWAP slope. Divergence Labels Mark price/volume divergences using CVD (Cumulative Volume Delta) analysis: Bullish divergence: Price makes lower low, but CVD makes higher low. Hidden accumulation despite price weakness. Bearish divergence: Price makes higher high, but CVD makes lower high. Hidden distribution despite price strength. Dynamic VWAP Coloring The main VWAP line changes color based on its slope direction: Green - VWAP is rising. Institutional buying pressure. Volume-weighted price increasing. Red - VWAP is falling. Institutional selling pressure. Volume-weighted price decreasing. Gray - VWAP is flat. Consolidation or balance between buyers and sellers. This coloring can be disabled for a static blue line if you prefer cleaner visuals. The VWAP label next to the line shows the current trend direction and delta percentage. Calculated Projection Cone One of the most powerful features is the Calculated Projection Cone. Unlike traditional extrapolation methods that simply extend a trend line forward, this system analyzes what actually happened in similar market conditions throughout the chart's history. How It Works: The system classifies each bar into one of 27 unique market states: Z-Score Level - LOW (oversold), MID (fair value), or HIGH (overbought) based on configurable thresholds Trend Direction - DOWN, FLAT, or UP based on VWAP slope Volume Profile - LOW (below 80%), NORMAL (80-150%), or HIGH (above 150%) relative volume When you look at the current bar, the indicator: 1. Identifies the current market state (e.g., LOW Z-Score + UP Trend + HIGH Volume) 2. Searches through all historical bars on the chart that had the same state 3. Calculates what happened in those bars X bars later (where X is your projection horizon) 4. Shows you the probability of up/down and the average move size Visual Elements: Probability Cone - Colored green (bullish probability above 55%), red (bearish below 45%), or gold (neutral). The cone width represents the historical range of outcomes (roughly the 20th to 80th percentile). Center Line - Shows the average expected price based on historical outcomes in similar conditions. Probability Label - Displays direction probability and average move. Example: "67% UP (+0.8%)" means 67% of similar past cases moved up, averaging 0.8% gain. Fallback System: When the exact 27-state match has insufficient historical data: First fallback: Uses Z-Score plus Trend only (9 broader states, ignoring volume) Second fallback: Uses Z-Score only (3 states) When fallback is active, confidence automatically adjusts Settings: Projection Horizon - How many bars forward to analyze outcomes (5, 10, 15, or 20 bars, default 10) Lookback Period - Historical data window in days (30-252, default 60) Minimum Samples - Cases needed before using fallback (5-30, default 10) Z-Score Threshold - Bucket boundary for LOW/MID/HIGH classification (1.0, 1.5, or 2.0 sigma) Cloud Transparency - Adjust visibility (50-95%) Colors - Customize bullish, bearish, and neutral cone colors Confidence Levels: HIGH - 30 or more similar historical cases found MEDIUM - 15-29 similar cases LOW - Fewer than 15 cases (more uncertainty) IMPORTANT DISCLAIMER: The Calculated Projection is based on past patterns only. It is NOT a price prediction or financial advice. Similar market states in the past do not guarantee similar outcomes in the future. The probability shown is historical frequency, not a guarantee. Always combine with other analysis and never rely solely on projections for trading decisions. Alert Conditions The indicator includes over 20 pre-built alert conditions: Price vs VWAP: Price crosses above VWAP Price crosses below VWAP Band Touches: Price touches plus or minus one sigma band Price touches plus or minus two sigma band (extreme) Price touches plus or minus three sigma band (very extreme) Z-Score Extremes: Z-Score crosses above plus two (overbought extreme) Z-Score crosses below minus two (oversold extreme) Momentum and Trend: Momentum slowing Momentum accelerating Trend turns bullish/bearish/neutral Volume: Volume spike detected CVD Direction: Buyers take control Sellers take control High Probability Signals: Bullish reversal signal (oversold plus accelerating momentum) Bearish reversal signal (overbought plus slowing momentum) MTF and Special: MTF confluence zone entry VWAP squeeze fired Bullish/Bearish divergence detected Any significant signal (catch-all) All signals use confirmed bar data to prevent false alerts from incomplete candles. Settings Overview Settings are organized into logical groups: VWAP Settings Anchor Period selection Show/Hide VWAP line Dynamic coloring toggle VWAP label visibility Bands Visibility Toggle each of three bands independently Info Table Show/Hide table Table position (9 options) Text size Volume spike label settings with adjustable thresholds Momentum label settings with filters Signal labels limited to 5 most recent (auto-managed) Probability engine lookback period Multi-Timeframe VWAP Enable/Disable MTF system Show MTF in table Show MTF lines on chart Individual timeframe toggles Confluence zone threshold Squeeze detection toggle Session VWAPs Enable/Disable session tracking Apply to all assets option Show session labels Divergence Detection Enable/Disable divergence Pivot lookback period Show divergence labels Calculated Projection Enable/Disable projection cone Projection horizon (5, 10, 15, or 20 bars) Lookback period in days (30-252) Minimum samples threshold Z-Score classification threshold (1.0, 1.5, or 2.0 sigma) Cloud transparency adjustment Bullish, bearish, and neutral colors The Info Table - Your Trading Dashboard The right side of your chart displays a compact table with up to twelve metrics. Row-by-Row Breakdown: Asset and Period - Shows what the indicator detected (US Stock, Crypto, Forex, etc.) and your selected anchor period. The detection happens automatically based on exchange data, so VWAP resets and calculations match your actual trading instrument. Delta Percentage - How far current price sits from VWAP, expressed as a percentage. Positive means price trades above fair value. Negative means below. Large delta values (beyond 1-2%) often precede mean reversion moves. Day traders watch this for overextension. Z-Score - Statistical deviation from VWAP measured in standard deviations. Unlike raw delta, Z-Score accounts for volatility. A 2% move in a volatile biotech stock differs from 2% in a stable utility. Z-Score normalizes this. Values beyond plus or minus two sigma occur only 5% of the time statistically. Trend Direction - Whether VWAP itself is rising, falling, or flat. Rising VWAP means the volume-weighted average price is increasing, which indicates institutional accumulation. Falling VWAP suggests distribution. This differs from price trend since it weights by volume. Momentum State - Is the trend accelerating or slowing down? This measures the rate of change in VWAP slope. When an uptrend shows slowing momentum, it often precedes reversal. Accelerating momentum in a downtrend can signal capitulation and potential bottom. Relative Volume - Current bar volume compared to the 20-bar average, shown as percentage. Values above 150% indicate above-average activity. Spikes above 200-300% often mark institutional involvement. Low volume (below 80%) warns of potential fake moves. MTF Bias - Four checkmarks or X marks showing whether price sits above or below Daily, Weekly, Monthly, and Quarterly VWAP. Four checkmarks means strong bullish alignment across all timeframes. Four X marks indicates bearish alignment. Mixed readings suggest consolidation or transition. Band Probabilities - Historical statistics showing how often price touched each standard deviation band over your lookback period. This helps you understand if mean reversion or trend following works better for your specific instrument. Session Status - Which global trading sessions are currently active (Asia, London, New York). Shows checkmarks for active sessions. Important for forex and crypto traders who need to know when major liquidity windows open and close. Divergence State - Whether the indicator detects bullish or bearish divergence between price and cumulative volume delta. Bullish divergence occurs when price makes lower lows but buying pressure (CVD) makes higher lows, suggesting hidden accumulation. Confidence Score - A weighted composite of all factors displayed as a progress bar and percentage. Combines MTF alignment, Z-Score, trend direction, volume delta, momentum, and relative volume into a single 0-100 score. Higher scores indicate stronger conviction setups. Calculated Projection - When the Projection Cone is enabled, shows the historical probability of price direction and expected move. For example: "▲ 67% (+0.8%)" means in similar market states historically, price moved up 67% of the time with an average gain of 0.8%. The system analyzes 27 unique market states based on Z-Score, Trend, and Volume conditions. Recommended Use Cases Day Trading Stocks: Use Session anchor with Band 1 visible. Watch for price returning to VWAP after morning move. Volume spikes near VWAP often mark institutional accumulation zones. Swing Trading: Use Weekly or Rolling 21D anchor. Enable MTF lines for Daily and Weekly levels. Trade pullbacks to these levels in direction of MTF bias. Crypto and Forex: Enable Session VWAPs. Use Rolling anchors to avoid artificial resets. Monitor session transitions for breakout opportunities. Mean Reversion: Focus on Z-Score reaching plus or minus two. Add Band 2 visibility. Combine with slowing momentum for highest probability reversals. Trend Following: Watch MTF bias alignment. Four checkmarks plus accelerating momentum plus high volume confirms trend continuation setups. Projection Planning: Enable the Calculated Projection to see what happened historically in similar market conditions. Use 5-10 bars for intraday setups, 15-20 bars for swing trade planning. Focus on high probability readings (above 60%) with HIGH confidence (30 or more samples). The cone shows the probable range of outcomes based on actual historical data. Combine with other factors like MTF alignment and volume for higher conviction setups. Important Notes The indicator does not repaint. MTF values use previous period's confirmed data. Rolling VWAP works best on 15-minute timeframes and above due to bar lookback requirements. Session VWAPs apply to global markets by default (forex, crypto, futures). Enable the all-assets option for stocks if desired. Volume data for forex represents tick volume, not actual traded volume. All alert conditions fire only on confirmed (closed) bars to prevent false signals. The Calculated Projection updates each bar as market state changes. This is expected behavior. The projection shows probabilities based on similar past conditions, not a fixed prediction. Q AND A Q: Does this indicator repaint? A: No. The main VWAP calculation uses standard TradingView VWAP methodology. Multi-timeframe values use previous period's confirmed data with appropriate lookahead settings. All alert signals require bar confirmation. Q: Why does my Rolling VWAP look different on 1-minute versus 15-minute charts? A: Rolling VWAP calculates across a fixed number of trading days. On very short timeframes, the bar lookback may hit TradingView limits. For best Rolling VWAP accuracy, use 15-minute or higher timeframes. Q: Can I use this on any instrument? A: Yes. The indicator automatically detects asset type and adjusts behavior. Stocks use standard market hours. Crypto uses 24/7 calculations. Forex uses tick volume. Everything adapts automatically. Q: What does the Confidence Score actually measure? A: The score combines six weighted factors: MTF alignment (25%), Z-Score position (20%), Trend direction (20%), CVD pressure (15%), Momentum state (10%), and Relative volume (10%). Higher scores indicate more factors aligned in one direction. Q: Why are Session VWAPs not showing on my stock chart? A: Session VWAPs apply to 24-hour markets by default (forex, crypto, futures). For stocks, enable the Use for All Assets option in Session VWAP settings. Q: The Divergence labels appear delayed. Is this a bug? A: Divergence detection requires pivot confirmation, which needs bars on both sides of the pivot point. The label appears at the actual pivot location (several bars back) once confirmed. This is intentional and prevents false signals. Q: Can I change the band colors? A: Yes. Each of the three bands has its own color input setting. You can customize Band 1, Band 2, and Band 3 colors to match your preferences. The defaults are Aqua, Fuchsia, and Purple. The main VWAP line color adapts dynamically based on slope direction or can be set to static blue. Q: How do I set up alerts? A: Right-click on the chart, select Add Alert, choose this indicator, and select your desired condition from the dropdown. All conditions include descriptive alert messages with relevant data. Q: What is the Probability Engine lookback period? A: This setting determines how many trading days the indicator analyzes to calculate band touch rates and mean reversion statistics. Default is 60 days (approximately 3 months). Longer periods provide more stable statistics but may miss recent behavior changes. Q: Why do I see fewer labels than expected? A: Signal labels (Volume, Momentum, Squeeze, Divergence) are limited to 5 most recent labels on the chart to keep it clean. When a new label appears, the oldest one is automatically removed. Additionally, momentum labels have several filters: check the slope multiplier setting (higher values require stronger trends) and the Only Reversal Signals option (when enabled, labels only appear for potential reversals, not trend confirmations). Q: What is the Calculated Projection and how accurate is it? A: The Calculated Projection analyzes what happened in past market conditions similar to the current state. It classifies each bar by Z-Score level, Trend direction, and Volume profile (27 unique states), then shows the historical probability of up vs down and the average move size. It is NOT a price prediction or guarantee. The probability shown is how often similar conditions led to up/down moves historically, not a future guarantee. Always use it as one input among many. Q: Why does the Projection probability change? A: The projection updates on each bar as market state changes. If Z-Score moves from LOW to MID, or trend shifts from UP to FLAT, the system looks up a different historical category. This is expected behavior. The projection shows what happened in similar past conditions to the current bar's state. Q: The Projection shows LOW confidence. What does that mean? A: Confidence levels indicate sample size: HIGH means 30 or more historical cases found, MEDIUM means 15-29 cases, LOW means fewer than 15 cases. When sample size is low, the system uses a fallback: first aggregating by Z-Score plus Trend only (ignoring volume), then by Z-Score only. LOW confidence means less statistical reliability, so weight other factors more heavily in your decision. Q: Why does the cone sometimes show 50/50 probability? A: A 50/50 reading means that in similar past market states, price moved up roughly half the time and down half the time. This indicates a neutral or balanced condition where historical patterns provide no directional edge. Consider waiting for a higher probability setup or using other analysis methods. CREDITS AND ACKNOWLEDGMENTS Methodology Foundation: VWAP (Volume Weighted Average Price) - Standard institutional benchmark calculation, widely used since the 1980s for algorithmic execution and fair value assessment Standard Deviation Bands - Statistical volatility measurement applying normal distribution principles to price deviation from mean Z-Score Analysis - Classic statistical normalization technique for comparing values across different volatility regimes Cumulative Volume Delta (CVD) - Order flow analysis concept measuring aggressive buying versus selling pressure Concept Integration: Mean reversion probability engine - Custom historical statistics tracking for band touch rates Momentum acceleration detection - Second derivative analysis of VWAP slope changes VWAP Squeeze - Volatility compression concept adapted from TTM Squeeze methodology applied to VWAP bands versus ATR Confidence scoring system - Weighted composite scoring combining multiple technical factors Calculated Projection Cone - Probability-based projection using 27-state market classification (Z-Score, Trend, Volume) with historical outcome analysis and weighted fallback system All calculations use standard public domain formulas and TradingView built-in functions. No proprietary third-party code was used. For questions, feedback, or feature requests, please comment below or send a private message. Happy Trading!Pine Script®指標由orenluxy提供1111528
My auto dual avwap with Auto swing low/pivot low finderWelcome to My Auto Dual AVWAP with Auto Swing Low/Pivot Low Finder – an open-source TradingView indicator designed to enhance your technical analysis toolbox. This indicator is published under the Mozilla Public License 2.0 and is available for anyone to study, modify, and distribute. Key Features Auto Pivot/Swing Low Finder: In addition to VWAP lines, the indicator incorporates an automatic detection mechanism for swing lows/pivot lows. This feature assists in identifying potential support areas and price reversals, further enhancing your trading strategy. Dual VWAP Calculation with high/low range: The indicator calculates two separate volume-weighted average price (VWAP) lines based on different price inputs (low and high prices) and defined time sessions. This allows traders to gain a more nuanced view of market activity during specific trading periods. Customizable Time Sessions: You can specify distinct start and end times for each VWAP calculation session. This flexibility helps you align the indicator with your preferred trading hours or market sessions, making it adaptable to various time zones and trading styles. Easy to Customize: With clear code structure and detailed comments, the script is designed to be accessible even for traders who want to customize or extend its functionality. Whether you're a seasoned coder or just starting out, the code is written with transparency in mind. How It Works Session Initialization: The script sets up two distinct time sessions using user-defined start and end times. For each session, it detects the beginning of the trading period to reset cumulative values. Cumulative Calculations: During each session, the indicator accumulates the product of price and volume as well as the total volume. The VWAP is then computed as the ratio of these cumulative values. Dual Data Sources: Two separate data inputs (using low and high prices) are used to calculate two VWAP lines. This dual approach provides a broader perspective on market trends and can help in identifying dynamic support and resistance levels. Visualization: The calculated VWAP lines are plotted directly on your chart with distinct colors and thickness settings for easy visualization. This makes it simple to interpret the data at a glance. Why Use This Indicator? Whether you are a day trader, swing trader, or simply looking to refine your market analysis, My Auto Dual AVWAP with Auto Swing Low/Pivot Low Finder offers a robust set of features that can help you identify key price levels and improve your decision-making process. Its open-source nature invites collaboration and customization, ensuring that you can tailor it to fit your unique trading style. Feel free to explore, modify, and share this indicator. Happy trading!Pine Script®指標由doqkhanh提供已更新 22108