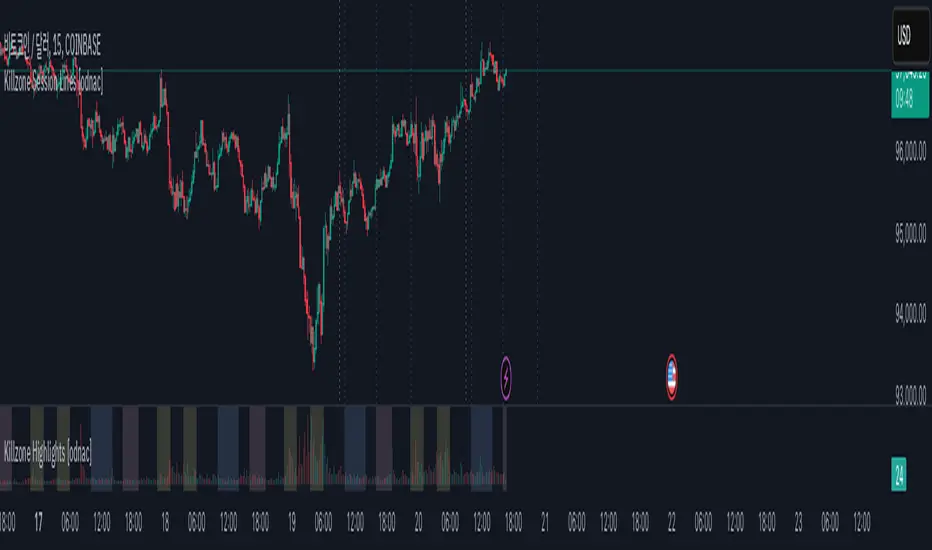
ETH to RTH Gap DetectorETH to RTH Gap Detector
What It Does
This indicator identifies and tracks custom-defined gaps that form between Extended Trading Hours (ETH) and Regular Trading Hours (RTH). Unlike traditional gap definitions, this indicator uses a specialized approach - defining up gaps as the space between previous session close high to current session initial balance low, and down gaps as the space from previous session close low to current session initial balance high. Each detected gap is monitored until it's touched by price.
Key Features
Detects custom-defined ETH-RTH gaps based on previous session close and current session initial balance
Automatically identifies both up gaps and down gaps
Visualizes gaps with color-coded boxes that extend until touched
Tracks when gaps are filled (when price touches the gap area)
Offers multiple display options for filled gaps (color change, border only, pattern, or delete)
Provides comprehensive statistics including total gaps, up/down ratio, and touched gap percentage
Includes customizable alert system for real-time gap filling notifications
Features toggle options for dashboard visibility and weekend sessions
Uses time-based box coordinates to avoid common TradingView drawing limitations
How To Use It
Configure Session Times : Set your preferred RTH hours and timezone (default 9:30-16:00 America/New York)
Set Initial Balance Period : Adjust the initial balance period (default 30 minutes) for gap detection sensitivity
Monitor Gap Formation : The indicator automatically detects gaps between the previous session close and current session IB
Watch For Gap Fills : Gaps change appearance or disappear when price touches them, based on your selected style
Check Statistics : View the dashboard to see total gaps, directional distribution, and touched percentage
Set Alerts : Enable alerts to receive notifications when gaps are filled
Settings Guide
RTH Settings : Configure the start/end times and timezone for Regular Trading Hours
Initial Balance Period : Controls how many minutes after market open to calculate the initial balance (1-240 minutes)
Display Settings : Toggle gap boxes, extension behavior, and dashboard visibility
Filled Box Style : Choose how filled gaps appear - Filled (color change), Border Only, Pattern, or Delete
Color Settings : Customize colors for up gaps, down gaps, and filled gaps
Alert Settings : Control when and how alerts are triggered for gap fills
Weekend Session Toggle : Option to include or exclude weekend trading sessions
Technical Details
The indicator uses time-based coordinates (xloc.bar_time) to prevent "bar index too far" errors
Gap boxes are intelligently limited to avoid TradingView's 500-bar drawing limitation
Box creation and fill detection use proper range intersection logic for accuracy
Session detection is handled using TradingView's session string format for reliability
Initial balance detection is precisely calculated based on time difference
Statistics calculations exclude zero-division scenarios for stability
This indicator works best on futures markets with extended and regular trading hours, especially indices (ES, NQ, RTY) and commodities. Performs well on timeframes from 1-minute to 1-hour.
What Makes It Different
Most gap indicators focus on traditional open-to-previous-close gaps, but this tool offers a specialized definition more relevant to ETH/RTH transitions. By using the initial balance period to define gap edges, it captures meaningful price discrepancies that often provide trading opportunities. The indicator combines sophisticated gap detection logic with clean visualization and comprehensive tracking statistics. The customizable fill styles and integrated alert system make it practical for both chart analysis and active trading scenarios.
在腳本中搜尋"sessions"
ICT Macro Zone Boxes w/ Individual H/L Tracking v3.1ICT Macro Zones (Grey Box Version
This indicator dynamically highlights key intraday time-based macro sessions using a clean, minimalistic grey box overlay, helping traders align with institutional trading cycles. Inspired by ICT (Inner Circle Trader) concepts, it tracks real-time highs and lows for each session and optionally extends the zone box after the session ends — making it a precision tool for intraday setups, order flow analysis, and macro-level liquidity sweeps.
### 🔍 **What It Does**
- Plots **six predefined macro sessions** used in Smart Money Concepts:
- AM Macro (09:50–10:10)
- London Close (10:50–11:10)
- Lunch Macro (11:30–13:30)
- PM Macro (14:50–15:10)
- London SB (03:00–04:00)
- PM SB (15:00–16:00)
- Each zone:
- **Tracks high and low dynamically** throughout the session.
- **Draws a consistent grey shaded box** to visualize price boundaries.
- **Displays a label** at the first bar of the session (optional).
- **Optionally extends** the box to the right after the session closes.
### 🧠 **How It Works**
- Uses Pine Script arrays to define each session’s time window, label, and color.
- Detects session entry using `time()` within a New York timezone context.
- High/Low values are updated per bar inside the session window.
- Once a session ends, the box is optionally closed and fixed in place.
- All visual zones use a standardized grey tone for clarity and consistency across charts.
### 🛠️ **Settings**
- **Shade Zone High→Low:** Enable/disable the grey macro box.
- **Extend Box After Session:** Keep the zone visible after it ends.
- **Show Entry Label:** Display a label at the start of each session.
### 🎯 **Why This Script is Unique**
Unlike basic session markers or colored backgrounds, this tool:
- Focuses on **macro moments of liquidity and reversal**, not just open/close times.
- Uses **per-session logic** to individually track price behavior inside key time windows.
- Supports **real-time high/low tracking and clean zone drawing**, ideal for Smart Money and ICT-style strategies.
Perfect — based on your list, here's a **bundle-style description** that not only explains the function of each script but also shows how they **work together** in a Smart Money/ICT workflow. This kind of cross-script explanation is exactly what TradingView wants to see to justify closed-source mashups or interdependent tools.
---
📚 ICT SMC Toolkit — Script Integration Guide
This set of advanced Smart Money Concept (SMC) tools is designed for traders who follow ICT-based methodologies, combining liquidity theory, time-based precision, and engineered confluences for high-probability trades. Each indicator is optimized to work both independently and synergistically, forming a comprehensive trading framework.
---
First FVG Custom Time Range
**Purpose:**
Plots the **first Fair Value Gap (FVG)** that appears within a defined session (e.g., NY Kill Zone, Custom range). Includes optional retest alerts.
**Best Used With:**
- Use with **ICT Macro Zones (Grey Box Version)** to isolate FVGs during high-probability times like AM Macro or PM SB.
- Combine with **Liquidity Levels** to assess whether FVGs form near swing points or liquidity voids.
---
ICT SMC Liquidity Grabs and OB s
**Purpose:**
Detects **liquidity grabs** (stop hunts above/below swing highs/lows) and **bullish/bearish order blocks**. Includes optional Fibonacci OTE levels for sniper entries.
**Best Used With:**
- Use with **ICT Turtle Soup (Reversal)** for confirmation after a liquidity grab.
- Combine with **Macro Zones** to catch order blocks forming inside timed macro windows.
- Match with **Smart Swing Levels** to confirm structure breaks before entry.
ICT SMC Liquidity Levels (Smart Swing Lows)
**Purpose:**
Automatically marks swing highs/lows based on user-defined lookbacks. Tracks whether those levels have been breached or respected.
**Best Used With:**
- Combine with **Turtle Soup** to detect if a swing level was swept, then reversed.
- Use with **Liquidity Grabs** to confirm a grab occurred at a meaningful structural point.
- Align with **Macro Zones** to understand when liquidity events occur within macro session timing.
ICT Turtle Soup (Liquidity Reversal)
**Purpose:**
Implements the classic ICT Turtle Soup model. Looks for swing failure and quick reversals after a liquidity sweep — ideal for catching traps.
Best Used With:
- Confirm with **Liquidity Grabs + OBs** to identify institutional activity at the reversal point.
- Use **Liquidity Levels** to ensure the reversal is happening at valid previous swing highs/lows.
- Amplify probability when pattern appears during **Macro Zones** or near the **First FVG**.
ICT Turtle Soup Ultimate V2
**Purpose:**
An enhanced, multi-layer version of the Turtle Soup setup that includes built-in liquidity checks, OTE levels, structure validation, and customizable visual output.
**Best Used With:**
- Use as an **entry signal generator** when other indicators (e.g., OBs, liquidity grabs) are aligned.
- Pair with **Macro Zones** for high-precision timing.
- Combine with **First FVG** to anticipate price rebalancing before explosive moves.
---
## 🧠 Workflow Example:
1. **Start with Macro Zones** to focus only on institutional trading windows.
2. Look for **Liquidity Grabs or Swing Sweeps** around key highs/lows.
3. Check for a **Turtle Soup Reversal** or **Order Block Reaction** near that level.
4. Confirm confluence with a **Fair Value Gap**.
5. Execute using the **OTE level** from the Liquidity Grabs + OB script.
---
Let me know which script you want to publish first — I’ll tailor its **individual TradingView description** and flag its ideal **“Best Used With” partners** to help users see the value in your ecosystem.
Market Session Boxes with Volume Delta [algo_aakash]This script highlights four key forex trading sessions — Tokyo, London, New York, and Sydney — by drawing color-coded boxes directly on the chart. For each session, it shows:
High and low of the session
Total volume traded
Volume delta (bullish vs bearish pressure)
Optional extension of session highs/lows into future candles
Cleanly labeled time range and stats
Users can:
Select which sessions to display
Customize session times (in UTC+0)
Choose colors per session
Toggle session labels and extension lines
Use Case: Designed to help intraday and short-term traders visualize market rhythm, liquidity zones, and session-based volatility. The volume delta metric adds an extra layer of sentiment analysis.
This tool works best on intraday timeframes like 15m, 30m, or 1H.
Disclaimer:
This indicator is for educational and visual analysis purposes. It does not constitute trading advice or guarantee results. Always conduct your own analysis before making trading decisions.
Custom Time Range Boxes + Fibs + ExtensionThis script draws two customizable time-range boxes per day, helping traders visualize key market sessions or activity windows. Each box is defined by start and end times that can be adjusted in the settings. You can also choose a custom color and extend the visual width of the box independently from the actual session time. Within each box, the indicator plots three Fibonacci levels: 0.3, 0.5, and 0.7. These levels are useful for identifying potential support, resistance, or retracement zones inside the session range. The script supports two separate time blocks, allowing you to track sessions like the New York Open and Power Hour simultaneously. All lines and boxes are drawn using bar_index for precision and control. The levels and box colors match for visual consistency. Perfect for intraday traders who want to track price behavior around key times. Clean, minimal, and performance-friendly — this tool adds clarity to your session-based strategy.
Bull Bear Pivot by RawstocksThe "Bull Bear Pivot" indicator is a custom Pine Script (v5) tool designed for TradingView to assist traders in identifying key price levels and pivot points on intraday charts (up to 1-hour timeframes). It combines time-based open price markers, pivot high/low detection, and candlestick visualization to provide a comprehensive view of potential support, resistance, and trend reversal levels. Below is a detailed description of the indicator’s functionality, features, and intended use.
Indicator Overview:
The "Bull Bear Pivot" indicator is tailored for intraday trading, focusing on specific times of the day to mark significant price levels (open prices) and detect pivot points. It plots horizontal lines at the open prices of user-defined sessions, identifies pivot highs and lows on the current chart timeframe, and overlays custom candlesticks to highlight price action. The indicator is designed to work on timeframes of 1 hour or less (e.g., 1-minute, 3-minute, 5-minute, 15-minute, 30-minute, 60-minute) and includes a warning mechanism for invalid timeframes.
Key Features:
Time-Based Open Price Markers:
The indicator allows users to define up to five time-based sessions (e.g., 4:00 AM, 8:30 AM, 9:30 AM, 10:00 AM, and a custom time) to capture the open price at the start of each session.
For each session, it plots a horizontal line at the 1-minute open price, extending from the session start to the market close at 4:00 PM EST.
Each line is accompanied by a label positioned 5 bars to the right of the market close (4:00 PM EST), with the text right-aligned and vertically centered on the line.
Users can enable/disable each marker, customize the session time, label text, line color, and text color via the indicator’s settings.
Pivot Highs and Lows:
The indicator calculates pivot highs and lows on the current chart timeframe using the ta.pivothigh and ta.pivotlow functions.
Pivot highs are marked with green triangles above the bars, and pivot lows are marked with red triangles below the bars.
The pivot period (lookback/lookforward) is user-configurable, allowing flexibility in detecting short-term or longer-term reversals.
Custom Candlesticks:
The indicator overlays custom candlesticks on the chart, colored green for bullish candles (close > open) and red for bearish candles (close < open).
This feature helps visualize price action alongside the open price markers and pivot points.
Timeframe Restriction:
The indicator is designed to work on timeframes of 1 hour or less. If the chart timeframe exceeds 1 hour (e.g., 4-hour, daily), a warning label ("Timeframe > 1H\nIndicator Disabled") is displayed, and no elements are plotted.
Customizable Appearance:
Users can customize the appearance of the open price marker lines, including the line style (solid, dashed, dotted) and line width.
Labels for the open price markers have no background (transparent) and use customizable text colors.
Highlight Time of InterestEST Time Period Background Indicator
This TradingView indicator visually highlights up to four custom-defined time periods on your chart using distinct background colors.
Key Features:
Custom Time Periods: Define up to four separate time intervals with individual start and end times, perfect for emphasizing key trading sessions or events.
Automatic Time zone Conversion: Automatically calculates the offset between the broker’s time zone and New York time (EST) so that your periods are correctly aligned with the Eastern market hours.
Visual Clarity:*Each period can be assigned a unique background color, providing clear visual cues directly on your chart for easier analysis and decision-making.
This indicator is ideal for traders who need a clear, automated visual reference for specific trading sessions or periods, streamlining the analysis process by highlighting critical timeframes directly on the chart.
TR Buy/Sell Signal PanelI scripted this with chatgpt have fun guys
📊 TR Buy/Sell Signal Panel – Smart Trade Signals with Visual Clarity
The TR Buy/Sell Signal Panel is a standalone indicator inspired by the powerful Traders Reality (TR) methodology.
It detects potential long and short trade setups using classic market behavior patterns such as volume spikes, EMA crossovers, and session-based timing – all visualized cleanly and statically on your chart.
✅ Key Features
Buy Signals (LONG):
Green PVSRA candle (strong bullish candle with momentum)
EMA13 crossing above EMA50
Volume spike (current volume exceeds 20-period average × multiplier)
Triggered only during London or New York trading sessions (UTC)
Sell Signals (SHORT):
Red PVSRA candle (strong bearish move)
EMA13 crossing below EMA50
Volume spike
Also restricted to active session times
📌 Visual Components
Green/Red arrows on the chart indicate Buy/Sell entries
A static info panel in the bottom-right corner displays all signal conditions:
PVSRA active ✅
Volume Spike ✅
EMA Crossover ✅
Session Time ✅
Last Signal: 🟢 BUY / 🔴 SELL
Current Direction: 🟢 LONG / 🔴 SHORT / ❌ NONE
⚙️ Fully Customizable
Adjustable volume spike multiplier
Optional toggle for showing/hiding short signals
Extremely user-friendly layout – ideal for both beginners & experienced traders
📦 Best For:
Scalpers & Intraday Traders
Traders who follow the Traders Reality / Market Maker Method
Anyone who values clean, rule-based trade entries
Note: Works across all timeframes with sufficient volume (e.g., 5min – 4hr). Sessions are based on UTC time – adjust if needed based on your timezone or trading hours.
Daily separator, Open, HTF candlesScript Overview
This TradingView script is designed to enhance market structure analysis by providing a clear visual representation of key trading elements. It integrates multiple technical features that help traders assess price action, trend direction, and potential trade setups efficiently.
Main Features & Functionality
1. Daily Separator
• A vertical line is plotted to clearly mark the start of each trading day.
• Helps traders visually differentiate daily sessions, making it easier to analyze price action over different periods.
2. Exponential Moving Average (EMA) with EMA Continuity Table
• The script calculates an EMA of choice and displays whether the price is above or below it across five customizable timeframes.
• Use Case:
• Identifies if the price is in a retracement or a trend continuation phase.
• Helps determine trend strength—if price is consistently above the EMA across multiple timeframes, the trend is bullish; if below, it’s bearish.
• Aids in making trading decisions such as whether to go long or short.
3. Higher Timeframe (HTF) Candles
• Plots candles from a higher timeframe (HTF) onto the current chart.
• Use Case:
• Provides a macro view of price action while trading on a lower timeframe.
• Helps traders see if the price is interacting with HTF support/resistance levels.
• Useful for confirming entries/exits based on the HTF trend.
4. Opening Line
• Draws a daily opening price level, allowing traders to track price movement relative to the open.
• Use Case:
• Useful for intraday traders who analyze whether price is holding above or below the daily open.
• Helps in identifying key price behaviors, such as breakouts, fakeouts, or potential reversals.
Additional Considerations
• Customization: The script allows traders to adjust key parameters such as the EMA length, timeframes for EMA continuity, and HTF candle settings.
• Market Structure & Decision Making: By combining EMAs, HTF analysis, and the daily open, the script assists traders in determining whether price action aligns with their trade thesis.
• Potential Enhancements:
• Adding alerts for EMA crossovers or when price crosses the daily open.
• Incorporating color coding for the EMA table to improve readability.
Use Case Summary
This script is particularly beneficial for trend-following traders, intraday traders, and swing traders who want to:
1. Confirm market direction with EMA-based trend analysis.
2. Monitor HTF price action while trading on lower timeframes.
3. Track intraday price movement relative to the daily open.
4. Differentiate trading sessions for better structure analysis.
Time-based Alerts for Trading Windows🌟 Time-based Alerts for Trading Windows 🌐📈
This is a re-uploaded script as the previous one got hidden.
This Time-based Alerts for Trading Windows script is a highly customizable and reliable tool designed to assist traders in managing automated strategies or manually monitoring specific market conditions. Inspired by CrossTrade's Time-based Alert, this script is tailored for those who rely on precise time windows to trigger actions, such as sending webhook signals or managing Expert Advisors (EAs).
Whether you are a scalper, day trader, or algorithmic trader, this script empowers you to stay on top of your trades with fully customizable time-based alerts.
🛠️ Customizable Time Alerts
This indicator allows you to create up to 12 unique time windows by specifying the exact hour and minute for each alert. Each time window corresponds to an individual alert condition, making it perfect for managing trades during specific market sessions or key time periods.
For example:
Alert 1 can be set at 9:30 AM (market open).
Alert 2 can be set at 3:55 PM (just before market close).
Each alert can be toggled on or off in the indicator settings, allowing you to manage alerts without having to reconfigure your script.
You can adjust the colours to fit any colour scheme you like!
🕒 Odd and Even Time Alerts
The script comes with three built-in alert type categories:
Odd Alerts (marked with a green triangle on the chart): These correspond to odd-numbered inputs like Alert 1, Alert 3, Alert 5, and so on.
Even Alerts (marked with a red triangle on the chart): These correspond to even-numbered inputs like Alert 2, Alert 4, Alert 6, and so on.
You can also customize all 12 alerts individually to include a custom alert message
These alerts serve as a convenient way to differentiate between multiple trading strategies or market conditions. You can customize alert messages for odd and even alerts directly from TradingView’s alert panel.
🔗 Webhook Integration for Automation
This script is fully compatible with webhook-based automation. By configuring your alerts in TradingView, you can send signals to trading bots, EAs, or any third-party system. For example, you can:
Turn off an EA at a specific time (e.g., 3:55 PM EST).
Send buy/sell signals to your bot during predefined trading windows.
Simply use TradingView’s alert message editor to format webhook payloads for your automation system.
🌐 Timezone Flexibility
Trading happens across multiple time zones, and this script accounts for that. You can toggle between:
Eastern Time (New York): Ideal for most US-based markets.
Central Time (Exchange): Useful for futures and commodities traders.
This ensures your alerts are always in sync with your preferred time zone, eliminating confusion.
🎨 Visual Indicators
The script plots visual markers directly on your chart to indicate active alerts:
Up Facing Triangles: Represent odd-numbered alerts, providing a quick reference for these time windows.
Down Facing Triangles: Represent even-numbered alerts, helping you track different strategies or conditions.
These visual markers make it easy to see when alerts are triggered, even at a glance.
📈 Practical Use Case
Let’s say you’re trading the USTEC index on a 1-minute chart. You want to:
Turn off your trading bot at 16:55 EST to avoid after-market volatility.
Trigger a re-entry signal at 17:30 EST to capture moves during the Asian session.
Visually monitor these actions on your chart for easy reference.
This script makes it possible with precision alerts and webhook integration. Simply configure the time windows in the settings and set up your alerts in TradingView.
🚨 How to Set Up Alerts
Enable or Disable Alerts: Use the script’s settings to toggle specific alerts on or off as needed.
Set Custom Time Windows: Define the hour and minute for each alert in the settings panel.
Create Alerts in TradingView:
Go to the TradingView alert panel.
Select the condition (e.g., "Odd Time-based Alert (Green)" or "Even Time-based Alert (Red)").
Customize the alert message for webhook integration or personal notification.
Choose the trigger type: Once Per Bar or Once Per Bar Close to keep the alert active.
Integrate with Webhooks: Use the alert message field to format payloads for automation systems like MT4, MT5, or third-party bots.
📋 Key Notes
Alerts can trigger indefinitely if set to "Once Per Bar" or "Once Per Bar Close".
Always ensure the expiration date is set far in the future to avoid unexpected alert deactivation.
Test webhook messages and alert configurations thoroughly before using them in live trading.
This script is a powerful addition to your trading toolbox, offering precision, flexibility, and automation capabilities. Whether you’re turning off an EA, managing trades during market sessions, or automating strategies via webhooks, this script is here to support you.
Start using the Time-based Alerts for Trading Windows today and trade with confidence! 🚀✨
BTIC Range MidpointsThis code analyzes and displays price ranges from 15:15-15:44 ET, the Basis Trade at Index Close session.
It draws horizontal lines showing:
The high of each session
The low of each session
The midpoint (50%) of each session
Connections between different session ranges (50% points between highs and lows)
Key features include:
Works only on 15-minute timeframes or lower
Stores up to 20 days of historical sessions (configurable)
Filters out ranges too far from current price
Color-codes different session ranges
Provides customizable line styles and colors
Labels each range with identifiers
The indicator essentially helps traders identify important price levels from BTIC sessions, which could serve as potential support/resistance areas for future price action.
Twitter Model ICT [TradingFinder] MMXM ERL D + FVG + M15 MSS/SMT🔵 Introduction
The Twitter Model ICT is a trading approach based on ICT (Inner Circle Trader) models, focusing on price movement between external and internal liquidity in lower timeframes. This model integrates key concepts such as Market Structure Shift (MSS), Smart Money Technique (SMT) divergence, and CISD level break to identify precise entry points in the market.
The primary goal of this model is to determine key liquidity levels, such as the previous day’s high and low (PDH/PDL) and align them with the Fair Value Gap (FVG) in the 1-hour timeframe. The overall strategy involves framing trades around the 1H FVG and using the M15 Market Structure Shift (MSS) for entry confirmation.
The Twitter Model ICT is designed to utilize external liquidity levels, such as PDH/PDL, as key entry zones. The model identifies FVG in the 1-hour timeframe, which acts as a magnet for price movement. Additionally, traders confirm entries using M15 Market Structure Shift (MSS) and SMT divergence.
Bullish Twitter Model :
In a bullish setup, the price sweeps the previous day’s low (PDL), and after confirming reversal signals, buys are executed in internal liquidity zones. Conversely, in a bearish setup, the price sweeps the previous day’s high (PDH), and after confirming weakness signals, sells are executed.
Bearish Twitter Model :
In short setups, entries are only executed above the Midnight Open, while in long setups, entries are taken below the Midnight Open. Adhering to these principles allows traders to define precise entry and exit points and analyze price movement with greater accuracy based on liquidity and market structure.
🔵 How to Use
The Twitter Model ICT is a liquidity-based trading strategy that analyzes price movements relative to the previous day’s high and low (PDH/PDL) and Fair Value Gap (FVG). This model is applicable in both bullish and bearish directions and utilizes the 1-hour (1H) and 15-minute (M15) timeframes for entry confirmation.
The price first sweeps an external liquidity level (PDH or PDL) and then provides an entry opportunity based on Market Structure Shift (MSS) and SMT divergence. Additionally, the entry should be positioned relative to the Midnight Open, meaning long entries should occur below the Midnight Open and short entries above it.
🟣 Bullish Twitter Model
In a bullish setup, the price first sweeps the previous day’s low (PDL) and reaches an external liquidity level. Then, in the 1-hour timeframe (1H), a bullish Fair Value Gap (FVG) forms, which serves as the price target.
To confirm the entry, a Market Structure Shift (MSS) in the 15-minute timeframe (M15) should be observed, signaling a trend reversal to the upside. Additionally, SMT divergence with correlated assets can indicate weakness in selling pressure.
Under these conditions, a long position is taken below the Midnight Open, with a stop-loss placed at the lowest point of the recent bearish move. The price target for this trade is the FVG in the 1-hour timeframe.
🟣 Bearish Twitter Model
In a bearish setup, the price first sweeps the previous day’s high (PDH) and reaches an external liquidity level. Then, in the 1-hour timeframe (1H), a bearish Fair Value Gap (FVG) is identified, serving as the trade target.
To confirm entry, a Market Structure Shift (MSS) in the 15-minute timeframe (M15) should form, signaling a trend shift to the downside. If an SMT divergence is present, it can provide additional confirmation for the trade.
Once these conditions are met, a short position is taken above the Midnight Open, with a stop-loss placed at the highest level of the recent bullish move. The trade's price target is the FVG in the 1-hour timeframe.
🔵 Settings
Bar Back Check : Determining the return of candles to identify the CISD level.
CISD Level Validity : CISD level validity period based on the number of candles.
Daily Position : Determines whether only the first signal of the day is considered or if signals are evaluated throughout the entire day.
Session : Specifies in which trading sessions the indicator will be active.
Second Symbol : This setting allows you to select another asset for comparison with the primary asset. By default, "XAUUSD" (Gold) is set as the second symbol, but you can change it to any currency pair, stock, or cryptocurrency. For example, you can choose currency pairs like EUR/USD or GBP/USD to identify divergences between these two assets.
Divergence Fractal Periods : This parameter defines the number of past candles to consider when identifying divergences. The default value is 2, but you can change it to suit your preferences. This setting allows you to detect divergences more accurately by selecting a greater number of candles.
The indicator allows displaying sessions based on various time zones. The user can select one of the following options :
UTC (Coordinated Universal Time)
Local Time of the Session
User’s Local Time
Show Open Price : Displays the New York market opening price.
Show PDH / PDL : Displays the previous day’s high and low to identify potential entry points.
Show SMT Divergence : Displays lines and labels for bullish ("+SMT") and bearish ("-SMT") divergences.
🔵 Conclusion
The Twitter Model ICT is an effective approach for analyzing and executing trades in financial markets, utilizing a combination of liquidity principles, market structure, and SMT confirmations to identify optimal entry and exit points.
By analyzing the previous day’s high and low (PDH/PDL), Fair Value Gaps (FVG), and Market Structure Shift (MSS) in the 1H and M15 timeframes, traders can pinpoint liquidity-driven trade opportunities. Additionally, considering the Midnight Open level helps traders avoid random entries and ensures better trade placement.
By applying this model, traders can interpret market movements based on liquidity flow and structural changes, allowing them to fine-tune their trading decisions with higher precision. Ultimately, the Twitter Model ICT provides a structured and logical approach for traders who seek to trade based on liquidity behavior and trend shifts in the market.
Volume profile [Signals] - By Leviathan [Mindyourbuisness]Market Sessions and Volume Profile with Sweep Signals - Based on Leviathan's Volume Profile
This indicator is an enhanced version of Leviathan's Volume Profile indicator, adding session-based value area analysis and sweep detection signals. It combines volume profile analysis with market structure concepts to identify potential reversal opportunities.
Features
- Session-based volume profiles (Daily, Weekly, Monthly, Quarterly, Yearly)
- Forex sessions support (Tokyo, London, New York)
- Value Area analysis with POC, VAH, and VAL levels
- Extended level visualization for the last completed session
- Sweep detection signals for key value area levels
Sweep Signals Explanation
The indicator detects two types of sweeps at VAH, VAL, and POC levels:
Bearish Sweeps (Red Triangle Down)
Conditions:
- Price makes a high above the level (VAH/VAL/POC)
- Closes below the level
- Closes below the previous candle's low
- Previous candle must be bullish
Trading Implication: Suggests a failed breakout and potential reversal to the downside. These sweeps often indicate stop-loss hunting above key levels followed by institutional selling.
Bullish Sweeps (Green Triangle Up)
Conditions:
- Price makes a low below the level (VAH/VAL/POC)
- Closes above the level
- Closes above the previous candle's high
- Previous candle must be bearish
Trading Implication: Suggests a failed breakdown and potential reversal to the upside. These sweeps often indicate stop-loss hunting below key levels followed by institutional buying.
Trading Guidelines
1. Use sweep signals in conjunction with the overall trend
2. Look for additional confirmation like:
- Volume surge during the sweep
- Price action patterns
- Support/resistance levels
3. Consider the session's volatility and time of day
4. More reliable signals often occur at VAH and VAL levels
5. POC sweeps might indicate stronger reversals due to their significance as fair value levels
Notes
- The indicator works best on higher timeframes (1H and above)
- Sweep signals are more reliable during active market hours
- Consider using multiple timeframe analysis for better confirmation
- Past performance is not indicative of future results
Credits: Original Volume Profile indicator by Leviathan
Daily Asian RangeDaily Asian Range Indicator
This indicator is an enhanced version inspired by @toodegrees' "ICT Friday's Asian Range" indicator. While maintaining the core concepts, this version expands functionality for daily analysis and adds comprehensive customization options.
### Overview
The Asian Range indicator identifies and visualizes potential liquidity areas based on price action during the Asian session (8:00 PM - 12:00 AM ET). It plots both body and wick ranges along with multiple standard deviation levels that can serve as potential price targets or areas of interest.
### Features
- Flexible Display Options
- Choose between Body, Wick, or Both for range boxes and deviation lines
- Customizable colors, styles, and borders for all visual elements
- Historical sessions display (0-20 previous sessions)
- Advanced Standard Deviation Levels
- Multiple deviation multipliers (1.0, 1.5, 2.0, 2.3, 3.5)
- Separate visualization for body and wick-based deviations
- Clear labeling system for easy identification
- Precise Time Management
- Asian session: 8:00 PM - 12:00 AM ET
- Deviation lines extend through the following trading day
- Proper timezone handling for accuracy
### Usage
- Works on timeframes from 1 to 15 minutes
- Use the range boxes to identify key price levels from the Asian session
- Standard deviation levels can serve as potential targets or areas of interest
- Combine with other indicators for enhanced analysis
### Credits
Original concept and base implementation by @toodegrees
Enhanced and expanded by @Omarqqq
### Disclaimer
This indicator is for educational and informational purposes only. Always conduct your own analysis and use proper risk management.
Volume EquilibriumThe intent behind this indicator is to provide comprehensive information relating to volume compared to multiple timeframes. This indicator allows one to see what the market 'theoretically' sees as 'fair-value' whilst also allowing one to gauge where the price of a stock is headed.
Volume Equilibrium
The main indicator finds the difference between buying volume and selling volume, under the basic presumption that more buying volume indicates greater bullish sentiment and vice versa.
Buying Volume = volume when close price is higher than open price.
Selling Volume = volume when close price is lower than open price.
Volume Balance = Cumulative Buying Volume − Cumulative Selling Volume
Volume Balance is then expressed as a percentage by dividing by total volume
This indicator is composed of three different lengths of the same indicator. Short, Mid, and Long term representations of Volume Equilibrium. The difference between the mid and long term are highlighted so to make it easy to see where volume is going relative to a longer time frame.
HOW TO USE:
At 0 ---> Equilibrium ---> Equal Buying/Selling Volume
Above 0 ---> More buying Volume
Below 0 ---> More selling Volume
Using theory, it is assumed that the price is at a 'fair-value' when the buying/selling volume is at 0. This is of course relative to the respective timeframe of your choosing. More weight given to larger timeframes.
Volume Histogram
It is a basic volume chart that represents the total volume though has highlighted bars so to indicate buying(green) and selling(red) volume. This allows one to see what the indicator is based off of.
Open-Close Oscillator(not needed)
Calculates the average open-close for a selected timeframe and then provides the current closing price relative to that average open-close. Very simply put, values below 0 indicate bearish and values above 0 generally indicate bullishness. This indicator is for a quick reference of price action relative to volume.
Another way to use this indicator, though unique, is to analyze the separate open-close lines themselves. Using the open-close bands, bullishness is defined as increasing closing prices and bearish as decreasing closing prices. So, in regard to this indicator, bear sessions can be indicated by the opening line being below the closing line and bull sessions as the opening line being above. Use the 'flip' of these lines to your advantage, they are very helpful at capturing long continuous sentiment.
This indicator is composed of great information though I still think it best to use many different indicators to help you with your trades.
NOTE: Be aware of what we are trying to analyze, Volume. This means that one should also look out for divergences to capture early indications of reversals. This indicator can be leveraged greatly.
Market Movement After OpenDescription:
This script provides a detailed visualization of market movements during key trading hours: the German market opening (08:00–09:00 UTC+1) and the US market opening (15:30–16:30 UTC+1). It is designed to help traders analyze price behavior in these critical trading periods by capturing and presenting movement patterns and trends directly on the chart and in an interactive table.
Key Features:
Market Movement Analysis:
Tracks the price movement during the German market's first hour (08:00–09:00 UTC+1) and the US market's opening session (15:30–16:30 UTC+1).
Analyzes whether the price moved up or down during these intervals.
Visual Representation:
Dynamically colored price lines indicate upward (green) or downward (red) movement during the respective periods.
Labels ("DE" for Germany and "US" for the United States) mark key moments in the chart.
Historical Data Table:
Displays the past 10 trading days' movement trends in an interactive table, including:
Date: Trading date.
German Market Movement: Up (▲), Down (▼), or Neutral (-) for 08:00–09:00 UTC+1.
US Market Movement: Up (▲), Down (▼), or Neutral (-) for 15:30–16:30 UTC+1.
The table uses color coding for easy interpretation: green for upward movements, red for downward, and gray for neutral.
Real-Time Updates:
Automatically updates during live trading sessions to reflect the most recent movements.
Highlights incomplete periods (e.g., ongoing sessions) to indicate their status.
Customizable:
Suitable for intraday analysis or broader studies of market trends.
Designed to overlay directly on any price chart.
Use Case:
This script is particularly useful for traders who focus on market openings, which are often characterized by high volatility and significant price movements. By providing a clear visual representation of historical and live data, it aids in understanding and capitalizing on market trends during these critical periods.
Notes:
The script works best when the chart is set to the appropriate timezone (UTC+1 for the German market or your local equivalent).
For precise trading decisions, consider combining this script with other technical indicators or trading strategies.
Feel free to share feedback or suggest additional features to enhance the script!
Session High/Low Average & Range [1CG]The Session High/Low Average & Range indicator independently measures the average price movement from the opening price in each direction. It also displays the maximum high and low distance, called Range. Separating the averages and range into highs and lows helps analyze the volatility of the market as well as the direction.
USE EXAMPLES
Session Open
Session Close
Customization
Minimal - 1x and 2x Averages are replaced with custom lines, in order to show distance to3x.
Calculations
Average High: (high price of session - session opening price) / (session period)
Average Low: (session opening price - low price of session) / (session period)
Range High: The highest price of the last (session period)
Range Low: The lowest price of the last (session period)
INPUTS
Session
Here you can choose the hours for your session and time zone. The default is London session in New York time. Next, the session period determines how many sessions to sample from for the average and range lines, the default is 20. Lastly, you can choose the number of sessions to appear on the chart not including the current session if you are in one, 5 by default.
Lines
All of the lines allow you to change the color, width, and style. They also have a label option to choose to display the price. The bottom of the section allows you to change the location and size of the label text.
**Open Line** -Displays the opening price for the length of the session.
**Average Lines** - Displays the 1x, 2x, and 3x the average distance from open in each direction. Additionally, you can toggle a background color to highlight the area.
**Custom Lines** - Displays a customizable multiple of either the average or range. By default the first custom line displays the Range at a 1x multiplier and the second line displays an Average at a 1.5x multiplier
Display Distance
Here you can choose to display the distance from the lines to the open. This data is marked with a “Δ”. For the three Average lines this will display in the area between the line and the open in the position and size of your choice. The custom lines will have the distance information displayed on the line itself. This helps keep the data organized.
Specific Time CandlesSpecific Time Candles Indicator
The Specific Time Candles indicator is a powerful tool designed for traders who want to focus on specific time intervals within their charts. This custom indicator allows you to highlight and analyze price action during user-defined time periods, providing clarity and precision in your trading strategy.
Key Features:
Custom Time Intervals: Select any start and end time to create candles that focus on your preferred trading hours. This is particularly useful for traders who want to concentrate on market sessions, such as the London or New York session, or any other specific time frame relevant to their trading plan.
Enhanced Visualization: By isolating specific time periods, this indicator helps reduce noise and provides a clearer view of market movements during key trading hours. This can be beneficial for identifying trends, reversals, and potential breakout opportunities.
Flexible Configuration: Easily adjust the indicator settings to match your trading schedule. Whether you are a day trader, swing trader, or scalper, you can customize the time frames to suit your needs.
Compatibility: The indicator is compatible with multiple asset classes, including forex, stocks, commodities, and cryptocurrencies, making it a versatile tool for any trader.
User-Friendly Interface: Designed with simplicity in mind, the Specific Time Candles indicator is easy to set up and use, even for those who are new to TradingView.
How to Use:
Add the indicator to your chart from the TradingView library.
Set your desired start and end times in the indicator settings.
Observe the newly formed candles that represent the specified time intervals.
Use these candles to make informed trading decisions based on the focused analysis of market activity during your chosen periods.
Benefits:
Precision Trading: Focus on the most relevant market data, eliminating distractions from other time periods.
Improved Decision-Making: Gain insights into market behavior during critical times, enhancing your ability to make strategic trades.
Time Management: Efficiently manage your trading by concentrating on specific times, allowing for better planning and execution.
The Specific Time Candles indicator is a must-have for traders looking to refine their strategies by concentrating on precise market windows. Whether you are targeting high-volatility periods or specific trading sessions, this indicator provides the tools you need to succeed.
Key Prices & LevelsThis indicator is designed to visualize key price levels & areas for NY trading sessions based on the price action from previous day, pre-market activity and key areas from NY session itself. The purpose is to unify all key levels into a single indicator, while allowing a user to control which levels they want to visualize and how.
The indicator identifies the following:
Asia Range High/Lows, along with ability to visualize with a box
London Range High/Lows, along with ability to visualize with a box
Previous Day PM Session High/Lows
Current Day Lunch Session High/Lows, starts appearing after 12pm EST once the lunch session starts
New York Open (8:30am EST) price
9:53 Open (root candle) price
New York Midnight (12:00am EST) price
Previous Day High/Lows
First 1m FVG after NY Session Start (after 9:30am), with the ability to configure minimum FVG size.
Opening Range Gap, showing regular market hours close price (previous day 16:15pm EST close), new session open price (9:30am EST open) and optionally the mid-point between the two
Asia Range 50% along with 2, 2.5, 4 and 4.5 deviations of the Asia range in both directions
Configurability:
Each price level can be turned off
Styles in terms of line type, color
Ability to turn on/off labels for price levels and highlighting of prices on price scale
Ability to control label text for price levels
How is it different:
Identifies novel concepts such as 9:53 open, root candle that can be used as a bounce/resistance area during AM/PM sessions as well as confirmation of direction once closed over/under to indicate price's willingness to continue moving in the same direction.
It also shows 1st 1m FVG after New York Session open, that can be used to determine direction of the price action depending on PA's reaction to that area. While both 9:53 and 1m FVG are 1m based markers, these levels are visualized by the indicator on all timeframes from 15s to 1h.
Additionally the indicator is able to both highlight key prices in the price scale pane as well as combine labels to minimize clutter when multiple levels have the same price.
Lastly for in-session ranges such as Lunch High/Low the indicator updates the range in real-time as opposed to waiting for the lunch session to be over.
Globex Trap ZoneGlobex Trap Indicator
A powerful tool designed to identify potential trading opportunities by analyzing the relationship between Globex session ranges and Supply & Demand zones during regular trading hours.
Key Features
Tracks and visualizes Globex session price ranges
Identifies key Supply & Demand zones during regular trading hours
Highlights potential trap areas where price might experience significant reactions
Fully customizable time ranges and visual settings
Clear labeling of Globex highs and lows
How It Works
The indicator tracks two key periods:
Globex Session (Default: 6:00 PM - 9:30 AM)
Monitors overnight price action
Marks session high and low
Helps identify potential range breakouts
Supply & Demand Zone (Default: 8:00 AM - 11:00 AM)
Tracks price action during key market hours
Identifies potential reaction zones
Helps spot institutional trading areas
Best Practices for Using This Indicator
Use on 1-hour timeframe or lower for optimal visualization
Best suited for futures and other instruments traded during Globex sessions
Pay attention to areas where Globex range and Supply/Demand zones overlap
Use in conjunction with your existing trading strategy for confirmation
Recommended minimum of 10 days of historical data for context
Settings Explanation
Globex Session: Customizable time range for overnight trading session
Supply & Demand Zone: Adjustable time range for regular trading hours
Days to Look Back: Number of historical days to display (default: 10)
Visual Settings: Customizable colors and transparency for both zones
Important Notes
All times are based on exchange timezone
The indicator respects overnight sessions and properly handles timezone transitions
Historical data requirements: Minimum 10 days recommended
Performance impact: Optimized for smooth operation with minimal resource usage
Disclaimer
Past performance is not indicative of future results. This indicator is designed to be used as part of a comprehensive trading strategy and should not be relied upon as the sole basis for trading decisions.
Updates and Support
I actively maintain this indicator and welcome feedback from the trading community. Please feel free to leave comments or suggestions for improvements.
Gap Detector [MS]This indicator helps traders identify and visualize price gaps in market data. When price movements create gaps between trading sessions or periods, the script highlights these areas with colored clouds and markers.
Key Features:
Automatically detects price gaps based on a customizable gap percentage threshold
Visualizes gaps using color-coded clouds (green when price moves upward, red for downward price action)
Places small triangle markers at gap locations for easy identification of gaps, and if many happen close together
Shows gray clouds when price is within the last gap
Use it For:
Watching for gap-fills
Gap support/resistance levels
Trading gap breakouts
...and more
How it Works:
The script compares each bar's opening price with the previous bar's closing price. A gap is identified when the opening price is significantly different from the previous close (beyond the user-defined gap percentage). The gap area is then marked with a colored cloud:
Green clouds: Show gaps where price jumped higher
Red clouds: Show gaps where price dropped lower
Gray clouds: Indicate price action within the gap
Settings:
Gap %: Controls the minimum price difference required to identify a gap (default 0.01 or 1%)
This indicator can help traders:
Identify potential support/resistance levels at gap areas
Monitor gap-filling scenarios
Spot significant price movements between trading sessions
The script is designed to work across all timeframes and markets.
Session Range Breakouts With Targets [AlgoAlpha]⛓️💥Session Range Breakouts With Targets 🚀
Introducing the "Session Range Breakouts With Targets" indicator by AlgoAlpha, a powerful tool for traders to capitalize on session-based range breakouts and identify precise target zones using ATR-based calculations! Whether you trade the Asian, American, European, or Oceanic sessions, this script highlights key breakout levels and targets that adapt to market volatility, ensuring you're always prepared for those crucial price movements. 🕒📊
Session-based Trading : The indicator highlights session-specific ranges, offering clear breakouts for Asian, American, European, Oceanic, and even custom sessions 🌍.
Adaptive Volatility Zones : Uses ATR to determine dynamic zone widths, filtering out fakeouts and adjusting to market conditions ⚡.
Precise Take-Profit Targets : Set multiple levels of take-profits based on ATR multipliers, ensuring you can manage both aggressive and conservative trades 🎯.
Customizable Appearance : Tailor the look with customizable colors for session highlights and breakout zones to fit your chart style 🎨.
Alerts on Key Events : Built-in alert conditions for breakouts and take-profit hits, so you never miss a trading opportunity 🔔.
🚀 Quick Guide to Using the Indicator
🛠 Add the Indicator : Add the indicator to favorites by pressing the star icon. Choose your session (Asia, America, Europe, Oceana, or Custom) and adjust the ATR length, zone width multiplier, and target multipliers to suit your strategy.
📊 Analyze Breakouts : Watch for the indicator to plot upper and lower range boxes based on session highs and lows. Price breaking through these boxes will signal a potential entry.
📈 Monitor Targets : Track bullish and bearish targets as price moves, with up to three take-profit levels based on ATR multipliers.
🔔 Set Alerts : Enable alerts for session breakouts or when price hits your designated take-profit targets.
🔍 How It Works
This script operates by identifying session-specific ranges based on highs and lows from the beginning of the selected session (Asia, America, Europe, or others). After a user-defined wait period (default: 120 bars), it calculates the highest and lowest points and creates upper and lower zones using the Average True Range (ATR) to adapt to market volatility. If the price breaks above or below these zones, it is identified as a breakout, and the script dynamically calculates up to three take-profit targets for both bullish and bearish scenarios using an ATR multiplier. The indicator also includes alerts for breakouts and take-profit hits, providing real-time trading signals.
NY 5M ORB-COMEX OpenThe indicator is designed to display dynamic and static key market levels, including Opening Range Breakout (ORB) levels, Initial Daily Range (IDR), and other important session levels. It offers extensive customization to accommodate a variety of trading strategies and sessions, all while providing an adaptable user interface for traders to personalize their charts.
#### Key Features:
1. **Session Timings**:
- The script allows you to define regular and extended market hours. These timings can be adjusted using input fields for the market open range, session start, and session end times, with default settings for the U.S. stock market.
2. **Opening Range Breakout (ORB)**:
- You can enable or disable lines for the High/Low (H/L) and Open/Close (O/C) of the first 5-minute candle, which are key for ORB strategies.
- Optional middle lines are provided for both H/L and O/C, offering additional reference points for price action.
3. **Multiple Plot Styles and Line Types**:
- The script includes customization for line styles (Solid, Dashed, or Dotted) and colors for ORB, IDR, and session markers, giving traders flexibility in visualizing key market levels.
4. **Dynamic and Static Levels**:
- Users can choose to display either dynamic or static lines for additional price levels that extend throughout the session. Dynamic levels automatically adapt based on the session’s high and low, while static levels are manually configured.
- These lines can also display labels with the option to turn on or off their visibility.
5. **Custom Time Zone and Session Adjustments**:
- The script offers full flexibility in adjusting session timings based on different time zones, which is crucial for global traders working in different markets.
6. **Background Shading**:
- You can add shading between high and low levels for a more visual representation of ranges during specific sessions (e.g., ORB or IDR), and customize the color and transparency of this background.
7. **Comex Open Indicator**:
- An additional feature highlights the Comex Open, with optional labels, making it useful for traders who follow commodities markets.
#### Known Issues:
- The indicator requires a chart with intraday time frames (e.g., 1-minute, 5-minute) for accurate display.
- Extensive customization may lead to performance issues on lower-end machines or in high-frequency chart environments due to the number of drawn elements (lines, boxes, labels).
This indicator is suitable for advanced traders who need detailed control over their session timing and price level analysis, with multiple layers of customization for visualizing key market behaviors.
Custom 4-Hour Candle Colors with Opening Price LinesDescription:
This indicator enhances the visual clarity of 4-hour candles by allowing users to assign custom colors to each 4-hour time block on their chart. It also provides the option to plot horizontal lines at the opening price of each 4-hour candle, with the lines extending for a customizable duration (up to 36 hours), making it easy to track the opening price levels over time.
Features:
Custom 4-Hour Candle Colors: Define unique colors for each 4-hour candle block on the chart. You can configure the colors for six different 4-hour periods, making it easier to visually differentiate between different parts of the trading day.
Opening Price Lines: The indicator plots horizontal lines at the opening price of each 4-hour candle, with the option to extend the lines for up to 36 hours into the future. The lines can also have different colors, which you can configure separately for each time block.
Flexible Time Configuration: Set custom open times for each 4-hour candle block, allowing you to adjust the indicator to match specific market sessions or time zones.
Fully Customizable: Choose both the candle colors and the opening price line colors independently for each 4-hour period. This allows for a highly personalized chart setup.
Use Cases:
Session Tracking: Easily track different trading sessions by assigning specific colors to different time periods.
Key Price Levels: Keep an eye on important opening price levels throughout the day by extending opening price lines into the future.
Visual Organization: For traders who prefer color-coded charts for improved readability, this indicator helps to organize trading days visually by color-blocking each time segment.
Important Notes:
Due to TradingView’s limitations, the opening price lines can only extend up to 500 bars into the future. The indicator automatically limits the duration of the lines to this maximum.
The script is designed to be flexible and user-friendly, allowing for easy adjustments to suit different trading styles and market conditions.